

|
시장보고서
상품코드
2063936
바이오제조 AI 시장 : 시장 점유율 분석, 업계 동향 및 통계, 성장 예측(2026-2031년)AI In Biomanufacturing - Market Share Analysis, Industry Trends & Statistics, Growth Forecasts (2026 - 2031) |
||||||
 Mordor Intelligence
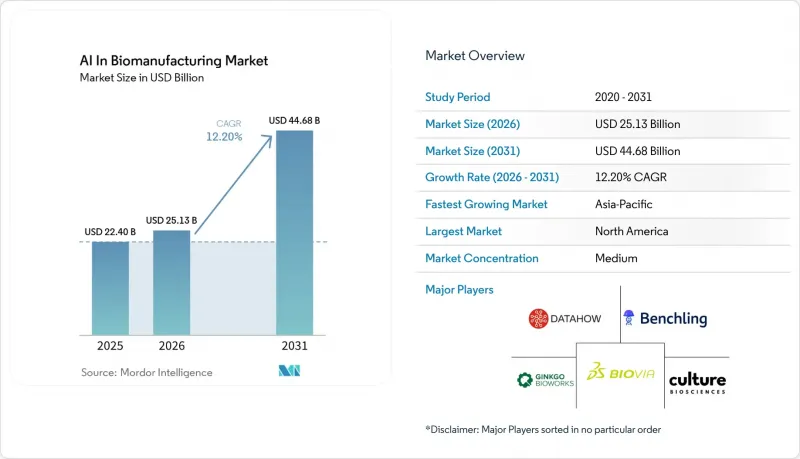
Mordor Intelligence에 의하면, 바이오제조 AI ,시장 규모는 2025년에 224억 달러로 평가되었고 2026년 251억 3,000만 달러로 추정되고, 2031년까지 446억 8,000만 달러에 이를 것으로 예측되며, 예측 기간(2026-2031년) CAGR은 12.20%를 나타낼 전망입니다.
본 보고서는 AI 기술별(머신러닝, 자연어 처리, 컴퓨터 비전, 디지털 트윈, 기타), 제공 형태별(소프트웨어, 하드웨어, 서비스), 용도별(공정 최적화, 품질 관리, 기타), 도입 형태별(클라우드 기반, 온프레미스형, 하이브리드형), 최종 사용자별(제약 및 바이오의약품 산업, 기타), 지역별(북미, 유럽, 아시아태평양, 중동 및 아프리카, 남미)로 분류되어 있습니다. 시장 전망은 금액(달러) 기준으로 제시되어 있습니다.
세계의 바이오제조 AI 시장 동향 및 인사이트
바이오의약품과 바이오시밀러 수요가 AI 투자 우선순위를 재편하고 있습니다.
바이오 제조 산업은 바이오의약품, 바이오시밀러, 첨단 치료법에 대한 수요 증가에 대응하고 있습니다. 이러한 제품에는 더 높은 공정 민감도, 복잡한 규모 확대 기법, 더 엄격한 품질 기준이 요구되며, 이는 지속적인 공정 인텔리전스의 필요성을 높이고 있습니다. 각 제조업체는 노동 효율을 유지하면서 배치 간 편차, 더욱 엄격해진 출시 일정, 시설 간 공정 이전과 같은 과제를 해결해 나가고 있습니다. 또한, 바이오의약품의 특허 만료로 인해 바이오시밀러 제조업체들은 초기 단계부터 비용 효율성과 높은 수율 달성을 요구받고 있습니다. 이러한 변화에 따라 세포 배양 제어, 충전 및 포장 공정, 품질 예측에 중점을 둔 AI 용도이 보급되고 있으며, 제조업체들이 사내에 대규모 팀을 구성하지 않고도 AI 솔루션을 찾는 가운데, 서비스 기반의 도입이 증가하고 있습니다.
바이오프로세스 데이터의 급증으로 생산 등급 AI가 가능해졌습니다.
풍부하고 빈번하게 수집되며 상호 연관된 공정 데이터를 활용할 수 있게 됨에 따라, 바이오 제조 분야에서의 AI 도입이 가속화되고 있습니다. 첨단 플랫폼은 현재 수많은 공정 속성을 모니터링하고, 기존 방식에 비해 훨씬 더 높은 데이터 밀도를 생성함으로써 실시간 품질 평가를 가능하게 하고, 오프라인 검사로 인한 지연을 줄이고 있습니다. 조기 도입 기업들은 후발 기업들이 쉽게 재현할 수 없는 독자적인 프로세스 이력을 모델 훈련에 활용함으로써 경쟁 우위를 확보하고 있습니다. 머신러닝의 발전으로 배양 조건이 최적화되었으며, 복잡한 제조 환경에서의 의사 결정이 개선되고 있습니다. 시장은 알고리즘의 고도화는 물론, 고품질의 재사용 가능한 데이터셋을 보유함으로써 점점 더 형성되어 가고 있습니다.
세분화된 데이터 인프라가 도입의 주요 장애물
바이오 제조 시설에서는 공정 개발, 제조, 품질 관리 시스템 간에 호환되지 않는 형식으로 데이터가 생성됨에 따라 발생하는 문제에 직면해 있습니다. 오랜 기간에 걸쳐 장비를 개별적으로 구매한 결과, 장비 간의 연동이 이루어지지 않았고, 메타데이터에 일관성이 없으며, 부서 간 통합 모델을 학습시키기 위한 맥락이 부족합니다. 이로 인해 팀은 AI 활용 사례를 검증하는 것보다 기록의 일관성을 맞추는 데 더 많은 시간을 할애하게 되어, 도입이 지연되고 있습니다. 또한, 명명 규칙, 센서 데이터, 워크플로우의 차이로 인해 특정 거점에서 학습된 모델이 다른 거점에서는 기대한 만큼의 성능을 발휘하지 못하는 경우가 종종 있습니다. 그 결과, 디지털화가 진전된 거점은 더 빠르게 발전하는 반면, 구식 시스템을 유지하는 거점은 시범 운영 단계에 머물러 있어 기업의 규모 확대가 지연되고, ROI 달성까지 걸리는 기간이 길어지고 있습니다.
부문별 분석
2025년, 바이오제조 AI 시장에서 머신러닝과 딥러닝은 34.55%의 점유율을 차지했으며, 바이오프로세스 분야의 제어, 예측, 최적화를 위한 핵심 기술로서의 입지를 확고히 했습니다. 이러한 우위는 공정 모니터링, 예측 유지보수, 품질 예측에의 응용, 특히 수율이나 불순물의 동향과 같은 구조화된 데이터나 정의된 변수가 존재하는 분야에서 활용되는 데 기인합니다. 머신러닝은 공장의 재설계를 필요로 하지 않으면서도 측정 가능한 가치를 창출하는 실용적인 접근 방식을 제공하며, 지도 학습과 하이브리드 접근 방식이 가장 많은 예산을 확보하고 있습니다. 컴퓨터 비전은 육안 검사, 용기 무결성 점검, 설비 모니터링을 자동화할 수 있는 능력에 힘입어 2031년까지 연평균 성장률(CAGR) 13.23%로 성장할 것으로 전망됩니다. 이 기술은 시각 데이터를 실행 가능한 인사이트으로 전환하여, 무균 환경에서의 규정 준수 및 효율성을 향상시킵니다.
2025년에는 소프트웨어가 시장의 62.45%를 차지한 것으로 평가되었으며, 이는 플랫폼, 분석, 용도를 기존 인프라와 통합하는 역할을 반영한 것입니다. 제조업체는 LIMS나 품질 워크플로우 등의 시스템을 연동하면서도 단계적인 도입이 가능하다는 점에서 이 소프트웨어를 선호하여 도입했습니다. 이러한 유연성 덕분에 기업들은 막대한 하드웨어 투자를 하지 않고도 이용 사례를 테스트할 수 있었습니다. 구매자들이 라이선스보다 성과를 더 중요시하는 경향이 강해짐에 따라, 이 서비스 시장은 2031년까지 연평균 성장률(CAGR) 14.15%를 기록하며 성장할 것으로 예측됩니다. 이 서비스는 프로세스 매핑, 모델 검증, 규정 준수 등 중요한 요구 사항을 충족하며, 규제 환경에서 AI 도구를 운영하기 위해 필수적인 요소로 자리 잡고 있습니다.
지역별 분석
2025년, 북미는 바이오제조 AI 시장 점유율 39.67%를 차지했으며, 지역별로는 가장 큰 기여를 한 지역이 되었습니다. 이 지역은 제약 기업의 본사, 전문 제조업체, CDMO, 디지털 인프라 제공업체가 고도로 집중되어 있다는 장점이 있습니다. 바이오의약품 제조 분야의 선점 우위 덕분에, 많은 사업장에서는 이미 AI 도입에 필요한 데이터 이력과 자동화 기반이 갖춰져 있습니다. FDA의 규제 명확화는 자본 확보, 규제 당국과의 협력, 데이터 성숙도를 조화시켜 북미에서의 입지를 더욱 공고히 하고 있습니다.
유럽은 확립된 바이오의약품 생산 능력과 견고한 규제 및 산업 기반을 모두 갖추고 있어, 바이오제조 AI 시장에서 매우 중요한 역할을 수행하고 있습니다. 독일, 영국, 프랑스, 스위스 등의 국가들은 광범위한 제조 네트워크와 고도의 품질 관리 시스템을 활용하여 지역 활동을 주도하고 있습니다.
아시아태평양은 2031년까지의 연평균 성장률(CAGR)이 15.45%로 예측되어, 가장 빠르게 성장하는 지역 부문이 될 것으로 보입니다. 이 지역의 급속한 성장은 생산 능력 확대, 지원 정책, 디지털 기술의 발전에 힘입어 가속화되고 있습니다. 바이오 제조에 대한 중국의 전략적 중점과, 공정 설계 및 첨단 제조 분야에서 일본의 공동 노력은 AI 주도 혁신과 인프라 개발 측면에서 이 지역의 잠재력을 한층 더 높이고 있습니다.
기타 혜택
- 엑셀 형식 시장 예측(ME) 시트
- 3개월간의 애널리스트 지원
자주 묻는 질문
목차
제1장 서론
제2장 조사 방법
제3장 주요 요약
제4장 시장 구도
제5장 시장 규모 및 성장 예측
제6장 경쟁 구도
제7장 시장 기회 및 향후 전망
AJY 26.06.24According to Mordor Intelligence, the aI in biomanufacturing market size was valued at USD 22.40 billion in 2025 and is estimated to grow from USD 25.13 billion in 2026 to reach USD 44.68 billion by 2031, at a CAGR of 12.20% during the forecast period (2026-2031).
This report is Segmented by AI Technology (ML, NLP, Computer Vision, Digital Twin, Rand More), Offering (Software, Hardware, Services), Application (Process Optimization, QC, Pand More), Deployment Mode (Cloud-Based, On-Premise, Hybrid), End User (Pharma/Biopharma, and More), and Geography (North America, Europe, Asia-Pacific, MEA, South America). The Market Forecasts are Provided in Terms of Value (USD).
Global AI In Biomanufacturing Market Trends and Insights
Biologics and Biosimilars Demand Reshaping AI Investment Priorities
The biomanufacturing industry is responding to the increasing demand for biologics, biosimilars, and advanced therapies. These products require higher process sensitivity, complex scale-up methods, and stricter quality standards, driving the need for continuous process intelligence. Manufacturers are addressing challenges such as batch variability, tighter release timelines, and process transfers across facilities while maintaining labor efficiency. Additionally, patent expirations for biologics are pressuring biosimilar producers to achieve cost efficiency and high yields from the start. This shift has led to AI applications focusing on cell culture control, fill-finish operations, and quality predictions, with service-based adoption rising as producers seek AI solutions without building extensive internal teams.
Bioprocess Data Surge Enabling Production-Grade AI
The availability of abundant, frequent, and connected process data is accelerating AI adoption in biomanufacturing. Advanced platforms now monitor numerous process attributes and generate significantly higher data density compared to traditional methods, enabling real-time quality assessments and reducing delays from offline testing. Early adopters gain a competitive edge by leveraging proprietary process histories for model training, which late entrants cannot easily replicate. Machine learning advancements are optimizing culture conditions, improving decision-making in complex manufacturing environments. The market is increasingly shaped by the ownership of high-quality, transferable datasets alongside algorithm sophistication.
Fragmented Data Infrastructure as the Primary Adoption Ceiling
Biomanufacturing facilities face challenges due to data generated in incompatible formats across process development, manufacturing, and quality systems. Years of isolated equipment purchases have resulted in disconnected instruments, inconsistent metadata, and insufficient context for training cross-functional models. This slows deployment as teams spend more time aligning records than validating AI use cases. Additionally, models trained at one site often underperform at others due to differences in naming conventions, sensor data, and workflows. As a result, digitally advanced sites progress faster, while legacy sites remain in pilot stages, delaying enterprise scaling and extending ROI timelines.
Other drivers and restraints analyzed in the detailed report include:
- Cell and Gene Therapy Pipeline Driving AI-Enabled Scale-Up
- Regulatory Emphasis on PAT and Quality by Design Accelerating AI Adoption
- Talent Shortage Constraining AI Governance Depth and Model Lifecycle Management
For complete list of drivers and restraints, kindly check the Table Of Contents.
Segment Analysis
In 2025, Machine Learning and Deep Learning held a 34.55% share of the AI in biomanufacturing market, establishing their role as core technologies for control, prediction, and optimization in bioprocessing. Their dominance stems from applications in process monitoring, predictive maintenance, and quality forecasting, particularly where structured data and defined variables like yield or impurity trends exist. Machine learning offers a practical entry point for measurable value without factory redesigns, with supervised and hybrid approaches attracting the largest budgets. Computer Vision is projected to grow at a 13.23% CAGR through 2031, driven by its ability to automate visual inspections, container integrity checks, and equipment monitoring. This technology converts visual data into actionable insights, improving compliance and efficiency in sterile environments.
In 2025, software accounted for 62.45% of the market, reflecting its role in integrating platforms, analytics, and applications with existing infrastructure. Manufacturers favored software for its ability to connect systems like LIMS and quality workflows while enabling incremental adoption. This flexibility allowed companies to test use cases without major hardware investments. Services are expected to grow at a 14.15% CAGR through 2031, as buyers increasingly seek outcomes over licenses. Services address critical needs like process mapping, model validation, and compliance, making them essential for operationalizing AI tools in regulated environments.
Geography Analysis
In 2025, North America secured 39.67% of the AI in biomanufacturing market share, making it the leading regional contributor. The region benefits from a high concentration of pharmaceutical headquarters, specialist manufacturers, CDMOs, and digital infrastructure providers. Its early-mover advantage in biologics production ensures many sites already have the necessary data history and automation foundation for AI deployment. Regulatory clarity provided by the FDA further strengthens North America's position, aligning capital availability, regulatory engagement, and data maturity.
Europe plays a pivotal role in the AI in biomanufacturing market, combining established biologics capacity with a strong regulatory and industrial base. Countries like Germany, the United Kingdom, France, and Switzerland drive regional activity with extensive manufacturing networks and advanced quality systems.
Asia-Pacific will be the fastest-growing regional segment, with a projected 15.45% CAGR through 2031. The region's rapid growth is fueled by increasing capacity, supportive policies, and digital advancements. China's strategic focus on biomanufacturing and Japan's collaborative efforts in process design and advanced manufacturing further enhance the region's potential for AI-driven innovation and infrastructure development.
- ABB Ltd.
- Aizon Inc.
- Aspen Technology Inc.
- Benchling Inc.
- BioXcelerate Ltd.
- Culture Biosciences Inc.
- Danaher
- Dassault Systemes SE (BIOVIA)
- DataHow AG
- Emerson Electric
- Ginkgo Bioworks Holdings Inc.
- Honeywell International
- IBM
- Insilico Medicine
- Invert Inc.
- Lonza Group
- Merck KGaA (MilliporeSigma)
- Microsoft Corporation (Azure Life Sciences)
- NVIDIA
- Recursion Pharmaceuticals
- Sartorius
- Siemens Healthineers
- Synthace Ltd.
- TetraScience Inc.
- Thermo Fisher Scientific
Additional Benefits:
- The market estimate (ME) sheet in Excel format
- 3 months of analyst support
TABLE OF CONTENTS
1 Introduction
- 1.1 Study Assumptions & Market Definition
- 1.2 Scope of the Study
2 Research Methodology
3 Executive Summary
4 Market Landscape
- 4.1 Market Overview
- 4.2 Market Drivers
- 4.2.1 Biologics, Biosimilars, and Advanced Therapies Drive Rising Demand and Process Complexity
- 4.2.2 Biopharmaceutical Manufacturing Faces Pressure to Cut Cost of Goods Sold (COGS)
- 4.2.3 Biopharma Embraces Industry 4.0 and Smart Manufacturing Principles
- 4.2.4 Bioprocess Data Surge Fuels AI Model Training and Optimization
- 4.2.5 Cell and Gene Therapy Pipeline Boom Calls for AI-Driven Scale-Up Solutions
- 4.2.6 Regulatory Emphasis on Process Analytical Technology (PAT) and Quality by Design (QbD)
- 4.3 Market Restraints
- 4.3.1 AI Implementation Hindered by Fragmented and Siloed Bioprocess Data Infrastructure
- 4.3.2 Legacy GMP Environments Face High Upfront Capital Costs and Integration Complexity
- 4.3.3 Talent Shortage in Bioprocess Engineering and AI/ML Expertise
- 4.3.4 Uncertainty in Regulatory and Compliance
- 4.4 Value / Supply-Chain Analysis
- 4.5 Regulatory Landscape
- 4.6 Technological Outlook
- 4.7 Porter's Five Forces Analysis
- 4.7.1 Threat of New Entrants
- 4.7.2 Bargaining Power of Suppliers
- 4.7.3 Bargaining Power of Buyers
- 4.7.4 Threat of Substitutes
- 4.7.5 Competitive Rivalry
5 Market Size & Growth Forecasts (Value, USD)
- 5.1 By AI Technology
- 5.1.1 Machine Learning (ML) and Deep Learning
- 5.1.2 Natural Language Processing (NLP)
- 5.1.3 Computer Vision
- 5.1.4 Digital Twin and Simulation AI
- 5.1.5 Reinforcement Learning
- 5.1.6 Generative AI
- 5.1.7 Other AI Technologies (Federated Learning, Physics-Informed Neural Networks, Hybrid AI)
- 5.2 By Offering
- 5.2.1 Software
- 5.2.2 Hardware
- 5.2.3 Services
- 5.3 By Application
- 5.3.1 Process Optimization and Control
- 5.3.2 Quality Control and Assurance
- 5.3.3 Predictive Maintenance
- 5.3.4 Drug Discovery and Development Support
- 5.3.5 Manufacturing Execution and Automation
- 5.3.6 Supply Chain Optimization and Demand Forecasting
- 5.3.7 Regulatory Compliance and Documentation
- 5.3.8 Other Applications
- 5.4 By Deployment Mode
- 5.4.1 Cloud-Based
- 5.4.2 On-Premise
- 5.4.3 Hybrid
- 5.5 By End User
- 5.5.1 Pharmaceutical and Biopharmaceutical Companies
- 5.5.2 Contract Development and Manufacturing Organizations (CDMOs/CMOs)
- 5.5.3 Biotechnology Companies
- 5.5.4 Academic and Research Institutes
- 5.5.5 Food and Beverage Manufacturers
- 5.5.6 Other End Users
- 5.6 By Geography
- 5.6.1 North America
- 5.6.1.1 United States
- 5.6.1.2 Canada
- 5.6.1.3 Mexico
- 5.6.2 Europe
- 5.6.2.1 Germany
- 5.6.2.2 United Kingdom
- 5.6.2.3 France
- 5.6.2.4 Italy
- 5.6.2.5 Spain
- 5.6.2.6 Rest of Europe
- 5.6.3 Asia-Pacific
- 5.6.3.1 China
- 5.6.3.2 India
- 5.6.3.3 Japan
- 5.6.3.4 South Korea
- 5.6.3.5 Australia
- 5.6.3.6 Rest of Asia-Pacific
- 5.6.4 Middle East and Africa
- 5.6.4.1 GCC
- 5.6.4.2 South Africa
- 5.6.4.3 Rest of Middle East and Africa
- 5.6.5 South America
- 5.6.5.1 Brazil
- 5.6.5.2 Argentina
- 5.6.5.3 Rest of South America
- 5.6.1 North America
6 Competitive Landscape
- 6.1 Market Concentration
- 6.2 Market Share Analysis
- 6.3 Company Profiles (includes Global level Overview, Market-level Overview, Core Segments, Financials, Strategic Information, Market Rank/Share, Products & Services, Recent Developments)
- 6.3.1 ABB Ltd.
- 6.3.2 Aizon Inc.
- 6.3.3 Aspen Technology Inc.
- 6.3.4 Benchling Inc.
- 6.3.5 BioXcelerate Ltd.
- 6.3.6 Culture Biosciences Inc.
- 6.3.7 Danaher Corporation (Cytiva)
- 6.3.8 Dassault Systemes SE (BIOVIA)
- 6.3.9 DataHow AG
- 6.3.10 Emerson Electric Co.
- 6.3.11 Ginkgo Bioworks Holdings Inc.
- 6.3.12 Honeywell International Inc.
- 6.3.13 IBM Corporation
- 6.3.14 Insilico Medicine
- 6.3.15 Invert Inc.
- 6.3.16 Lonza Group AG
- 6.3.17 Merck KGaA (MilliporeSigma)
- 6.3.18 Microsoft Corporation (Azure Life Sciences)
- 6.3.19 NVIDIA Corporation
- 6.3.20 Recursion Pharmaceuticals
- 6.3.21 Sartorius AG
- 6.3.22 Siemens AG
- 6.3.23 Synthace Ltd.
- 6.3.24 TetraScience Inc.
- 6.3.25 Thermo Fisher Scientific Inc.
7 Market Opportunities & Future Outlook
- 7.1 White-space & Unmet-need Assessment

(주말 및 공휴일 제외)


