

|
시장보고서
상품코드
2064513
직원 이직 예측 소프트웨어 시장 : 시장 점유율 분석, 산업 동향 및 통계 데이터, 성장 예측(2026-2031년)Employee Attrition Prediction Software - Market Share Analysis, Industry Trends & Statistics, Growth Forecasts (2026 - 2031) |
||||||
 Mordor Intelligence
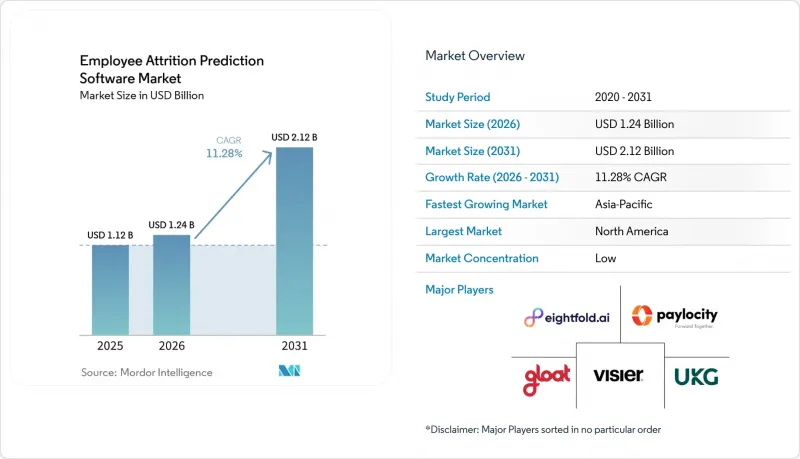
Mordor Intelligence에 의하면, 직원 이직 예측 소프트웨어 시장 규모는 2025년에 11억 2,000만 달러로 평가되었고, 2026년에 12억 4,000만 달러로 추정되고, 2031년까지 21억 2,000만 달러에 이를 것으로 예측되며, 2026-2031년 CAGR 11.28%로 성장할 전망입니다.
본 보고서는 구성 요소별(소프트웨어, 서비스), 용도별(이직 예측 및 이직 위험 점수 산정 등), 배포 방식별(클라우드 기반, 온프레미스), 조직 규모별(대기업, 중소기업), 최종 사용자 산업별(소매업 및 전자상거래 등), 지역별로 분류되어 있습니다. 시장 전망은 금액(달러) 기준으로 제시되어 있습니다.
세계의 직원 이직 예측 소프트웨어 시장 동향 및 인사이트
원치 않는 이직이나 후임자 확보 지연으로 인한 비용 증가
대체 비용의 상승으로 인해, 직원 이직 예측 소프트웨어 시장은 사업부 차원에서 도입을 정당화하기가 더 쉬워지고 있습니다. 이는 인재 유지 기술이 피할 수 있는 인건비와 직접적으로 연결되게 되었기 때문입니다. 직원 1인당 이직 비용은 2025년 3만 6,723달러에서 2026년에는 4만 5,236달러에 달할 것으로 예상되며, 미국 기업의 50%는 2026년에 자발적 이직이 더욱 증가할 것으로 전망하고 있습니다. 이러한 변화가 중요한 이유는 구매 담당자들이 이직을 단순한 인사상의 문제가 아니라 예산에 즉각적인 영향을 미치는 비용 관리상의 문제로 인식하게 되었기 때문입니다. Gloat사의 보고서에 따르면, 관리자가 독자적으로 파악하는 것보다 6주 더 빨리 이직 위험이 높은 직원을 파악함으로써, 해당 직원 중 68%의 이직 방지에 성공했습니다. 또한, 개입 비용은 2만 8,000달러였던 반면, 대체 인력 채용 비용은 34만 달러였으며, 한 사업 부문에서는 총 480만 달러를 절감하는 성과를 거두었습니다. 이직 방지 사례가 조달 협의의 안건으로 다뤄지는 기회가 늘어남에 따라, 직원 이직 예측 소프트웨어 시장은 시범 도입 단계에서 벗어나 주류 인력 투자로 전환되고 있습니다. 현재, 구매를 검토할 때의 실질적인 과제는 기업이 예측형 이직률 개선 소프트웨어가 필요한지 여부보다는 어떤 플랫폼이 사내 채용 비용, 관리자의 업무 흐름, 그리고 개입 능력에 가장 적합한지로 초점이 옮겨가고 있습니다.
이직 위험도 평가에서 AI와 머신러닝의 활용 확대
직원 이직 예측 소프트웨어 시장은 관리자가 눈에 띄는 경고 신호를 감지하기 전에 이직 위험을 파악할 수 있는 신뢰할 수 있는 수단으로서 머신러닝이 널리 받아들여지고 있다는 점에서도 혜택을 보고 있습니다. Lotis Blue의 실증 도입 결과, 머신러닝 모델이 의료 종사자의 이직을 90%의 정확도로 예측한 것으로 나타났으며, 이후 퇴사한 직원 중 45%는 사전에 이직 방지를 위한 상담을 받지 않은 것으로 확인되었습니다. 이 결과는 예측 시스템이 수동 검토에서는 간과되기 쉬운 잠재적 위험을 밝혀낼 수 있기 때문에 그 보급이 확대되고 있다는 견해를 뒷받침하고 있습니다. 또한, 기본적인 보고서만으로는 관리직 수준의 행동을 유도파관 않는 한 결과를 바꿀 수 없기 때문에 구매자들이 대시보드 이상의 것을 기대하게 된 이유도 설명하고 있습니다. 도입이 확대됨에 따라 성과 평가 및 직원 참여도와 관련된 입력 데이터, 그 밖의 인사 데이터가 더욱 복잡해지는 상황에서 모델을 항상 최신 상태로 유지할 수 있는 공급업체가 직원 이직 예측 소프트웨어 시장에서 우위를 점할 가능성이 높을 것입니다. 이로 인해, 특히 인사 프로세스에서 생성형 AI를 이미 활용하고 있는 기업에서는 모델 재조정, 설명 가능성, 데이터 품질 관리에 대한 2차적인 수요가 발생하게 됩니다.
직원 데이터의 개인정보 보호 및 AI 거버넌스 규정 준수
규제 준수 압박은 여전히 직원 이직 예측 소프트웨어 시장의 큰 걸림돌이 되고 있습니다. 많은 고용주들이 이를 고위험 AI 활용 사례로 간주할 수밖에 없기 때문입니다. EU AI법에 대한 법적 분석에 따르면, 투명성, 인간의 감독, 편향성 테스트와 관련된 부속서 III의 의무가 직원의 행동을 평가하거나 이에 영향을 미치는 인력 관리 도구에 적용되며, 또한 규정 준수 기한이 연장된 후에도 계획 요건은 이미 발효된 상태라는 점이 지적되고 있습니다. 이는 법적 검토, 문서화, 거버넌스 설계, 감사 대응이 동일한 프로젝트의 일부가 되었기 때문에 제품 도입이 더 이상 순수한 기술적 작업이 아니게 되었음을 의미합니다. 또한, GDPR(EU 개인정보보호규정) 집행 당국은 계속해서 강력한 압박을 가하고 있으며, 2025년 보고서에 따르면 누적 과징액이 처음으로 50억 유로(54억 달러)를 넘어섰습니다. 직원 이직 예측 소프트웨어 시장에 미치는 영향은 판매 주기의 장기화나 첫해 도입 비용 증가라는 형태로 뚜렷이 나타나고 있으며, 특히 유럽이나 유사한 설명 책임 규정을 가진 관할권에서 두드러집니다. 명확한 동의 절차, 인적 검토 경로, 편향 관리를 제시하지 못하는 공급업체는 제품 자체가 기술적으로 뛰어나더라도 계약 체결까지의 속도가 느려지는 경향이 있습니다.
부문별 분석
서비스 부문은 2031년까지 연평균 성장률(CAGR) 12.91%를 기록하며 성장할 것으로 예상되며, 2025년 시점에서는 소프트웨어가 여전히 핵심 수익 기반임에도 불구하고, 직원 이직 예측 소프트웨어 시장에서 가장 빠르게 성장하는 부문이 될 전망입니다. 이 소프트웨어는 구매자가 처음에 라이선스를 취득하는 예측 엔진, 데이터 모델, 워크플로 로직 및 보고서 인터페이스를 갖추고 있기 때문에 여전히 상업적 가치의 상당 부분을 차지하고 있습니다. 이러한 근본적인 위상 덕분에 소프트웨어는 모든 주요 거래의 중심으로서 그 역할을 계속하고 있습니다. 특히, 지역이나 사업 부문을 아우르며 광범위한 정착률을 가시화하고자 하는 대규모 조직의 경우 더욱 그렇습니다. 동시에, 직원 이직 예측 소프트웨어 업계는 설정, 온보딩 및 부서 간 배포 지원에 의존하는 보다 복잡한 도입 형태로 전환되고 있습니다. 많은 구매자들이 모델의 출력을 관리자의 행동, 정책 변경 및 지속적인 거버넌스 절차로 전환하는 데 도움을 필요로 하고 있기 때문에 서비스 부문의 확장이 가속화되고 있습니다.
직원 이직 예측 소프트웨어 시장이 단순한 대시보드 도입 단계에서 업무에 통합된 운영 단계로 전환됨에 따라, 구현 및 통합 작업의 중요성이 커지고 있습니다. 벤더는 커넥터 설정, 대응책 설계, 알림 조정, 그리고 관리자 도입 촉진에 많은 시간을 할애하고 있습니다. 왜냐하면 이러한 단계들은 모델의 정확도와 마찬가지로 실현되는 가치에 큰 영향을 미치게 되었기 때문입니다. 서비스 팀은 고객 이탈 방지에도 기여하고 있습니다. 왜냐하면, 프로세스 재설계나 변경 지원을 벤더에 의존하고 있는 고객은 해당 플랫폼을 대체 가능한 것으로 간주할 가능성이 낮아지기 때문입니다. 이를 통해 공급업체는 보다 견고한 장기적 관계를 구축할 수 있으며, 이 서비스는 공급업체와 구매자 모두에게 실용적인 직원 유지 수단이 됩니다. 이와 같은 추세에 따라, 공인 파트너 네트워크의 중요성도 커지고 있습니다. 구매자들은 주요 HCM 스택과 기업의 거버넌스 요건을 이미 이해하고 있는 도입 인력을 원하기 때문입니다.
이직 예측 및 이직 위험 점수 산정은 2025년 매출의 36.71%를 차지했으며, 이 이용 사례는 직원 이직 예측 소프트웨어 시장에서 계속해서 핵심적인 위치를 차지하고 있습니다. 많은 기업들이 여전히 이 부분부터 시작하고 있습니다. 왜냐하면 이직 위험도 평가가 인재 데이터를 통해 즉각적인 가치를 보여주는 가장 명확한 방법이기 때문입니다. 이는 인사팀과 직속 관리자에게 명확한 도입 계기를 제공하며, 개입 계획이나 사내 인사 이동 대상 선정과 같은 향후 활용 사례를 위한 데이터 기반을 마련합니다. 그런 의미에서 이직 위험 점수 산정은 수많은 활용 사례 중 하나라기보다는 보다 광범위한 직원 이직 예측 소프트웨어 시장으로 들어가는 실질적인 관문으로 계속해서 자리 잡고 있습니다. 정착 지원 개입 및 처방적 행동 계획 시장은 2031년까지 연평균 성장률(CAGR) 11.92%를 나타낼 것으로 예측되며, 이는 구매자들이 단순한 관찰에 기반한 경고뿐만 아니라 행동으로 이어지는 권고 사항을 점점 더 요구하고 있음을 보여줍니다.
이러한 변화가 중요한 이유는 이 분야가 예측에서 ‘가이드 기반 대응’으로 전환되고 있기 때문입니다. Gloat는 2026년 4월, Microsoft 365 Copilot 및 Microsoft Teams에 사용자 유지율 향상을 위한 권장 사항을 통합했습니다. 이를 통해 관리자는 별도의 용도를 열지 않고도, 익숙한 업무 도구 내에서 위험 신호에 대응할 수 있게 되었습니다. 직원들의 참여도와 감정 분석은 직원들이 직접 이직 의사를 밝히기 전에 이직 위험이 높아지고 있는 이유를 설명해 주는 단서가 되는 초기 맥락을 제공하므로, 여전히 중요한 역할을 하고 있습니다. 또한, 고용주가 감사 압박에 직면하고 있으며, 급여와 관련된 이직률 문제에 대해 타당한 견해를 제시해야 할 필요성이 커지고 있기 때문에 보상 및 임금 격차 분석도 점점 더 중요해지고 있습니다. 인재 계획 및 사내 인사 이동에 대한 분석은 이직 방지율, 재배치, 역량 전략을 단일 계획 프레임워크 내에서 통합하고자 하는 대기업에게 여전히 중요한 위치를 차지하고 있습니다.
지역별 분석
북미는 2025년 직원 이직 예측 소프트웨어 시장 점유율의 37.22%를 차지하며 1위를 유지했습니다. 이 지역은 직원 1인당 이직 비용이 높고, 벤더 기반이 탄탄하며, 정식 소프트웨어 조달 채널을 통해 분석 도구를 도입하는 데 익숙한 기업 구매 담당자들이 존재한다는 점에서 혜택을 보고 있습니다. 미국은 여전히 수요의 중심지 역할을 하고 있습니다. 이는 미국의 고용주들이 높은 대체 비용에 직면해 있을 뿐만 아니라, 일반적으로 유럽의 많은 동종 업계 경쟁사들에 비해 직원 데이터 활용에 관한 규제가 덜 엄격하기 때문입니다. 캐나다도 진전을 보이고 있지만, 개인정보 보호 개혁과 알고리즘의 설명 책임에 대한 기대감으로 인해 도입을 지연시킬 가능성이 있는 규정 준수 대응 부담이 커지고 있습니다. 남미는 여전히 초기 단계에 있으며, 브라질과 칠레가 가장 뚜렷한 수요 거점으로 부상하고 있지만, 그 대부분은 본사에서 선정한 플랫폼을 지역 사업에 적용하는 다국적 기업 내에서의 이용에 국한되어 있습니다.
유럽에서는 기술적 준비 상황뿐만 아니라 규제, 노사 협의, 도입 설계 등이 결과에 영향을 미치기 때문에 각기 다른 양상으로 전개되고 있습니다. 독일, 영국, 프랑스가 여전히 주요 수익원 역할을 하고 있지만, 직원 이직 예측 소프트웨어 시장 내에서는 각기 다른 도입 경로를 밟고 있습니다. 독일은 특히 두드러지는데, 노동자 대표 위원회의 참여가 지연될 경우 공동결정 원칙에 따라 도입 일정이 장기화될 가능성이 있기 때문에 일부 고용주는 개인 단위가 아닌 집계된 직급 단위로 모델을 구축하여 이에 대응하고 있습니다. 영국은 브렉시트 이후의 설명 책임 체계가 EU의 요건을 모두 그대로 반영하고 있는 것은 아니기 때문에 국내 도입에 있어 약간의 시기적 우위를 유지하고 있습니다.
아시아태평양은 2031년까지 연평균 성장률(CAGR) 12.34%를 나타낼 것으로 예측되며, 직원 이직 예측 소프트웨어 시장에서 가장 빠르게 성장하는 지역이 될 전망입니다. 인도에서는 HR 기술의 보급이 확대되고 있는 데다, 특히 세계 역량 센터 환경에서 고용주들이 노동력의 안정성을 지속 가능한 경영상의 우위로 전환하고자 하는 수요가 높아지고 있는 점이 호재로 작용하고 있습니다. 일본은 독자적인 길을 걷고 있으며, 국내 벤더와 기술 기업들이 노동력 부족 및 인재 유지를 위한 과제를 해결하기 위한 제품을 잇달아 출시하고 있습니다. 캐논 일렉트로닉스는 2026년 3월, PC 사용 기록을 행동 지표로 활용한 ‘퇴사 위험 진단 서비스’를 시작했으며, 진저는 2026년 6월 출시를 예정하고 있는 이직 알림 기능을 발표했습니다. 중국과 한국은 시장 규모가 크다는 장점을 가지고 있지만, 현지화 및 데이터 관리에 관한 규제가 제품 아키텍처와 시장 진입을 좌우하기 때문에 해외 벤더들에게는 여전히 진입이 어려운 시장으로 남아 있습니다. 중동은 UAE와 사우디아라비아를 필두로, 노동력의 현지화와 민간 부문 개혁 프로그램을 통해 인재 정착 분석에 대한 관심이 높아지면서 그 중요성이 커지고 있습니다. 아프리카는 여전히 개발도상국이지만, 남아프리카공화국, 나이지리아, 이집트에서는 다국적 기업과 국내 대기업을 중심으로 인사 업무의 디지털화가 진행됨에 따라 도입의 초기 징후가 나타나고 있습니다.
기타 혜택 :
- Excel 형식 시장 예측(ME) 시트
- 3개월간의 애널리스트 지원
자주 묻는 질문
목차
제1장 서론
제2장 분석 방법
제3장 주요 요약
제4장 시장 구도
제5장 시장 규모 및 성장률 예측
제6장 경쟁 구도
제7장 시장 기회 및 향후 전망
AJY 26.06.26According to Mordor Intelligence, the employee attrition prediction software market size is projected to be USD 1.12 billion in 2025, USD 1.24 billion in 2026, and reach USD 2.12 billion by 2031, growing at a CAGR of 11.28% from 2026 to 2031.
This report is Segmented by Component (Software, and Services), Application (Turnover Prediction and Flight-Risk Scoring, and More), Deployment Mode (Cloud-Based, and On-Premises), Organization Size (Large Enterprises, and Small and Medium-Sized Enterprises), End-User Industry (Retail and E-Commerce, and More), and Geography. The Market Forecasts are Provided in Terms of Value (USD).
Global Employee Attrition Prediction Software Market Trends and Insights
Rising Cost of Regrettable Attrition and Backfill Delays
Rising replacement costs have made the employee attrition prediction software market easier to justify at the business-unit level, as retention technology is now tied directly to avoidable labor expense. Turnover cost per worker reached USD 45,236 in 2026, up from USD 36,723 in 2025, and 50% of US companies expected voluntary separations to rise further in 2026. That shift matters because buyers are no longer treating attrition as a soft human resources issue; they are treating it as a cost-control problem with immediate budget consequences. Gloat reported that identifying high-flight-risk employees 6 weeks earlier than managers could do on their own helped retain 68% of flagged employees, while the intervention cost was USD 28,000 against USD 340,000 in replacement outlay, and total savings reached USD 4.8 million in one business unit. As more return cases enter procurement discussions, the employee attrition prediction software market is moving from optional pilot spending to mainstream workforce investment. The practical buying question is now less about whether a company needs predictive retention software and more about which platform best aligns with internal hiring costs, manager workflows, and intervention capacity.
Growing Use of AI and Machine Learning for Flight-Risk Scoring
The employee attrition prediction software market is also benefiting from the wider acceptance of machine learning as a credible way to identify departure risk before managers see visible warning signs. A clinical deployment by Lotis Blue showed that an ML model predicted healthcare worker turnover with 90% accuracy, and 45% of employees who later quit had received no proactive retention conversation. That result supports the view that predictive systems are gaining traction because they can expose silent risk pockets that manual review often misses. It also explains why buyers now expect more than dashboards, because basic reporting alone does not change outcomes unless it triggers action at the manager level. As adoption expands, the employee attrition prediction software market is likely to reward vendors that can keep models current when performance reviews, engagement inputs, and other people's data become noisier. This creates a secondary demand layer for recalibration, explainability, and data-quality controls, especially in enterprises that already use generative AI in HR processes.
Employee Data Privacy and AI Governance Compliance
Compliance pressure remains a major brake on the employee attrition prediction software market, as many employers must now treat it as a high-risk AI use case. Legal analysis of the EU AI Act noted that Annex III obligations on transparency, human oversight, and bias testing apply to workforce tools that assess or influence employee behavior, and that planning requirements are already in effect, even after the compliance timeline was extended. This means product deployment is no longer a pure technology exercise, as legal review, documentation, governance design, and audit readiness are now part of the same project. GDPR enforcement also kept pressure high, with reporting in 2025 showing that cumulative penalties moved past EUR 5 billion (USD 5.4 billion) for the first time. The effect on the employee attrition prediction software market is evident in longer sales cycles and a higher first-year deployment burden, especially in Europe and in jurisdictions with similar accountability rules. Vendors that cannot show clear consent logic, human review pathways, and bias controls face slower conversion even when the product itself is technically strong.
Other drivers and restraints analyzed in the detailed report include:
- Expansion of Cloud-Native HR Analytics and HCM Ecosystems
- CFO-Led Demand to Quantify Attrition Risk in Dollar Terms
- Data Silos and Legacy HRIS Integration Complexity
For complete list of drivers and restraints, kindly check the Table Of Contents.
Segment Analysis
Services are projected to grow at a 12.91% CAGR through 2031, making them the fastest-growing segment of the employee attrition prediction software market,, even though software remained the core revenue base in 2025. Software still anchors most commercial value because it houses the prediction engine, data model, workflow logic, and reporting interface that buyers license first. That base position keeps software central to every major deal, especially in large organizations that want broad retention visibility across regions and business units. At the same time, the employee attrition prediction software industry is moving toward more complex deployments that depend on configuration, onboarding, and cross-functional rollout support. This is why services are expanding faster, because many buyers now need help translating model output into manager actions, policy changes, and ongoing governance routines.
Implementation and integration work have become more important as the employee attrition prediction software market moves beyond simple dashboard deployment into embedded operational use. Vendors are spending more time on connector setup, intervention design, alert calibration, and manager adoption because those steps now affect realized value as much as model accuracy does. Service teams also help reduce customer churn, since accounts that rely on a vendor for process redesign and change support are less likely to treat the platform as replaceable. This gives vendors a stronger long-term relationship and makes services a practical retention tool for both the supplier and the buyer. The same trend is raising the importance of certified partner networks, because buyers want implementation resources that already understand major HCM stacks and enterprise governance requirements.
Turnover prediction and flight-risk scoring accounted for 36.71% of revenue in 2025, keeping this use case at the center of the employee attrition prediction software market. Most enterprises still start here because flight-risk scoring is the clearest way to show immediate value from people data. It provides HR teams and line managers with a clear entry point and lays the data foundation for later use cases, such as intervention planning or internal mobility targeting. In that sense, flight-risk scoring remains the operational gateway to the broader employee attrition prediction software market rather than a single use case among many. Retention intervention and prescriptive action planning are expected to grow at a 11.92% CAGR through 2031, indicating that buyers increasingly want recommendations tied to action, not just flags tied to observation.
This shift matters because the category is moving from prediction toward guided response. Gloat integrated retention recommendations into Microsoft 365 Copilot and Microsoft Teams in April 2026, which let managers respond to risk signals inside familiar work tools instead of opening a separate application. Employee engagement and sentiment analytics still play an important role because they provide early context that helps explain why flight risk is rising before an employee signals intent directly. Compensation and pay equity analytics are also becoming more relevant where employers face audit pressure and need a defensible view of pay-linked retention issues. Workforce planning and internal mobility analytics remain important for large enterprises that want to connect retention, redeployment, and skills strategy within a single planning framework.
Geography Analysis
North America held 37.22% of the employee attrition prediction software market share in 2025, maintaining its lead. The region benefits from high per-worker turnover costs, a dense vendor base, and enterprise buyers accustomed to adopting analytics tools through formal software procurement channels. The United States remains the center of demand because employers there face high replacement costs and generally operate under more permissive employee data-use practices than many of their European peers. Canada is also progressing, though privacy reform and algorithmic accountability expectations are adding a layer of compliance work that can delay deployment. South America remained at an earlier stage, with Brazil and Chile representing the clearest demand pockets, mostly within multinational organizations extending centrally selected platforms into regional operations.
Europe develops through a different pattern because regulation, labor consultation, and deployment design shape outcomes as much as technology readiness. Germany, the United Kingdom, and France remain the main revenue anchors, but each follows a different adoption path inside the employee attrition prediction software market. Germany stands out because co-determination rules can stretch deployment timelines when works councils are engaged late, and some employers have responded by building models at an aggregated grade level rather than at the individual level. The United Kingdom keeps a modest timing advantage in domestic adoption because its post-Brexit accountability framework does not mirror every EU requirement in the same way.
Asia-Pacific is projected to grow at a 12.34% CAGR through 2031, making it the fastest-growing region in the employee attrition prediction software market. India is benefiting from wider HR technology formalization and from employer demand to turn workforce stability into a sustained operating advantage, especially in global capability center environments. Japan is taking a distinct path, with domestic vendors and technology firms launching products that address labor scarcity and retention pressures. Canon Electronics launched its Retirement Risk Diagnosis Service in March 2026 using PC operation logs as behavioral indicators, and Jinjer announced an attrition alert function scheduled for launch in June 2026. China and South Korea offer scale but remain more challenging for foreign vendors because localization and data control rules shape product architecture and market access. The Middle East is becoming more relevant, led by the UAE and Saudi Arabia, as workforce nationalization and private-sector transformation programs raise interest in retention analytics. Africa is still nascent, but South Africa, Nigeria, and Egypt are showing early signs of adoption as HR digitalization deepens across multinational and larger domestic employers.
- Visier, Inc.
- Eightfold AI Inc.
- Culture Amp Pty Ltd
- Perceptyx, Inc.
- One Model Inc.
- Degree, Inc. d/b/a Lattice
- ChartHop, Inc.
- Gloat Ltd.
- Leapsome GmbH
- 15Five, Inc.
- Hi Bob Limited
- Darwinbox Digital Solutions Private Limited
- PeopleStrong Technologies Private Limited
- WorkTango, Inc.
- Qualtrics, LLC
- Bamboo HR LLC
- Cornerstone OnDemand, Inc.
- Dayforce, Inc.
- UKG Inc.
- Paycom Payroll LLC
- Paylocity Corporation
- Career Engagement Group d/b/a Fuel50
Additional Benefits:
- The market estimate (ME) sheet in Excel format
- 3 months of analyst support
TABLE OF CONTENTS
1 INTRODUCTION
- 1.1 Study Assumptions and Market Definition
- 1.2 Scope of the Study
2 RESEARCH METHODOLOGY
3 EXECUTIVE SUMMARY
4 MARKET LANDSCAPE
- 4.1 Market Overview
- 4.2 Market Drivers
- 4.2.1 Rising Cost of Regrettable Attrition and Backfill Delays
- 4.2.2 Expansion of Cloud-Native HR Analytics and HCM Ecosystems
- 4.2.3 Growing Use of AI and Machine Learning for Flight-Risk Scoring
- 4.2.4 Need for Hybrid Workforce Visibility and Continuous Listening
- 4.2.5 Skills-Based Internal Mobility Programs Requiring Predictive Retention Signals
- 4.2.6 CFO-Led Demand to Quantify Attrition Risk in Dollar Terms
- 4.3 Market Restraints
- 4.3.1 Employee Data Privacy and AI Governance Compliance
- 4.3.2 Data Silos and Legacy HRIS Integration Complexity
- 4.3.3 Works Council and Employee Pushback on Digital Exhaust Monitoring
- 4.3.4 GenAI-Generated Feedback Noise Weakening Model Precision
- 4.4 Industry Value Chain Analysis
- 4.5 Regulatory Landscape
- 4.6 Technological Outlook
- 4.7 Impact of Macroeconomic Factors on the Market
- 4.8 Porter's Five Forces Analysis
- 4.8.1 Threat of New Entrants
- 4.8.2 Bargaining Power of Suppliers
- 4.8.3 Bargaining Power of Buyers
- 4.8.4 Threat of Substitutes
- 4.8.5 Intensity of Competitive Rivalry
5 MARKET SIZE AND GROWTH FORECASTS (VALUE)
- 5.1 By Component
- 5.1.1 Software
- 5.1.2 Services
- 5.1.2.1 Implementation and Integration Services
- 5.1.2.2 Consulting and Advisory Services
- 5.1.2.3 Support and Maintenance Services
- 5.2 By Application
- 5.2.1 Turnover Prediction and Flight-Risk Scoring
- 5.2.2 Retention Intervention and Prescriptive Action Planning
- 5.2.3 Employee Engagement and Sentiment Analytics
- 5.2.4 Workforce Planning and Internal Mobility Analytics
- 5.2.5 Compensation, Pay Equity, and Fairness Analytics
- 5.2.6 Other Applications
- 5.3 By Deployment Mode
- 5.3.1 Cloud-Based
- 5.3.2 On-Premises
- 5.4 By Organization Size
- 5.4.1 Large Enterprises
- 5.4.2 Small and Medium-Sized Enterprises
- 5.5 By End-User Industry
- 5.5.1 Information Technology and Telecommunications
- 5.5.2 Banking, Financial Services, and Insurance
- 5.5.3 Healthcare and Life Sciences
- 5.5.4 Retail and E-Commerce
- 5.5.5 Manufacturing
- 5.5.6 Government and Public Sector
- 5.5.7 Other End-User Industries
- 5.6 By Geography
- 5.6.1 North America
- 5.6.1.1 United States
- 5.6.1.2 Canada
- 5.6.1.3 Mexico
- 5.6.2 South America
- 5.6.2.1 Brazil
- 5.6.2.2 Argentina
- 5.6.2.3 Chile
- 5.6.2.4 Rest of South America
- 5.6.3 Europe
- 5.6.3.1 Germany
- 5.6.3.2 United Kingdom
- 5.6.3.3 France
- 5.6.3.4 Italy
- 5.6.3.5 Spain
- 5.6.3.6 Russia
- 5.6.3.7 Rest of Europe
- 5.6.4 Asia-Pacific
- 5.6.4.1 China
- 5.6.4.2 Japan
- 5.6.4.3 India
- 5.6.4.4 South Korea
- 5.6.4.5 Australia
- 5.6.4.6 Rest of Asia-Pacific
- 5.6.5 Middle East
- 5.6.5.1 United Arab Emirates
- 5.6.5.2 Saudi Arabia
- 5.6.5.3 Turkey
- 5.6.5.4 Rest of Middle East
- 5.6.6 Africa
- 5.6.6.1 South Africa
- 5.6.6.2 Nigeria
- 5.6.6.3 Egypt
- 5.6.6.4 Rest of Africa
- 5.6.1 North America
6 COMPETITIVE LANDSCAPE
- 6.1 Market Concentration
- 6.2 Strategic Moves
- 6.3 Market Share Analysis
- 6.4 Company Profiles (includes Global Level Overview, Market Level Overview, Core Segments, Financials as available, Strategic Information, Market Rank/Share, Products and Services, Recent Developments)
- 6.4.1 Visier, Inc.
- 6.4.2 Eightfold AI Inc.
- 6.4.3 Culture Amp Pty Ltd
- 6.4.4 Perceptyx, Inc.
- 6.4.5 One Model Inc.
- 6.4.6 Degree, Inc. d/b/a Lattice
- 6.4.7 ChartHop, Inc.
- 6.4.8 Gloat Ltd.
- 6.4.9 Leapsome GmbH
- 6.4.10 15Five, Inc.
- 6.4.11 Hi Bob Limited
- 6.4.12 Darwinbox Digital Solutions Private Limited
- 6.4.13 PeopleStrong Technologies Private Limited
- 6.4.14 WorkTango, Inc.
- 6.4.15 Qualtrics, LLC
- 6.4.16 Bamboo HR LLC
- 6.4.17 Cornerstone OnDemand, Inc.
- 6.4.18 Dayforce, Inc.
- 6.4.19 UKG Inc.
- 6.4.20 Paycom Payroll LLC
- 6.4.21 Paylocity Corporation
- 6.4.22 Career Engagement Group d/b/a Fuel50
7 MARKET OPPORTUNITIES AND FUTURE OUTLOOK
- 7.1 White-Space and Unmet-Need Assessment


