
|
시장보고서
상품코드
2065482
미국의 미들 마일 배송 : 시장 점유율 분석, 업계 동향 및 통계, 성장 예측(2026-2031년)United States Middle Mile Delivery - Market Share Analysis, Industry Trends & Statistics, Growth Forecasts (2026 - 2031) |
||||||
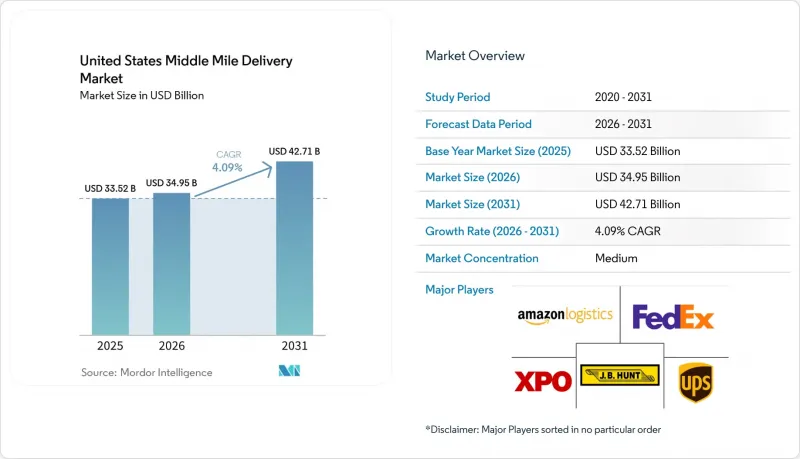
미국의 미들 마일 배송 시장 규모는 2025년에 335억 2,000만 달러로 평가되었습니다. 2026년에 349억 5,000만 달러에 달하고, 2031년까지 427억 1,000만 달러에 이를 것으로 예측되며, 2026년부터 2031년에 걸쳐 CAGR 4.09%로 성장할 전망입니다.
본 보고서는 운송 수단(도로, 철도 등), 비즈니스 모델(B2B, B2C, C2C), 온도대(상온·온도 관리), 배송지(국내·국제), 최종 사용자(전자상거래, 패션 등), 지역(북동부, 남동부 등)별로 분류되어 있습니다. 시장 규모 및 전망은 금액(달러)으로 표시되어 있습니다.
미국의 미들 마일 배송 시장 동향 및 인사이트
미국 2급 대도시권 내 전자상거래 주문의 집중화
2025년, 미국의 전자상거래 매출액은 1조 2,337억 달러에 달하고, 전체 소매 매출의 16.4%를 차지했습니다. 이는 온라인 수요가 여전히 매우 탄탄한 기반을 바탕으로 계속 확대되고 있음을 뒷받침합니다. 2급 대도시권에서 온라인 주문량이 증가함에 따라 콜럼버스, 인디애나폴리스, 샌안토니오 등의 도시에서는 허브 거점 간 전용 셔틀 차선을 유지하는 데 필요한 주문 밀도에 점차 근접하고 있습니다. 그 기준치를 넘으면 화물은 장거리 운송을 위해 집하를 기다릴 필요가 없어지므로, 트레일러의 회전율이 향상되고 미들 마일 일정을 더 예측하기 쉬워집니다. 이러한 변화는 운송업체에 새로운 수익원을 제공하며, 고정 운송 능력을 과도하게 확충하지 않고도 LTL(소량 혼재 운송)과 풀 셔틀 운송 사이를 유연하게 전환할 수 있게 해줍니다. 이러한 노선들은 대규모 물류 센터와 지역 배송 네트워크 사이에 위치해 있으며, 최대 장거리 운송 거리보다 정기적인 운행 빈도가 더 중요하게 여겨지기 때문에 미국의 미들 마일 배송 시장에 이점을 제공합니다.
LTL 네트워크에서 확대되고 있는 AI 기반 동적 장거리 운송 경로 설정 플랫폼
AI 주도의 간선 운송 계획은 시험 단계를 거쳐 미국의 미들 마일 배송 시장의 일상적인 네트워크 운영 단계로 전환되고 있습니다. 2026년 1월, C.H. 로빈슨은 자사의 AI 에이전트가 LTL 화물 수거 누락 점검의 95%를 자동화하여 하루 350시간 이상의 수작업을 줄이고, 불필요한 왕복 운행을 42% 감축하며, 일부 화물의 배송을 최대 하루 앞당기는 데 기여했다고 발표했습니다. 이러한 도구는 운송 사업자가 트레일러를 보다 효율적으로 적재하고, 빈 차 주행 거리를 줄이며, 운송 밀도가 높은 노선에서의 집하 규율을 강화하는 데 도움이 됩니다. 또한, 강력한 데이터 자산이나 첨단 소프트웨어를 보유하지 않은 중소 사업자들은 동적 경로 설정이 표준화되고 있는 노선에서 이익률이 하락함에 따라 경쟁 구도도 변화하고 있습니다. 이 기능이 보급됨에 따라, 그 가치는 단순한 물리적 규모에서 운송 사업자가 실시간으로 활용할 수 있는 노선 데이터, 출하 이력 및 실행 피드백의 질로 점차 전환되고 있습니다.
심화되는 A급 운전기사 부족 현상이 채용 비용을 끌어올리고 있습니다.
운전기사 확보 문제는 미국의 미들 마일 배송 시장에 있어 여전히 단기적인 제약 요인으로 작용하고 있습니다. 특히, 여전히 확보하기 어려운 A급 운전기사에게 의존하고 있는 야간 노선이나 장거리 지역 노선에서 이러한 경향이 두드러집니다. 채용 비용의 상승과 만성적인 이직률 증가로 인해, 화물량이 신규 노선 개설을 뒷받침하고 있는 경우에도 운송업체가 수요에 맞추어 운송 능력을 확대하기가 어려워지고 있습니다. 또한, 교육 및 규정 준수 요건으로 인해 신규 운전기사가 본격적으로 업무에 투입되기까지 걸리는 시간이 길어지면서, 성수기에 사업자가 신속하게 대응할 수 있는 범위가 제한되고 있습니다. 이러한 상황에서는 장거리 운송보다 운전기사의 이직률이 낮은 미들 마일 노선에서 더 짧은 기간 내에 예측 가능한 일정을 제공할 수 있는 운송 사업자가 유리해집니다. 그 결과, 서비스의 일관성은 물리적 네트워크의 커버리지와 마찬가지로, 운전기사 확보 상황에 크게 좌우되는 노동 시장이 형성되고 있습니다.
부문별 분석
2025년, 도로 운송은 미국의 미들 마일 배송 시장 점유율의 65.81%를 차지하며, 동일한 기본 자산 클래스로 인구 밀집 노선과 인구 희박 노선을 모두 커버할 수 있기 때문에 허브 간 운송의 중심적 위치를 유지했습니다. 이러한 우위는 전자상거래 네트워크가 유연한 차량 배차, 빈번한 환적, 그리고 풀필먼트 센터, 크로스독, 지역 분류 거점 간의 직접적인 접근에 의존하고 있다는 현실을 반영하고 있습니다. 연방 정부의 자금을 통해 진행된 고속도로 개선 사업은 정체, 교통 체증, 인터체인지에서의 지연으로 인해 트레일러의 생산성이 저하되었던 구간에서 도로 운송의 경제성을 한층 더 강화하고 있습니다. 대부분의 사업자에게 있어, 출하 시기가 급변하거나 같은 날 여러 지역 거점 간에 화물 경로를 변경해야 하는 경우, 도로 화물 운송은 여전히 기본적인 선택지로 남아 있습니다.
항공 운송은 2026년부터 2031년까지 연평균 성장률(CAGR) 6.91%를 나타낼 것으로 예측되며, 이는 모든 운송 수단 중 가장 빠른 성장 속도입니다. 이는 의약품이나 고부가가치 전자기기의 물류에서 속도가 요구된다는 점을 반영한 것입니다. 철도는 여전히 전체 운송 수단에서 차지하는 비중은 작지만, 신뢰성 향상을 통해 트럭 운송 서비스와의 격차를 좁힐 수 있어, 서비스 품질이 중시되는 노선에서 주목을 받고 있습니다. 2025년 11월, 슈나이더사는 ‘Fast Track’을 출범시켰습니다. 이 회사에 따르면, 이 프리미엄 복합운송 서비스는 주요 미국·멕시코 노선에서 95% 이상의 정시 배송 실적을 달성했으며, 트럭 운송에 비해 최대 2일 더 짧은 운송 시간을 실현했다고 합니다. 해운은 항만 게이트웨이 주변이나 연안 지역의 단거리 운송에서는 여전히 중요하지만, 미국의 미들 마일 배송 시장에서는 일상적인 네트워크 균형 조정 측면에서 도로나 항공에 비해 그 역할이 제한적입니다.
2025년, 미국의 미들 마일 배송 시장에서 B2C가 71.5%를 차지하고 있는 것으로 나타나, 온라인 소매업이 풀필먼트 거점과 지역 배송 거점 간의 화물 운송에 계속해서 큰 영향을 미치고 있음이 부각되었습니다. 이 부문은 의류, 전자기기, 가정용품, 생활용품 보충 등 폭넓은 상품 기반을 바탕으로, 연중 지역별로 안정적인 운송 물량을 창출하고 있습니다. 또한, 그 규모가 크기 때문에 공휴일 성수기나 판촉 기간 중에도 신속하게 재조정할 수 있는 고밀도 셔틀 운행이 가능해집니다. B2C 수요는 많은 출발지-도착지 조합에 분산되어 있기 때문에 운송 사업자에게는 폭넓은 적재 기반이 제공되며, 이는 전용 노선 계획 수립을 정당화하는 데 일조하고 있습니다.
C2C 시장은 2026년부터 2031년까지 연평균 성장률(CAGR) 6.08%를 나타낼 것으로 예측되며, 이는 비즈니스 모델 중 가장 높은 성장률입니다. 이는 재판매 플랫폼이나 개인 간 거래(C2C)로 인해, 여전히 중간 구간에서 집약이 필요한 경량 소포 클러스터가 더욱 많이 생성되기 때문입니다. 이러한 화물 물동량은 개별 출하 단위로는 소규모이지만, 플랫폼을 통해 처리량이 지역별 일관된 운송으로 통합되면 매력적인 규모가 됩니다. B2B는 미국의 미들 마일 배송 시장에서 여전히 중요한 안정 요인으로 작용하고 있습니다. 이는 제조업체나 공급업체로부터의 화물이 예측 가능한 리듬을 제공함으로써, 소비자 대상 화물량이 변동하는 경우에도 자산 계획을 뒷받침하기 위함입니다. B2C의 규모, C2C의 성장, 그리고 B2B의 안정성이 맞물리면서, 사업자들은 공회전 거리를 늘리지 않으면서도 안정적인 계약 경로와 변동성이 큰 플랫폼 주도형 화물을 모두 처리할 수 있는 네트워크를 설계해야 하는 상황에 직면해 있습니다.
기타 혜택 :
- 엑셀 형식 시장 예측(ME) 시트
- 3개월간의 애널리스트 지원
자주 묻는 질문
목차
제1장 서론
제2장 조사 방법
제3장 주요 요약
제4장 시장 구도
제5장 시장 규모 및 성장 예측(금액, 2026-2031년)
제6장 경쟁 구도
제7장 시장 기회 및 향후 전망
KTH 26.06.29According to Mordor Intelligence, the united states middle mile delivery market size is projected to be USD 33.52 billion in 2025, USD 34.95 billion in 2026, and reach USD 42.71 billion by 2031, growing at a CAGR of 4.09% from 2026 to 2031.

This report is Segmented by Transportation Mode (Roadways, Railways, and More), by Business Model (B2B, B2C, and C2C), by Temperature, (Non-Temperature and Temperature Controlled), by Destination, (domestic and International), by End User (E-Commerce, Fashion, and More), and by Region (Northeast, Southeast, and More). The Market Size and Forecasts are Provided in Terms of Value (USD).
United States Middle Mile Delivery Market Trends and Insights
E-Commerce Order Densification Across Tier-2 US Metros
United States e-commerce sales reached USD 1,233.7 billion in 2025, accounting for 16.4% of total retail sales, confirming that online demand is still expanding from a very large base. Rising online volumes in tier-2 metros are pushing cities such as Columbus, Indianapolis, and San Antonio toward the order density needed to support dedicated shuttle lanes between hub nodes. Once that threshold is crossed, freight no longer needs to wait for longer-haul consolidation, improving trailer turns and supporting more predictable middle-mile schedules. That change opens new revenue streams for carriers, allowing them to flex between LTL and full-shuttle loads without overbuilding fixed capacity. The United States middle-mile delivery market benefits because these lanes sit between large fulfillment assets and local delivery networks, where recurring frequency matters more than maximum line-haul distance.
AI-Driven Dynamic Line-Haul Routing Platforms Scaling in LTL Networks
AI-led line-haul planning is moving from testing into daily network operations across the United States middle-mile delivery market. In January 2026, C.H. Robinson said its AI agents automated 95% of LTL missed-pickup checks, saved more than 350 manual hours each day, reduced unnecessary return trips by 42%, and helped some freight move up to 1 day faster. These tools help carriers fill trailers more effectively, cut empty miles, and tighten pickup discipline across dense corridors. They also change the competitive landscape, as smaller operators without strong data assets or software depth face weaker margins on lanes where dynamic routing is becoming standard. As this capability spreads, value is shifting away from pure physical scale and toward the quality of lane data, shipment history, and execution feedback that carriers can apply in real time.
Acute Class-A Driver Shortages Escalating Recruitment Costs
Driver availability remains a near-term restraint for the United States middle-mile delivery market, especially on overnight and longer regional lanes that still rely on hard-to-fill Class-A roles. Rising recruitment expense and persistent turnover make it harder for carriers to scale capacity in step with demand, even when freight volumes support new routes. Training and compliance requirements also lengthen the time required to bring new drivers into regular service, limiting how quickly operators can respond during peak periods. This pressure favors carriers that can offer shorter, more predictable middle-mile schedules, as those routes better meet retention needs than long-haul operations. The result is a labor market in which service consistency depends as much on driver access as on physical network coverage.
Other drivers and restraints analyzed in the detailed report include:
- Infrastructure Investment and Jobs Act Funding for Freight Corridors
- OEM-Led Roll-Out of Autonomous Middle-Mile Truck Pilots on I-10 & I-35
- Chronic Truck-Parking Deficit at Interstate Rest Areas
For complete list of drivers and restraints, kindly check the Table Of Contents.
Segment Analysis
Roadways held 65.81% of the United States middle-mile delivery market share in 2025, keeping them at the center of inter-hub operations because they can serve both dense and thin routes with the same base asset class. Their lead also reflects how e-commerce networks depend on flexible dispatch, frequent reloads, and direct access between fulfillment centers, cross-docks, and local sort points. Highway upgrades supported by federal funding further strengthen road mode economics on corridors where dwell, congestion, and interchange delays had reduced trailer productivity. For most operators, road freight remains the default choice when shipment timing changes quickly or when freight needs to be redirected across multiple regional nodes on the same day.
Airways are projected to grow at a 6.91% CAGR through 2026-2031, the fastest pace among transportation modes, reflecting the need for speed in pharmaceutical and high-value electronics flows. Railways remain a smaller part of the mix, but they are gaining attention on service-sensitive lanes where improved reliability can narrow the gap with truckload service. In November 2025, Schneider launched Fast Track. This premium intermodal, the company said, delivered 95% or better on-time performance and transit times up to 2 days faster than truckload alternatives on key US-Mexico routes. Maritime links still matter around port gateways and for short coastal moves, but in the United States middle-mile delivery market, they play a more limited role than road and air in day-to-day network balancing.
B2C accounted for 71.5% of the United States middle-mile delivery market in 2025, underscoring how online retail continues to shape freight movements between fulfillment sites and local delivery nodes. This segment benefits from a broad product base across apparel, electronics, home goods, and household replenishment, which creates recurring regional volumes throughout the year. Its scale also supports dense shuttle operations that can be reset quickly during holiday peaks or promotional periods. Because B2C demand is spread across many origin-destination pairs, it provides carriers with a broad load base that helps justify dedicated corridor planning.
C2C is forecast to grow at a 6.08% CAGR through 2026-2031, the fastest among business models, as resale platforms and peer-to-peer commerce generate more lightweight parcel clusters that still need middle-mile consolidation. These flows are smaller at the shipment level, but they become attractive once platform volumes are grouped into consistent regional movements. B2B remains an important stabilizer for the US middle-mile delivery market because manufacturer and supplier freight provides a predictable cadence that supports asset planning even when consumer volumes fluctuate. The mix of B2C scale, C2C growth, and B2B stability is pushing operators to design networks that can handle both steady contract lanes and variable platform-driven loads without raising empty mileage.
List of Companies Covered in this Report:
- United Parcel Service (UPS)
- FedEx
- Amazon Logistics
- XPO
- J.B. Hunt Transport Services
- Schneider National
- Knight-Swift Transportation
- Old Dominion Freight Line
- C.H. Robinson Worldwide
- ArcBest Corporation
- Hub Group
- Ryder System
- Lineage Logistics
- DSV
- Penske Logistics
- Werner Enterprises
- Estes Express Lines
- Saia
- GXO Logistics
- GEODIS
- Kuehne + Nagel
- TFI International
Additional Benefits:
- The market estimate (ME) sheet in Excel format
- 3 months of analyst support
TABLE OF CONTENTS
1 Introduction
- 1.1 Study Assumptions & Market Definition
- 1.2 Scope of the Study
2 Research Methodology
3 Executive Summary
4 Market Landscape
- 4.1 Market Overview
- 4.2 Market Drivers
- 4.2.1 E-Commerce Order Densification Across Tier-2 US Metros
- 4.2.2 AI-Driven Dynamic Line-Haul Routing Platforms Scaling in LTL Networks
- 4.2.3 Infrastructure Investment and Jobs Act Funding for Freight Corridors
- 4.2.4 Decentralized Micro-Fulfillment Hubs Shortening Regional Replenishment Loops
- 4.2.5 OEM-Led Roll-Out of Autonomous Middle-Mile Truck Pilots on I-10 & I-35
- 4.2.6 Railroads Launching Premium Expedited Intermodal Services (Less than 600-Mile Lanes)
- 4.3 Market Restraints
- 4.3.1 Acute Class-A Driver Shortages Escalating Recruitment Costs
- 4.3.2 Chronic Truck-Parking Deficit at Interstate Rest Areas
- 4.3.3 Port and Rail Yard Dwell-Time Volatility Post-2021 Congestion
- 4.3.4 Capital Intensity of Temperature-Controlled Cross-Dock Networks
- 4.4 Regulatory Framework
- 4.5 Value Chain and Distribution Channel Analysis
- 4.6 Technology Innovations Outlook
- 4.7 Porter's Five Forces
- 4.7.1 Threat of New Entrants
- 4.7.2 Bargaining Power of Suppliers
- 4.7.3 Bargaining Power of Buyers
- 4.7.4 Threat of Substitutes
- 4.7.5 Rivalry Among Competitors
- 4.8 Insights on Warehousing & Distribution Centers
- 4.9 Insights on Refrigerated Middle-Mile Delivery
- 4.10 Impact of Geo-Political Events on Supply Chain Shifts
5 Market Size & Growth Forecasts (Value, 2026-2031)
- 5.1 By Transportation Mode
- 5.1.1 Roadways
- 5.1.2 Railways
- 5.1.3 Airways
- 5.1.4 Maritime
- 5.2 By Business Model
- 5.2.1 Business-to-Business (B2B)
- 5.2.2 Business-to-Consumer (B2C)
- 5.2.3 Customer-to-Consumer (C2C)
- 5.3 By Temperature Control
- 5.3.1 Non-Temperature Controlled
- 5.3.2 Temperature Controlled
- 5.4 By Destination
- 5.4.1 Domestics
- 5.4.2 International
- 5.5 By End User Industry
- 5.5.1 E-commerce Retail
- 5.5.2 Fashion and Lifestyle
- 5.5.3 Beauty, Wellness and Personal Care
- 5.5.4 Home and Furniture
- 5.5.5 Consumer Electronics and Appliances
- 5.5.6 Healthcare and Medical Supplies
- 5.5.7 Others
- 5.6 By Region
- 5.6.1 Northeast
- 5.6.2 Southeast
- 5.6.3 Midwest
- 5.6.4 Southwest
- 5.6.5 West
6 Competitive Landscape
- 6.1 Market Concentration
- 6.2 Key Strategic Moves
- 6.3 Market Share Analysis
- 6.4 Company Profiles (includes Global level Overview, Market level overview, Core Segments, Financials as available, Strategic Information, Market Rank/Share for key companies, Products & Services, and Recent Developments)
- 6.4.1 United Parcel Service (UPS)
- 6.4.2 FedEx
- 6.4.3 Amazon Logistics
- 6.4.4 XPO
- 6.4.5 J.B. Hunt Transport Services
- 6.4.6 Schneider National
- 6.4.7 Knight-Swift Transportation
- 6.4.8 Old Dominion Freight Line
- 6.4.9 C.H. Robinson Worldwide
- 6.4.10 ArcBest Corporation
- 6.4.11 Hub Group
- 6.4.12 Ryder System
- 6.4.13 Lineage Logistics
- 6.4.14 DSV
- 6.4.15 Penske Logistics
- 6.4.16 Werner Enterprises
- 6.4.17 Estes Express Lines
- 6.4.18 Saia
- 6.4.19 GXO Logistics
- 6.4.20 GEODIS
- 6.4.21 Kuehne + Nagel
- 6.4.22 TFI International
7 Market Opportunities & Future Outlook
- 7.1 White-space & Unmet-Need Assessment
