
|
시장보고서
상품코드
2065746
유럽의 버스 시장 : 시장 점유율 분석, 업계 동향 및 통계, 성장 예측(2026-2031년)Europe Bus - Market Share Analysis, Industry Trends & Statistics, Growth Forecasts (2026 - 2031) |
||||||
Mordor Intelligence에 의하면, 유럽의 버스 시장 규모는 2025년 58억 4,000만 달러로 평가되었고, 2026년에는 63억 7,000만 달러로 추정되고, 2026-2031년 CAGR 9.13%로 성장을 지속할 전망이며, 2031년에는 98억 5,000만 달러에 이를 것으로 예측됩니다.

본 보고서는 데크 유형별(싱글 및 더블), 용도별(노선버스 등), 연료 유형별(디젤, 배터리 전기 등), 좌석 수별(30석 이하 등), 버스 전장별(9미터 이하, 9-12미터, 12미터 초과) 및 지역별로 분류되어 있습니다. 시장 전망은 금액(달러) 및 수량(대) 단위로 제시되어 있습니다.
유럽의 버스 시장 동향 및 인사이트
EU의 친환경 버스 규제(2025년 및 2030년 목표)
'청정 차량 지침'에 따라, 회원국은 2025년까지 조달하는 버스의 상당 부분을 청정 차량으로 확보해야 하며, 이 요건은 2030년까지 더욱 강화될 예정입니다. 특히, 이 버스 중 절반은 무공해 구동 시스템을 갖추어야 합니다. 이에 대응하여 각 사업자들은 체제를 정비하고 있습니다. 예를 들어, DB Regio사는 수천 대 규모에 달하는 다년간에 걸친 대규모 발주를 진행하고 있습니다. 이러한 움직임은 잠재적인 제재를 피할 뿐만 아니라, 배터리식 전기 버스 플랫폼에 대한 수요를 확고히 하는 것입니다. 규제를 크게 상회하는 대응이 진행되고 있음은 분명합니다. 2024년에는 EU 내에서 도입된 신형 시내버스의 거의 절반이 무공해 차량이었으며, 이는 전년 대비 현저한 증가세를 보였으며, 차량 계획의 전환을 여실히 보여주고 있습니다. 각 회원국의 규제에 대응할 수 있는 모듈형 플랫폼을 갖춘 OEM 기업들은 가장 큰 혜택을 누릴 수 있는 입장에 있으며, 급속한 규모 확대를 위한 준비를 갖추고 있습니다.
도시 지역의 저·무배출 구역 확대
유럽 전역의 35개 도시가 제로 배출 구역을 도입하거나 발표했으며, 특정 구역 내 디젤 버스 운행을 사실상 금지하고 있습니다. 이러한 움직임으로 인해 내연기관(ICE) 차량의 조기 폐차가 가속화되고 있습니다. 현재 런던에서는 1,800대 이상의 전기 버스가 운행되고 있으며, 2025년 이후 새로 도입되는 모든 2층 버스는 무공해 차량이어야 합니다. 마찬가지로 파리도 2025년까지 RATP의 차량을 완전히 전기화할 계획을 추진 중이며, 이를 위해서는 4,700대의 전기버스와 이에 따른 충전 인프라 구축이 필요합니다. 이러한 제로 배출 구역의 도입으로 인해 시장은 양극화되고 있습니다. 도심 지역의 사업자들은 엄격한 준수 기한으로 인해 어려움을 겪고 있는 반면, 교외 지역의 사업자들은 여전히 디젤 차량 사용에 유연성을 보이고 있으며, 도시의 역사 지구를 능숙하게 주행할 수 있는 기동성이 뛰어난 9미터 미만 버스에 대한 수요가 증가하고 있습니다.
국가의 전기 버스 구매 보조금 단계적 감축
독일에서는 KsNI 보조금이 정가보다 상당히 낮은 수준으로 인하되었습니다. 한편, 영국의 ZEBRA 프로그램은 2024년 3월에 종료되었으나, 당분간 이를 대체할 제도는 보이지 않습니다. 자금 조달 문제를 극복하기 위해 각 사업자들은 다임러나 볼보와 같은 OEM 제조업체와 배터리 리스 및 잔존가치 계약을 체결하고 있습니다. 자금 면에서의 제약을 고려할 때, 지방 버스 사업자들은 전기화 도입을 미룰 가능성이 있으며, 새로운 재정 조치가 도입될 때까지 수주 건수가 일시적으로 감소할 우려가 있습니다.
부문별 분석
2층 버스 시장 규모는 2031년까지 연평균 성장률(CAGR) 9.15%로 확대될 전망입니다. 따라서 2025년에는 단층 버스가 81.31%의 점유율을 차지했으나, 유럽에서 이 차종 시장 규모는 단층 버스보다 더 빠른 속도로 확대될 전망입니다. 최근 계약 사례로는 Go-Ahead Oxford사에 Wrightbus사의 ‘StreetDeck Electroliner’ 104대를 납품한 것과, 아일랜드 국가교통청(National Transport Authority)이 800대 규모의 기본 계약을 체결한 것 등을 들 수 있으며, 이는 영국과 아일랜드에서 강력한 차량 교체 수요가 있음을 보여주고 있습니다. 중국의 여러 OEM 업체들도 이 부문에 진출을 시도하고 있으며, Yutong사의 ‘U11DD’ 시험 차량은 장거리 도시 간 운행을 목적으로 662 kWh의 배터리용량을 갖추고 있습니다. 이러한 성장은 특히 런던, 더블린, 벨파스트에서 제한된 갓길 공간 내에서 대용량 차량에 대한 수요와 밀접한 관련이 있습니다.
싱글 데커 버스는 도입 비용이 저렴하고, 차고 제한이 완만하며, 서비스 네트워크가 잘 구축되어 있어 일상적인 도시 운행에서 앞으로도 주류를 이룰 것으로 보입니다. 그러나 그 성장률이 둔화되고 있는 점을 고려할 때, 폭발적인 판매량 증가라기보다는 점진적인 확대에 그칠 것으로 보입니다. 각 OEM 업체의 차별화는 유럽 대륙 전역에서 도어 위치나 내장 사양이 서로 다른 경우에도 신속하게 형식 인증을 받을 수 있는 모듈식 레이아웃을 제공할 수 있는지 여부에 달려 있습니다.
2025년 납품 대수의 67.37%를 노선버스가 차지했으나, 2031년까지 장거리 도시 간 노선 및 관광버스 용도가 9.21%라는 가장 높은 연평균 성장률(CAGR)을 기록하며 유럽 버스 시장을 변화시킬 것으로 보입니다. 볼보의 ‘8900 Electric’은 스웨덴의 Svealandstrafiken사로부터 60대를 수주했으며, 한편 DB Regio사는 지역 노선 운행을 위해 BYD가 제조한 전기 관광버스 200대를 도입했습니다. 각 사업사는 베를린-함부르크나 마드리드-발렌시아와 같은 주요 노선에서 디젤 차량을 대체하기로 결정한 결정적인 요인으로 500-700km의 공인 주행 거리를 꼽고 있습니다.
스쿨버스 및 전세버스 시장 규모는 여전히 작지만, EU의 접근성 규정을 준수하기 위해 단차가 없는 저상형 버스로의 전환이 수요를 서서히 끌어올리고 있습니다. 도시 내 노선용과 도시 간 노선용 두 모델 모두에서 구동계 및 전자 장비를 공유하는 플랫폼을 갖춘 OEM 각사는 규모의 경제 효과를 누리고 이익률을 높이는 동시에, 사업자 측의 부품 재고 관리를 간소화하고 있습니다.
기타 혜택 :
- 엑셀 형식 시장 예측(ME) 시트
- 3개월간의 애널리스트 지원
자주 묻는 질문
목차
제1장 서론
제2장 조사 방법
제3장 주요 요약
제4장 시장 구도
제5장 시장 규모 및 성장 예측
제6장 경쟁 구도
제7장 시장 기회 및 향후 전망
LSHAccording to Mordor Intelligence, the europe bus market size is expected to grow from USD 5.84 billion in 2025 to USD 6.37 billion in 2026 and is forecast to reach USD 9.85 billion by 2031 at a 9.13% CAGR over 2026-2031.
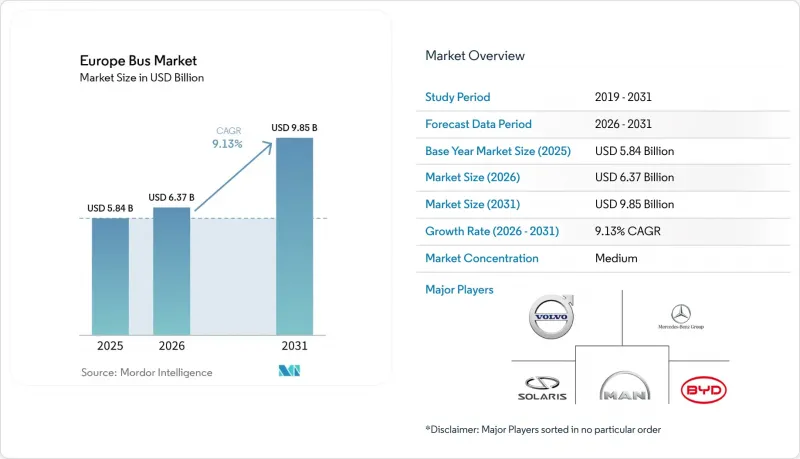
This report is Segmented by Deck Type (Single and Double), Application (Transit Bus and More), Fuel Type (Diesel, Battery Electric, and More), Seating Capacity (Up To 30 Seats and More), Bus Length (Up To 9 M, 9-12 M, and More Than 12 M), and Geography. Market Forecasts are Provided in Value (USD) and Volume (Units).
Europe Bus Market Trends and Insights
EU Clean-Bus Mandate (2025/30 Targets)
Under the Clean Vehicle Directive, member states must ensure that by 2025, a significant percentage of procured buses are clean, with this requirement increasing further by 2030 . Notably, half of these buses must feature zero-emission drivetrains. In response, operators are securing their positions: DB Regio, for instance, has placed a substantial multi-year order for thousands of units. This move not only sidesteps potential penalties but also solidifies demand for battery-electric platforms. Evidence of over-compliance is apparent: in 2024, nearly half of new city buses delivered in the EU were zero-emission, a notable increase from the previous year, showcasing a shift in fleet planning . OEMs boasting modular platforms adaptable to various member-state regulations stand to gain the most, positioning themselves for rapid scaling.
Expansion of Urban Low-/Zero-Emission Zones
Thirty-five cities across Europe have either implemented or announced zero-emission zones, effectively banning diesel buses in specific areas. This move is hastening the early retirement of internal combustion engine (ICE) assets. London currently boasts over 1,800 electric buses and has mandated that all new double-decker buses must be zero-emission starting in 2025 . Similarly, Paris is on track to fully electrify its RATP fleet by 2025, necessitating 4,700 electric buses and corresponding charging infrastructure upgrades. These zero-emission zones have led to a divided market: urban operators grapple with strict compliance deadlines, while their suburban counterparts still have the flexibility to use diesel, driving up the demand for nimble sub-9-meter buses adept at navigating the city's historic districts.
Phase-Down of National E-Bus Purchase Subsidies
Germany has reduced its KsNI subsidy to a significantly lower portion of the list price. Meanwhile, the UK's ZEBRA program lapsed in March 2024, and there's no immediate replacement in sight. To navigate financing challenges, operators are turning to battery-leasing and residual-value agreements with OEMs like Daimler and Volvo. Given their capital constraints, regional fleets might postpone electrification, leading to a temporary dip in orders until fresh fiscal solutions are introduced.
Other drivers and restraints analyzed in the detailed report include:
- Post-COVID Public-Transport Ridership Rebound
- EU Recovery and Resilience Facility Capital Spending
- Depot Grid-Connection and Power-Capacity Delays
For complete list of drivers and restraints, kindly check the Table Of Contents.
Segment Analysis
Double-deckers are advancing at a 9.15% CAGR through 2031. The Europe bus market size for this deck type will therefore widen faster than that of single-decks, even though single-decks commanded 81.31% share in 2025. Recent contracts include 104 Wrightbus StreetDeck Electroliners delivered to Go-Ahead Oxford and an 800-unit framework awarded by Ireland's National Transport Authority, signaling strong replacement demand in the UK and Ireland. Chinese OEMs are also testing the segment: Yutong's U11DD trial offers 662 kWh of battery capacity aimed at long-range intercity work. Growth is tied to the need for high-capacity vehicles on constrained curb space, especially in London, Dublin, and Belfast.
Single-deckers will keep dominating everyday urban operations because of lower acquisition cost, broader height clearance, and mature service networks. However, their slower growth rate suggests incremental rather than breakout volume. OEM differentiation will hinge on offering modular layouts that can be homologated quickly for varying door positions and interior specifications across continental Europe.
Transit buses drove 67.37% of 2025 deliveries but intercity and motorcoach applications will post the quickest 9.21% CAGR to 2031, transforming the Europe bus market. Volvo's 8900 Electric secured 60-unit orders from Sweden's Svealandstrafiken, while DB Regio added 200 BYD electric coaches to serve regional corridors. Operators cite 500-700 km certified range as the tipping point for diesel replacement on popular lines such as Berlin-Hamburg and Madrid-Valencia.
Although school and charter niches remain small, the shift toward step-free, low-entry coach designs to comply with EU accessibility mandates adds incremental demand. OEMs with platforms that share drivetrains and electronics across transit and intercity variants capture scale efficiencies, boosting margins while simplifying parts inventory for operators.
List of Companies Covered in this Report:
- BYD Company Ltd
- Daimler Buses (Mercedes-Benz Group AG)
- MAN Truck & Bus SE
- Volvo Group
- Solaris Bus & Coach
- Traton Group (Scania, Volkswagen CVI)
- IVECO Group (Heuliez Bus)
- VDL Bus & Coach
- Alexander Dennis Ltd
- Wrightbus
- Ebusco Holding NV
- Yutong Europe
- Irizar e-Mobility
- Van Hool
- Otokar Otomotiv
- Rampini Carbri
- Karsan
- Unvibus
- Hyzon Motors
Additional Benefits:
- The market estimate (ME) sheet in Excel format
- 3 months of analyst support
TABLE OF CONTENTS
1 Introduction
- 1.1 Study Assumptions & Market Definition
- 1.2 Scope of the Study
2 Research Methodology
3 Executive Summary
4 Market Landscape
- 4.1 Market Overview
- 4.2 Market Drivers
- 4.2.1 EU Clean-Bus Mandate (2025/30 Targets)
- 4.2.2 Expansion of Urban Low-/Zero-Emission Zones
- 4.2.3 EU Recovery and Resilience Facility Capital Spending
- 4.2.4 Post-COVID Public-Transport Ridership Rebound
- 4.2.5 OEM "Battery-As-A-Service" and Residual-Value Guarantees
- 4.2.6 Growth of Intercity Low-Entry E-Bus Tenders
- 4.3 Market Restraints
- 4.3.1 Phase-Down of National E-Bus Purchase Subsidies
- 4.3.2 Depot Grid-Connection and Power-Capacity Delays
- 4.3.3 Professional-Driver Shortages
- 4.3.4 High Upfront Cost of Hydrogen Fuel-Cell Buses
- 4.4 Value / Supply-Chain Analysis
- 4.5 Regulatory Landscape
- 4.6 Technological Outlook
- 4.7 Porter's Five Forces
- 4.7.1 Bargaining Power of Suppliers
- 4.7.2 Bargaining Power of Buyers
- 4.7.3 Threat of New Entrants
- 4.7.4 Threat of Substitutes
- 4.7.5 Competitive Rivalry
5 Market Size & Growth Forecasts (Value (USD) and Volume (Units))
- 5.1 By Deck Type
- 5.1.1 Single
- 5.1.2 Double
- 5.2 By Application
- 5.2.1 Transit Bus
- 5.2.2 Intercity Bus / Motorcoach
- 5.2.3 School Bus
- 5.2.4 Others
- 5.3 By Fuel Type
- 5.3.1 Diesel
- 5.3.2 Battery Electric
- 5.3.3 Plug-in Hybrid
- 5.3.4 Fuel Cell Electric
- 5.3.5 Others
- 5.4 By Seating Capacity
- 5.4.1 Up to 30 seats
- 5.4.2 31 - 50 seats
- 5.4.3 More than 50 seats
- 5.5 By Bus Length
- 5.5.1 Up to 9 m
- 5.5.2 9 - 12 m
- 5.5.3 More than 12 m
- 5.6 By Country
- 5.6.1 Germany
- 5.6.2 France
- 5.6.3 United Kingdom
- 5.6.4 Italy
- 5.6.5 Spain
- 5.6.6 Rest of Europe
6 Competitive Landscape
- 6.1 Market Concentration
- 6.2 Strategic Moves
- 6.3 Market Share Analysis
- 6.4 Company Profiles (includes Global Level Overview, Market Level Overview, Core Segments, Financials as Available, Strategic Information, Market Rank/Share for Key Companies, Products and Services, SWOT Analysis, and Recent Developments)
- 6.4.1 BYD Company Ltd
- 6.4.2 Daimler Buses (Mercedes-Benz Group AG)
- 6.4.3 MAN Truck & Bus SE
- 6.4.4 Volvo Group
- 6.4.5 Solaris Bus & Coach
- 6.4.6 Traton Group (Scania, Volkswagen CVI)
- 6.4.7 IVECO Group (Heuliez Bus)
- 6.4.8 VDL Bus & Coach
- 6.4.9 Alexander Dennis Ltd
- 6.4.10 Wrightbus
- 6.4.11 Ebusco Holding NV
- 6.4.12 Yutong Europe
- 6.4.13 Irizar e-Mobility
- 6.4.14 Van Hool
- 6.4.15 Otokar Otomotiv
- 6.4.16 Rampini Carbri
- 6.4.17 Karsan
- 6.4.18 Unvibus
- 6.4.19 Hyzon Motors
7 Market Opportunities & Future Outlook
- 7.1 White-space & Unmet-need Assessment
