
|
시장보고서
상품코드
2065747
MRI 분야 AI 시장 : 점유율 분석, 업계 동향과 통계, 성장 예측(2026-2031년)Artificial Intelligence (AI) In MRI - Market Share Analysis, Industry Trends & Statistics, Growth Forecasts (2026 - 2031) |
||||||
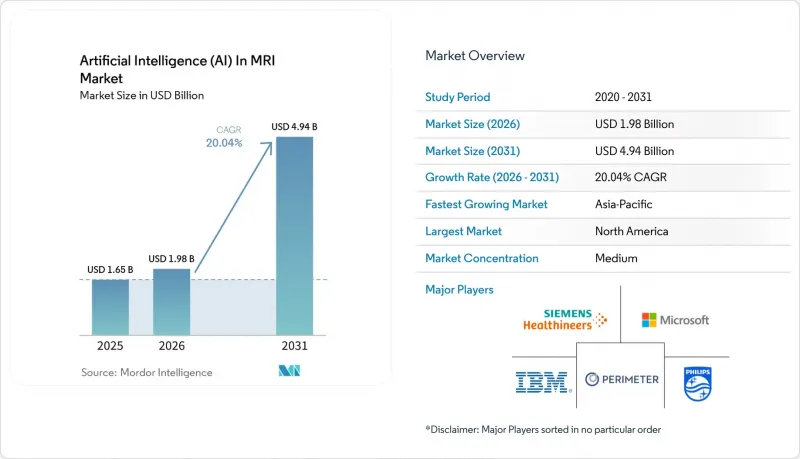
Mordor Intelligence에 의하면, MRI 분야 AI 시장 규모는 2025년 16억 5,000만 달러에서 2026년에는 19억 8,000만 달러로 확대되어 2026년부터 2031년까지 CAGR 20.04%로 성장을 지속하여, 2031년에는 49억 4,000만 달러에 이를 것으로 예측됩니다.
본 보고서에서는 임상 용도별(근골격계, 종양학, 간, 심혈관계 등), 솔루션별(소프트웨어, 서비스), 기술별(딥러닝, 머신러닝, 컴퓨터 비전 등), 배포 유형별(On-Premise, 클라우드 기반), 최종 사용자별(병원, 진료소 등), 지역별(북미, 유럽, 아시아태평양 등)로 분류하고 있습니다.
전 세계 MRI 분야 AI 시장 동향과 인사이트
신기술 추가 지불(NTAP)으로의 상환 제도 전환
메디케어가 FDA 승인을 받은 AI MRI 도구를 대상으로 신기술 추가 지급(NTAP)을 확대함에 따라, AI는 선택적 지출 항목에서 보험 적용 대상 서비스로 전환되었습니다. 현재 이 시스템은 스캔 1회당 알고리즘 비용을 회수할 수 있게 되어 예측 가능한 수익을 창출하고 있으며, 기업 내 도입을 가속화하고 있습니다. 민간 보험사는 일반적으로 12-18개월 이내에 메디케어의 동향을 따라가게 되므로, 지급 대상 범위가 확대됩니다. NTAP 기준을 충족하는 공급업체들로부터는 판매 주기의 단축 및 갱신율 향상이 보고되고 있습니다. 이러한 정책 전환은 진단 정확도를 높이는 알고리즘에 특히 큰 도움이 되고 있으며, 예를 들어 뇌졸중 분류 도구의 경우 병변 감지율이 21% 향상된 것으로 확인되었습니다.
다중오믹스 통합이 정밀 의학의 융합을 촉진합니다.
MRI 라디오믹스와 유전체·단백체학 데이터를 융합한 AI 플랫폼은 조현병 분류에서 86.05%의 정확도를 달성했으며, 치료 반응 예측에서도 영상 데이터만을 활용한 모델보다 뛰어난 성능을 보여주고 있습니다. 종양 센터에서는 이러한 솔루션을 도입해 치료법을 개인화함으로써, 시행착오를 통해 처방 건수를 줄이는 데 주력하고 있습니다. 다양한 모달리티에 걸친 입력을 관리하기 위해서는 데이터 거버넌스 프레임워크와 표준화된 용어 체계가 필수적이며, 이에 따라 AI 미들웨어에 대한 수요가 증가하고 있습니다. 미국, 일본, 독일의 연구 컨소시엄은 익명화된 멀티오믹스 데이터 세트를 통합하여 예측 모델의 정확도 향상에 힘쓰고 있습니다. 프로토콜이 성숙해짐에 따라, 멀티오믹스 AI는 주요 병원을 시작으로 지역 영상진단 네트워크로 점차 확산될 것으로 예측됩니다.
이미지 데이터 소유권의 분산이 알고리즘의 일반화 능력을 저해합니다.
의료 영상은 여전히 개별 의료 시스템의 사일로에 갇혀 있어, 견고한 AI 훈련에 필요한 다양한 데이터 세트에 대한 접근이 제한되고 있습니다. 증례 수가 적기 때문에 희귀질환 모델이 가장 큰 영향을 받고 있습니다. 최근 병원 합병으로 인해 데이터 공유가 개선되지 않은 채, 사일로 현상이 더욱 확대되고 있습니다. 연방 학습(분산 학습)은 데이터를 이동시키지 않고도 여러 거점에서 훈련을 수행할 수 있지만, 높은 컴퓨팅 리소스 요구 사항과 네트워크 지연으로 인해 도입이 지연되고 있습니다. 업계 단체들은 상호운용성 헌장을 마련 중이지만, 2차 이용과 관련된 법적 장벽은 여전히 남아 있습니다.
부문별 분석
종양학 분야의 연평균 성장률(CAGR)은 21.05%이며, 라디오유전체학 모델이 치료의 계층화 정확도를 높여감에 따라 그 격차가 좁혀질 전망입니다. 신경학 분야는 뇌졸중, 다발성 경화증의 병변 부하, 신경퇴행성 질환의 경과 추적에 관한 알고리즘이 성숙해짐에 따라, 2025년 MRI 분야 AI 시장의 28.04%를 차지했습니다. 순환기 분야용 기기는 ±3%의 오차 범위 내에서 박출률을 자동으로 측정합니다. 근골격계 영상 진단에서는 AI를 활용해 연골 변성의 등급을 평가하고 있으며, 전립선 알고리즘은 임상적으로 유의미한 암에 대해 97.9%의 민감도를 달성하고 있습니다. 종양학 분야의 MRI 부문 AI 시장 규모는 부문 기준으로 2031년까지 13억 2,000만 달러에 달할 것으로 예측되어, 그 성장 잠재력이 부각되고 있습니다.
신경학 분야의 업체들은 급성 뇌졸중의 분류 및 뇌 위축의 시간 경과에 따른 정량화에 주력하고 있으며, 이 두 가지 모두 NTAP에 따라 보험 적용을 받고 있습니다. 종양학 분야의 연구자들은 면역요법 선택을 돕기 위해 MRI와 차세대 염기서열 분석을 통합하고 있습니다. 심근 관류 프로토콜이 보험 적용 범위에 포함됨에 따라, 심혈관 AI의 활용 범위가 확대되고 있습니다. 근골격계 모델은 부상 현장에서 신속한 판단이 필요한 스포츠 의학 클리닉들로부터 수요가 높아지고 있습니다. 전립선 영상 진단은 비침습적 모니터링을 권장하는 적극적인 경과 관찰 프로그램의 혜택을 받고 있습니다. 태아 및 신생아를 대상으로 한 응용 분야는 여전히 초기 단계이지만, 영아의 발병률 감소를 목적으로 하는 보조금 지원 대상에 포함되어 있습니다.
2025년에는 소프트웨어가 MRI 분야 AI 시장 점유율의 64.12%를 차지해, 이는 PACS 플러그인 및 씬 클라이언트 뷰어를 통한 간편한 도입이 반영된 결과입니다. MRI 분야의 AI 시장 규모는 가장 빠르게 확대되고 있으며, 도입 컨설팅 및 알고리즘 재조정과 관련된 연평균 성장률(CAGR) 20.31%에 힘입고 있습니다. 하드웨어의 수익 기여도는 크지 않지만, 엣지 추론에는 필수적입니다. 초고해상도 재구성은 스캐너에 내장된 GPU에서 실행되어 1초 미만의 지연 시간을 실현하고 있습니다.
병원에서는 알고리즘 업데이트, 가동 시간 보장, 당직 임상 과학자 지원을 한 패키지로 묶은 다년 계약 형태의 관리형 서비스 계약을 체결하는 사례가 증가하고 있습니다. 서비스 제공업체는 모델의 드리프트를 모니터링하며, 로컬 데이터를 활용하여 분기마다 재학습을 수행하고 있습니다. 하드웨어 제조업체는 혼합 정밀도 연산에 최적화된 가속기 카드를 출시하여 전력 소비를 35% 줄였습니다. 소프트웨어, 하드웨어, 서비스 간의 상호작용을 통해 공급업체의 현금 흐름을 안정화시키는 지속적인 수익원이 창출되고 있습니다.
2025년 MRI 분야의 AI 시장 규모 중 딥러닝이 32.35%를 차지했습니다. 이는 조직의 세분화 및 병변의 정량화를 수행하는 컨볼루션 네트워크나 트랜스포머 기반 네트워크에 의한 것입니다. NLP(자연어 처리)는 방사선과에서 보고서 작성을 자동화하고, 후속 조치 준수 여부를 확인하기 위해 비정형 텍스트를 분석함에 따라 연평균 성장률(CAGR) 20.86%로 성장을 지속하고, 있습니다. 기존의 머신러닝은 소규모 데이터셋 환경에서도 여전히 그 가치를 유지하고 있는 반면, 컴퓨터 비전 파이프라인은 이미지의 정규화와 아티팩트 억제를 실현하고 있습니다.
NLP와 통합된 음성 인식 기술을 통해, 오류를 지적해 주는 실시간 받아쓰기 피드백이 가능해집니다. 연방 학습(Federated Learning)은 데이터를 복사하지 않고 안전한 집계 방식을 통해 공동 모델을 학습시키기 때문에 다기관 공동 연구에서 주목을 받고 있습니다. 각 벤더사는 이러한 기술을 융합하고, NLP의 출력을 이미지 기반 네트워크에 통합함으로써 종합적인 환자 프로파일을 작성하고 있습니다.
지역별 분석
2025년, 북미는 MRI 분야의 AI 시장에서 45.28%의 점유율을 차지하며 시장을 주도했습니다. 이는 1,000건 이상의 FDA 승인 이미지 처리 알고리즘과 NTAP의 유리한 보험 급여 제도에 힘입은 결과입니다. 2023년부터 2025년까지 MRI에 특화된 AI 스타트업에 대한 벤처 캐피털의 자금 조달 규모는 12억 달러를 넘어섰으며, 이를 통해 신속한 임상 시범 시험이 가능해졌습니다. Sutter Health와 같은 대규모 네트워크에서는 27개 병원에 클라우드 AI를 도입하여 뇌 MRI 판독 시간을 22% 단축했습니다. 캐나다의 학술 협력에서는 페더레이티드 러닝을 위해 국가 컴퓨팅 그리드를 활용하여, 주를 넘나드는 뇌졸중 모델 개발을 추진하고 있습니다.
아시아태평양은 공공 부문의 투자와 대규모 환자 데이터 세트의 견인 덕분에 21.43%라는 가장 높은 연평균 성장률(CAGR)을 기록하고 있습니다. 중국 규제 당국은 2024년 중반까지 클래스 III 승인 절차를 통해 59건의 AI 의료기기를 승인하며, 국내 AI 업체에 대한 높은 신뢰를 보여주었습니다. 일본은 노동력 고령화에 따른 방사선과 전문의 부족을 해소하기 위해 AI에 자금을 지원하고 있습니다. 한국의 5G 백본은 ‘클라우드 퍼스트’ 도입을 뒷받침하며, 원시 데이터인 k-공간 데이터를 스트리밍하여 원격지에서 재구성이 가능하도록 하고 있습니다. 호주에서는 외딴 지역의 원주민 커뮤니티에서 휴대용 AI-MRI 장비를 시범 운영하고 있습니다.
유럽에서는 의료기기용 AI를 고위험으로 분류하고 품질 관리 시스템 도입을 의무화하는 ‘EU AI법’의 뒷받침을 받아 꾸준한 성장을 이어가고 있습니다. 독일 전국 방사선 의학회는 알고리즘의 투명성을 높이기 위해 AI 스코어카드를 공개하고 있으며, 이를 통해 임상의들의 신뢰를 높이고 있습니다. 영국의 NHS AI 연구소는 MRI AI의 출력 결과를 치료 경로 대시보드에 직접 통합하는 시험을 후원하고 있습니다. 중동의 보건부는 해외 의료 관광을 줄이기 위해 인공지능(AI)에 투자하고 있는 반면, 칠레와 브라질은 민관 협력을 통해 영상 진단 장비의 교체를 추진하고 있습니다.
기타 혜택:
- 엑셀 형식 시장 예측(ME) 시트
- 3개월간의 애널리스트 지원
자주 묻는 질문
목차
제1장 서론
제2장 조사 방법
제3장 주요 요약
제4장 시장 구도
제5장 시장 규모와 성장 예측
제6장 경쟁 구도
제7장 시장 기회와 향후 전망
JHS 26.06.29According to Mordor Intelligence, the artificial intelligence (AI) in MRI Market size is expected to grow from USD 1.65 billion in 2025 to USD 1.98 billion in 2026 and is forecast to reach USD 4.94 billion by 2031 at 20.04% CAGR over 2026-2031.

This report Segments the Industry Into by Clinical Applications (Musculoskeletal, Oncology, Liver, Cardiovascular, and More), by Solution (Software, Services), by Technology (Deep Learning, Machine Learning, Computer Vision, and More), by Deployment Type (On-Premise, Cloud-Based), by End Users (Hospitals, Clinics, and More), and Geography (North America, Europe, Asia-Pacific, and More).
Global Artificial Intelligence (AI) In MRI Market Trends and Insights
Reimbursement Shift to New-Technology Add-On Payments
Medicare's expansion of new-technology add-on payments (NTAP) to cover FDA-cleared AI MRI tools turns AI from a discretionary spend into a reimbursable service . Systems now recoup algorithm costs per scan, creating predictable revenue that accelerates enterprise rollouts. Private insurers typically mirror Medicare within 12-18 months, widening the payment pool. Vendors meeting NTAP criteria report faster sales cycles and higher renewal rates. The policy shift especially benefits algorithms that boost diagnostic accuracy, such as stroke triage tools now documenting 21% higher lesion-detection rates.
Multi-Omics Integration Drives Precision Medicine Convergence
AI platforms that fuse MRI radiomics with genomic and proteomic data reach 86.05% accuracy in schizophrenia classification and outperform imaging-only models in therapy response prediction . Oncology centers deploy such solutions to personalize regimens, reducing trial-and-error prescribing. Data governance frameworks and standardized vocabularies are essential to manage cross-modal inputs, enlarging demand for AI middleware. Research consortia in the United States, Japan, and Germany are pooling de-identified multi-omics datasets to refine predictive models. As protocols mature, multi-omics AI is expected to migrate from flagship hospitals to community imaging networks.
Fragmented Image-Data Ownership Impedes Algorithm Generalizability
Medical images remain locked in individual health-system silos, limiting access to diverse datasets needed for robust AI training . Rare-disease models suffer most due to low case volumes. Recent hospital mergers exacerbate silo size without improving sharing. Federated learning can train across sites without moving data, but high compute demands and network latency slow adoption. Industry associations are drafting interoperability charters, yet legal hurdles around secondary data use persist.
Other drivers and restraints analyzed in the detailed report include:
- Advances in Low-Field Portable MRI Expand Access
- Vendor-Neutral Marketplaces Accelerate Algorithm Adoption
- Enterprise-Wide Cloud PACS Migration
- National Screening Programs Standardize AI
- Shortage of Annotated 7-Tesla Datasets
- Cyber-Security and PHI-Compliance Costs
- Opaque Model Explainability Risks Clinical Liability
For complete list of drivers and restraints, kindly check the Table Of Contents.
Segment Analysis
Neurology held 28.04% of the AI in MRI market in 2025 due to mature algorithms for stroke, multiple-sclerosis lesion load, and neurodegenerative disease tracking. Oncology's 21.05% CAGR is poised to narrow the gap as radiogenomic models boost therapy stratification accuracy. Cardiovascular tools automate ejection-fraction measurement with +-3% variance. Musculoskeletal imaging uses AI to grade cartilage degeneration, while prostate algorithms achieve 97.9% sensitivity for clinically significant cancer. The AI in MRI market size for oncology is projected to climb to USD 1.32 billion by 2031 at the segment level, underscoring growth potential.
Neurology vendors focus on acute-stroke triage and longitudinal brain-atrophy quantification, both reimbursed under NTAP. Oncology developers integrate MRI with next-generation sequencing to guide immunotherapy choices. Cardiovascular AI sees broader use as myocardial-perfusion protocols gain insurer coverage. Musculoskeletal models find buyers among sports-medicine clinics seeking point-of-injury decisions. Prostate imaging benefits from active-surveillance programs that favor non-invasive monitoring. Fetal and neonatal applications remain nascent but attract grants targeted at reducing infant morbidity.
Software captured 64.12% AI in MRI market share in 2025, reflecting straightforward deployment via PACS plugins and thin-client viewers. AI in MRI market size for services is growing fastest, supported by 20.31% CAGR tied to implementation consulting and algorithm recalibration. Hardware contributes smaller revenue but is critical to edge inference. Super-resolution reconstructions run on GPUs embedded in scanners, aiding sub-second latency.
Hospitals increasingly sign multi-year managed-service contracts that bundle algorithm updates, uptime guarantees, and on-call clinical scientists. Service providers monitor model drift and retrain quarterly using local data. Hardware makers roll out accelerator cards optimized for mixed-precision compute to cut power consumption by 35%. The interplay of software, hardware, and services creates recurring revenue streams that stabilize vendor cash flows.
Deep learning accounted for 32.35% of the AI in MRI market size in 2025 through convolutional and transformer-based networks that segment tissue and quantify lesions. NLP posts 20.86% CAGR as radiology departments automate report generation and mine unstructured text for follow-up compliance. Classical machine-learning retains value in small-dataset settings, while computer vision pipelines provide image normalization and artifact suppression.
Speech recognition integrated with NLP allows real-time dictation feedback that flags inconsistencies. Federated learning gains traction in multi-site research, using secure aggregation to train joint models without copying data. Vendors blend techniques, embedding NLP outputs into image-based networks to create holistic patient profiles.
Geography Analysis
North America led the AI in MRI market with 45.28% share in 2025, supported by more than 1,000 FDA-cleared imaging algorithms and favorable NTAP reimbursement. Venture capital funding surpassed USD 1.2 billion for MRI-focused AI start-ups between 2023 and 2025, enabling rapid clinical pilots. Large networks such as Sutter Health deployed cloud AI across 27 hospitals, cutting brain MRI read times by 22%. Academic alliances in Canada leverage national compute grids for federated learning, advancing cross-province stroke models.
Asia-Pacific registers the fastest 21.43% CAGR, driven by public-sector investment and large patient datasets. China's regulator approved 59 AI devices through Class III pathways by mid-2024, demonstrating high trust in local AI vendors. Japan funds AI to offset radiologist shortages tied to an aging workforce. South Korea's 5G backbone underpins cloud-first deployments that stream raw k-space data for off-site reconstruction. Australia pilots portable AI-MRI units in remote Indigenous communities.
Europe maintains steady growth aided by the EU AI Act, which classifies medical-device AI as high-risk and mandates quality management systems. Germany's national radiology society publishes AI scorecards for algorithm transparency, boosting clinician confidence. The United Kingdom's NHS AI Lab sponsors trials that integrate MRI AI outputs directly into care-pathway dashboards. Middle East health ministries invest in AI to reduce outbound medical tourism, while Chile and Brazil use public-private partnerships to upgrade imaging fleets.
- IBM
- Siemens Healthineers
- Koninklijke Philips
- GE HealthCare Technologies Inc.
- Samsung Group
- NVIDIA
- Microsoft Corp. (Nuance Communications Inc.)
- Arterys Inc.
- Nanox (Zebra Medical Vision Inc.)
- Median Technologies
- Perspectum Diagnostics Ltd
- Aidoc Medical Ltd
- Viz.ai Inc.
- RapidAI
- Hyperfine
- Canon
- Enlitic Inc.
- Lunit
- Gleamer SAS
- Oxipit UAB
- Paige AI Inc.
- Exo Imaging Inc.
- Blackford Analysis Ltd
- Perimeter Medical Imaging AI
- Resonance Health Ltd
Additional Benefits:
- The market estimate (ME) sheet in Excel format
- 3 months of analyst support
TABLE OF CONTENTS
1 Introduction
- 1.1 Study Assumptions & Market Definition
- 1.2 Scope of the Study
2 Research Methodology
3 Executive Summary
4 Market Landscape
- 4.1 Market Overview
- 4.2 Market Drivers
- 4.2.1 Reimbursement shift to 'new-technology add-on payments' for FDA-cleared AI MRI tools
- 4.2.2 Surging multi-omics datasets requiring imaging-genomics integration
- 4.2.3 Advances in low-field portable MRI expanding point-of-care AI use-cases
- 4.2.4 Vendor-neutral AI marketplaces easing deployment barriers
- 4.2.5 Enterprise-wide cloud PACS migration accelerating AI adoption
- 4.2.6 National cancer-screening programs incorporating AI-assisted MRI
- 4.3 Market Restraints
- 4.3.1 Fragmented image-data ownership impeding algorithm generalizability
- 4.3.2 Shortage of annotated 7-Tesla datasets for ultra-high-field models
- 4.3.3 Cyber-security & PHI-compliance costs for cloud-deployed AI pipelines
- 4.3.4 Opaque model-explainability risking clinical liability
- 4.4 Value / Supply-Chain Analysis
- 4.5 Regulatory Landscape
- 4.6 Technological Outlook
- 4.7 Porter's Five Forces Analysis
- 4.7.1 Threat of New Entrants
- 4.7.2 Bargaining Power of Buyers/Consumers
- 4.7.3 Bargaining Power of Suppliers
- 4.7.4 Threat of Substitute Products
- 4.7.5 Intensity of Competitive Rivalry
5 Market Size & Growth Forecasts
- 5.1 By Clinical Application (Value, USD)
- 5.1.1 Musculoskeletal
- 5.1.2 Oncology
- 5.1.3 Liver
- 5.1.4 Cardiovascular
- 5.1.5 Neurology
- 5.1.6 Prostate
- 5.1.7 Fetal & Neonatal
- 5.1.8 Other Applications
- 5.2 By Solution
- 5.2.1 Software
- 5.2.2 Services
- 5.2.3 Hardware (Edge GPUs & Accelerators)
- 5.3 By Technology
- 5.3.1 Deep Learning
- 5.3.2 Machine Learning (non-deep)
- 5.3.3 Computer Vision
- 5.3.4 Natural Language Processing
- 5.3.5 Speech Recognition
- 5.3.6 Federated Learning
- 5.3.7 Other Emerging AI Technologies
- 5.4 By Deployment Type
- 5.4.1 On-premise
- 5.4.2 Cloud-based
- 5.4.3 Hybrid
- 5.5 By End User
- 5.5.1 Hospitals
- 5.5.2 Diagnostic Imaging Centers
- 5.5.3 Specialty Clinics
- 5.5.4 Ambulatory Surgical Centers
- 5.5.5 Research & Academic Institutes
- 5.6 By MRI Field Strength
- 5.6.1 Low-field (<1.5 T)
- 5.6.2 Mid-field (1.5 T)
- 5.6.3 High-field (3 T)
- 5.6.4 Ultra-High-field (7 T +)
- 5.7 By MRI System Architecture
- 5.7.1 Closed Bore
- 5.7.2 Open MRI
- 5.7.3 Portable / Point-of-Care MRI
- 5.8 By Business Model
- 5.8.1 License / Perpetual
- 5.8.2 Subscription (SaaS)
- 5.8.3 Pay-per-scan
- 5.8.4 AI-as-a-Service
- 5.9 By Geography
- 5.9.1 North America
- 5.9.1.1 United States
- 5.9.1.2 Canada
- 5.9.1.3 Mexico
- 5.9.2 Europe
- 5.9.2.1 Germany
- 5.9.2.2 United Kingdom
- 5.9.2.3 France
- 5.9.2.4 Italy
- 5.9.2.5 Spain
- 5.9.2.6 Rest of Europe
- 5.9.3 Asia-Pacific
- 5.9.3.1 China
- 5.9.3.2 Japan
- 5.9.3.3 India
- 5.9.3.4 South Korea
- 5.9.3.5 Australia
- 5.9.3.6 Rest of Asia-Pacific
- 5.9.4 Middle East
- 5.9.4.1 GCC
- 5.9.4.2 South Africa
- 5.9.4.3 Rest of Middle East
- 5.9.5 South America
- 5.9.5.1 Brazil
- 5.9.5.2 Argentina
- 5.9.5.3 Rest of South America
- 5.9.1 North America
6 Competitive Landscape
- 6.1 Market Concentration
- 6.2 Market Share Analysis
- 6.3 Company Profiles (includes Global level Overview, Market level overview, Core Segments, Financials as available, Strategic Information, Market Rank/Share for key companies, Products & Services, and Recent Developments)
- 6.3.1 IBM Corporation
- 6.3.2 Siemens Healthineers AG
- 6.3.3 Koninklijke Philips NV
- 6.3.4 GE HealthCare Technologies Inc.
- 6.3.5 Samsung Electronics Co. Ltd (Samsung Medison)
- 6.3.6 NVIDIA Corporation
- 6.3.7 Microsoft Corp. (Nuance Communications Inc.)
- 6.3.8 Arterys Inc.
- 6.3.9 Nanox (Zebra Medical Vision Inc.)
- 6.3.10 Median Technologies
- 6.3.11 Perspectum Diagnostics Ltd
- 6.3.12 Aidoc Medical Ltd
- 6.3.13 Viz.ai Inc.
- 6.3.14 RapidAI
- 6.3.15 Hyperfine Inc.
- 6.3.16 Canon Medical Systems Corporation
- 6.3.17 Enlitic Inc.
- 6.3.18 Lunit Inc.
- 6.3.19 Gleamer SAS
- 6.3.20 Oxipit UAB
- 6.3.21 Paige AI Inc.
- 6.3.22 Exo Imaging Inc.
- 6.3.23 Blackford Analysis Ltd
- 6.3.24 Perimeter Medical Imaging AI
- 6.3.25 Resonance Health Ltd
7 Market Opportunities & Future Outlook
- 7.1 White-Space & Unmet-Need Assessment
