
|
시장보고서
상품코드
2065772
에지 데이터센터 시장 : 점유율 분석, 업계 동향과 통계, 성장 예측(2026-2031년)Edge Data Center - Market Share Analysis, Industry Trends & Statistics, Growth Forecasts (2026 - 2031) |
||||||
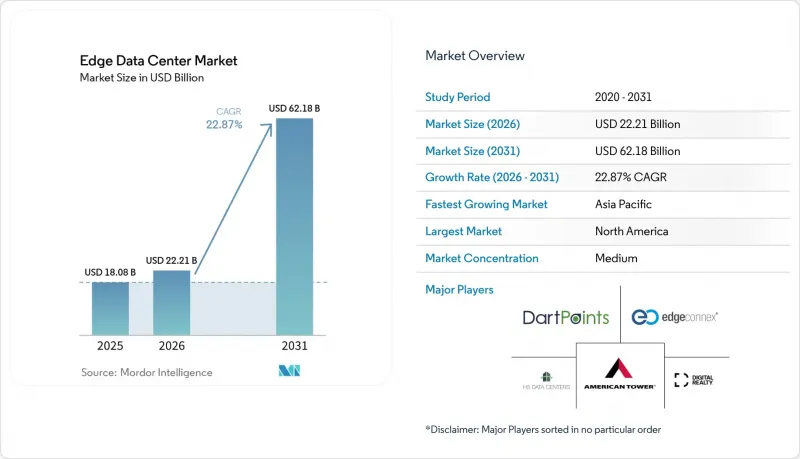
Mordor Intelligence에 의하면, 에지 데이터센터 시장 규모는 2025년에 180억 8,000만 달러로 평가되었고 2026년 222억 1,000만 달러에서 2031년까지 621억 8,000만 달러에 이를 것으로 예측되며, 예측 기간(2026-2031년) CAGR은 22.87%를 나타낼 전망입니다.

본 보고서는 구성 요소(솔루션, 서비스), 데이터센터 규모(소규모, 중규모, 기타), 티어 유형(Tier 1 및 2, Tier 3, 티어 4), 최종 사용자(IT 및 통신, 은행, 금융서비스 및 보험(BFSI), 기타) 및 지역별로 분류되어 있습니다. 시장 전망치는 금액(달러)으로 표시되어 있습니다.
세계 에지 데이터센터 시장 동향과 인사이트
IoT 및 연결 기기의 급증
2025년에는 215억 대 이상의 에지 연결 엔드포인트가 가동될 것으로 예상되며, 이는 중앙 집중형 클라우드의 처리 능력을 압도하고 로컬 컴퓨팅 노드의 도입을 촉진할 것입니다. 에미레이트 NBD는 분석 처리를 지역 노드로 이전한 결과, 트랜잭션 처리 능력을 42% 향상시켰습니다. 3M은 공장 현장에서 Azure SQL Edge를 활용함으로써 기계 가동 중단 시간을 35% 줄였으며, 각 사업장에서월10TB 이상의 데이터가 생성될 경우 비용 측면에서 뚜렷한 이점이 나타난다는 점을 보여주었습니다. 라스베이거스시가 Vapor IO 및 NVIDIA와 협력하여 진행한 스마트 시티 프로젝트를 통해, 교통 신호 지연 시간을 200밀리초에서 20밀리초로 단축했습니다.
동영상·5G로 인한 데이터 트래픽의 급증
동영상은 이미 인터넷 트래픽의 82%를 차지하고 있으며, 5G 기기의 보급으로 인해 10밀리초 미만의 전송 속도에 대한 압박이 더욱 커지고 있습니다. Verizon과 NVIDIA는 에지 랙을 AI-as-a-Service의 허브로 전환하여 주파수 대역에 대한 투자를 수익화하고 있습니다. BMW 공장에서는 200대 이상의 카메라에서 촬영한 4K 영상을 인근 노드로 스트리밍하여, 50밀리초 만에 결함 검출을 수행하고 있습니다. 이는 클라우드를 통한 2-3초와 비교했을 때, 전송 비용을 15-20배 절감하고 있습니다. 전 세계의 통신 사업자들은 이러한 도입에 500억 달러를 투자하고 있습니다.
에지 시설 구축에 따른 고액의 설비 투자
2024년 이후, 건설 비용은 25-30% 급등했습니다. 그 이유는 기존의 데이터센터 홀에서는 1kW당 4,000-6,000달러였던 반면, 고전력 밀도 설계에서는 8,000-1만 2,000달러가 소요되기 때문입니다. Vantage사의 130억 달러 규모 계획에 따르면, 단일 사이트의 가격은 현재 5,000만-8,000만 달러 수준입니다. 개폐 장치의 리드타임이 2년에 달하고, 재고 비용과 품질 리스크가 증가하고 있습니다.
부문별 분석
2025년, 기업들이 물리적 랙과 오케스트레이션 소프트웨어 도입을 서두른 결과, 솔루션 부문은 에지 데이터센터 시장 점유율 62.80%를 유지했습니다. 그럼에도 불구하고, 인력 부족을 보완하기 위한 관리형 운영에 대한 수요에 힘입어 에지 데이터센터 시장의 서비스 부문은 연평균 성장률(CAGR) 23.96%로 성장할 전망입니다. 모니터링 업무를 외부에 위탁하면 사내에서 직접 감시하는 것에 비해 운영 비용을 30-40% 절감할 수 있는 가능성이 있으며, 이는 40-50%의 이익률을 창출하는 Lumen사의 AI 기반 포트폴리오를 통해 입증되었습니다.
이러한 추세는 설비 투자에서 성과 기반 모델로의 전환을 시사하고 있습니다. 수백 곳의 옥상 및 소매점의 창고로 서비스가 확대됨에 따라, 고객들은 자산의 소유권보다 보장된 SLA를 더 중요하게 여기게 되었습니다. EdgeConneX의 일본 내 사업 전개는 단순한 코로케이션이 아니라, 서비스 제공을 위해 설계된 플랫폼의 좋은 사례입니다.
대규모 캠퍼스는 용량과 입지 조건의 균형을 조정함으로써 2025년 에지 데이터센터 시장의 54.10%를 차지했습니다. 그러나 하이퍼스케일러 각사가 설계 노하우를 도시 근교의 부지에 적용함에 따라, 메가 시설은 2031년까지 연평균 성장률(CAGR) 25.8%를 기록할 전망입니다. 100MW 규모의 단일 노드를 구축하면, 소규모 룸을 분산 배치하는 경우와 비교하여 냉각 비용과 전력 비용을 20-25% 절감할 수 있는 경우가 많습니다.
통신 사업자들은 여전히 5G 에지 네트워크에 중형 규모의 인클로저를 선호하는 반면, 대형 클라우드 기업들은 지역 서비스 플레인을 위해 메가셀을 선호하고 있습니다. 브라질에 위치한 Scala사의 5억 달러 규모의 ‘AI 시티’는 이 모델의 대표적인 사례로, 단일 지역이 아닌 광역권 전체에 서비스를 제공합니다.
지역별 분석
북미는 5G의 조기 도입과 성숙한 광섬유 백본을 바탕으로, 2025년에는 에지 데이터센터 시장 점유율의 27.05%를 차지했습니다. 현재, 성장은 토지 가격이 저렴하고 전력망의 여유 용량도 충분한 2차 도시권으로 이동하고 있습니다. 코어 사이언티픽(Core Scientific)이 텍사스주의 비트코인 채굴 시설을 용도 변경하는 40억 달러 규모의 계획은 기존 자산이 AI 추론 용도로 어떻게 재활용될 수 있는지를 보여주고 있습니다. 개발업자들은 세계 수준에 비해 25-35% 높은 건설 비용과, 해안가의 주요 도시를 제외한 지역에서의 심각한 기술자 부족 문제로 여전히 고심하고 있습니다.
아시아태평양은 연평균 성장률(CAGR) 24.2%를 나타낼 것으로 예측되며, 에지 데이터센터 시장 확대의 주요 원동력이 될 전망입니다. 중국의 ‘신 인프라’와 인도의 ‘디지털 인디아’ 이니셔티브는 국가 전략에 현지 처리 의무를 포함하고 있습니다. Digital Edge는 도쿄와 자카르타가 허브 지위를 놓고 경쟁하는 가운데, 지역 내 사업 확장을 위해 16억 달러를 조달했습니다. 건설 예산은 북미의 동급 수준보다 40-50% 낮게 책정되어 있는 반면, 직업 훈련 프로그램을 통해 공인 엔지니어의 인력이 꾸준히 늘어나고 있습니다.
기타 혜택:
- 엑셀 형식 시장 예측(ME) 시트
- 3개월간의 애널리스트 지원
자주 묻는 질문
목차
제1장 서론
제2장 조사 방법
제3장 주요 요약
제4장 시장 구도
제5장 시장 규모와 성장 예측
제6장 경쟁 구도
제7장 시장 기회와 향후 전망
JHS 26.06.29According to Mordor Intelligence, the edge data center market size was valued at USD 18.08 billion in 2025 and estimated to grow from USD 22.21 billion in 2026 to reach USD 62.18 billion by 2031, at a CAGR of 22.87% during the forecast period (2026-2031).
This report is Segmented by Component (Solution, Services), by Data Center Size (Small, Medium, and More), Tier Type (Tier 1 and 2, Tier 3, Tier 4), End User ( IT & Telecom, BFSI, and More) and Geography. The Market Forecasts are Provided in Terms of Value (USD).
Global Edge Data Center Market Trends and Insights
Proliferation of IoT & connected devices
More than 21.5 billion edge-connected endpoints will be active in 2025, overwhelming centralized clouds and driving procurement of localized compute nodes. Emirates NBD boosted transaction throughput by 42% after relocating analytics to regional nodes. 3M trimmed machine downtime by 35% using Azure SQL Edge on factory floors, highlighting the cost advantage once sites generate over 10 TB of monthly data. Las Vegas' smart-city partnership with Vapor IO and NVIDIA cut traffic-signal latencies from 200 ms to 20 ms.
Surge in video/5G-driven data traffic
Video already represents 82% of internet load, and 5G devices intensify pressure for sub-10 ms delivery. Verizon and NVIDIA are turning edge racks into AI-as-a-service hubs that monetize spectrum investments. BMW's factory streams 4K footage from 200+ cameras to nearby nodes for defect detection in 50 ms versus 2-3 s in cloud paths, saving 15-20X on transmission fees. Global carriers are channeling USD 50 billion into such deployments.
High capex for edge facility build-outs
Construction costs jumped 25-30% since 2024, driven by power-dense designs that run USD 8,000-12,000 per kW versus USD 4,000-6,000 in legacy halls. Vantage's USD 13 billion plan shows single sites now price at USD 50-80 million. Lead times for switch-gear stretch to two years, swelling inventory costs and quality risks.
Other drivers and restraints analyzed in the detailed report include:
- Latency-critical AR/VR & autonomous apps
- AI inferencing workloads moving to edge
- Interoperability & management gaps
For complete list of drivers and restraints, kindly check the Table Of Contents.
Segment Analysis
Solutions retained 62.80% of edge data center market share in 2025 as enterprises raced to install physical racks and orchestration software. The edge data center market will nevertheless see Services expand at a 23.96% CAGR, fueled by demand for managed operations that offset talent gaps. Outsourced monitoring can cut run-rate costs 30-40% versus in-house oversight, a fact underscored by Lumen's AI-driven portfolio that yields 40-50% margins.
The trend signals a pivot from capital expenditure toward outcome-based models. As deployments multiply across hundreds of rooftops and retail closets, clients value guaranteed SLAs more than asset ownership. EdgeConneX's Japan buildout exemplifies platforms engineered for service delivery over plain colocation.
Large campuses captured 54.10% of the edge data center market in 2025 by balancing capacity with proximity. Yet Mega facilities are on track to post a 25.8% CAGR through 2031 as hyperscalers transplant design playbooks to metro-adjacent parcels. Deploying a single 100-MW node often reduces cooling and power costs 20-25% relative to scattering smaller rooms.
Telecom operators still lean on Medium enclosures for 5G edge lattices, but cloud majors favor Mega cells for regional service planes. Scala's USD 500 million "AI City" in Brazil typifies the model, serving an urban region instead of a single district.
Geography Analysis
North America controlled 27.05% of edge data center market share in 2025 on the back of early 5G launches and mature fiber backbones. Growth is now tilting toward secondary metros where land is cheaper and grid headroom ample. Core Scientific's USD 4 billion plan to convert bitcoin farms in Texas shows how legacy assets can be reborn for AI inference. Developers still grapple with 25-35% higher construction costs compared with global norms and with acute technician shortages outside coastal hubs.
Asia-Pacific is forecast to log a 24.2% CAGR, making it the prime driver of edge data center market expansion. China's "New Infrastructure" and India's Digital India initiatives embed local-processing mandates in national strategies. Digital Edge secured USD 1.6 billion to scale regional footprints as Tokyo and Jakarta vie for hub status. Build budgets run 40-50% below North American equivalents, while vocational programs churn a growing cadre of certified engineers.
- American Tower Corporation
- DartPoints
- Digital Realty Trust
- EdgeConneX
- H5 Data Centers
- SBA Communications Corporation
- Iron Mountain Inc.
- Aligned Data Centers
- Microsoft Corporation
- Oracle Corporation
- Equinix
- Vertiv
- Schneider Electric
- Vapor IO
- Cyxtera Technologies
- EdgeMicro
- StackPath
- Compass Datacenters
- Switch Inc.
- Rackspace Technology
- Hewlett Packard Enterprise
- QTS Realty Trust
Additional Benefits:
- The market estimate (ME) sheet in Excel format
- 3 months of analyst support
TABLE OF CONTENTS
1 INTRODUCTION
- 1.1 Study Assumptions and Market Definition
- 1.2 Scope of the Study
2 RESEARCH METHODOLOGY
3 EXECUTIVE SUMMARY
4 MARKET LANDSCAPE
- 4.1 Market Overview
- 4.2 Market Drivers
- 4.2.1 Proliferation of IoT and connected devices
- 4.2.2 Surge in video/5G-driven data traffic
- 4.2.3 Latency-critical AR/VR and autonomous apps
- 4.2.4 Data-sovereignty regulations
- 4.2.5 AI inferencing workloads moving to edge
- 4.2.6 Renewable-energy micro-grids at edge sites
- 4.3 Market Restraints
- 4.3.1 High capex for edge facility build-outs
- 4.3.2 Interoperability and management gaps
- 4.3.3 Cyber and physical security risks
- 4.3.4 Skilled-labor shortage in tier-2/3 cities
- 4.4 Value / Supply-Chain Analysis
- 4.5 Regulatory Landscape
- 4.6 Technological Outlook
- 4.7 Porter's Five Forces
- 4.7.1 Bargaining Power of Suppliers
- 4.7.2 Bargaining Power of Buyers
- 4.7.3 Threat of New Entrants
- 4.7.4 Threat of Substitutes
- 4.7.5 Competitive Rivalry
- 4.8 Assessment of the Macroeconomic Factors on the Market
5 MARKET SIZE AND GROWTH FORECASTS (VALUE)
- 5.1 By Component
- 5.1.1 Solution
- 5.1.2 Services
- 5.2 By Data Center Size
- 5.2.1 Small
- 5.2.2 Medium
- 5.2.3 Large
- 5.2.4 Massive
- 5.2.5 Mega
- 5.3 By Tier Type
- 5.3.1 Tier 1 and 2
- 5.3.2 Tier 3
- 5.3.3 Tier 4
- 5.4 By End-user
- 5.4.1 IT and Telecom
- 5.4.2 BFSI
- 5.4.3 Government
- 5.4.4 Healthcare
- 5.4.5 Manufacturing
- 5.4.6 Others
- 5.5 By Geography
- 5.5.1 North America
- 5.5.1.1 United States
- 5.5.1.2 Canada
- 5.5.1.3 Mexico
- 5.5.2 South America
- 5.5.2.1 Brazil
- 5.5.2.2 Argentina
- 5.5.2.3 Rest of South America
- 5.5.3 Europe
- 5.5.3.1 Germany
- 5.5.3.2 United Kingdom
- 5.5.3.3 France
- 5.5.3.4 Netherlands
- 5.5.3.5 Rest of Europe
- 5.5.4 Asia-Pacific
- 5.5.4.1 China
- 5.5.4.2 Japan
- 5.5.4.3 India
- 5.5.4.4 South Korea
- 5.5.4.5 Australia and New Zealand
- 5.5.4.6 Rest of Asia-Pacific
- 5.5.5 Middle East and Africa
- 5.5.5.1 Middle East
- 5.5.5.1.1 United Arab Emirates
- 5.5.5.1.2 Saudi Arabia
- 5.5.5.1.3 Turkey
- 5.5.5.1.4 Rest of Middle East
- 5.5.5.2 Africa
- 5.5.5.2.1 South Africa
- 5.5.5.2.2 Egypt
- 5.5.5.2.3 Nigeria
- 5.5.5.2.4 Rest of Africa
- 5.5.5.1 Middle East
- 5.5.1 North America
6 COMPETITIVE LANDSCAPE
- 6.1 Market Concentration
- 6.2 Strategic Moves
- 6.3 Market Share Analysis
- 6.4 Company Profiles (includes Global level Overview, Market level overview, Core Segments, Financials as available, Strategic Information, Market Rank/Share for key companies, Products and Services, and Recent Developments)
- 6.4.1 American Tower Corporation
- 6.4.2 DartPoints
- 6.4.3 Digital Realty Trust
- 6.4.4 EdgeConneX
- 6.4.5 H5 Data Centers
- 6.4.6 SBA Communications Corporation
- 6.4.7 Iron Mountain Inc.
- 6.4.8 Aligned Data Centers
- 6.4.9 Microsoft Corporation
- 6.4.10 Oracle Corporation
- 6.4.11 Equinix
- 6.4.12 Vertiv
- 6.4.13 Schneider Electric
- 6.4.14 Vapor IO
- 6.4.15 Cyxtera Technologies
- 6.4.16 EdgeMicro
- 6.4.17 StackPath
- 6.4.18 Compass Datacenters
- 6.4.19 Switch Inc.
- 6.4.20 Rackspace Technology
- 6.4.21 Hewlett Packard Enterprise
- 6.4.22 QTS Realty Trust
7 MARKET OPPORTUNITIES AND FUTURE OUTLOOK
- 7.1 White-space and Unmet-Need Assessment
