
|
시장보고서
상품코드
2066446
VaaS(Video As A Service) : 시장 점유율 분석, 업계 동향 및 통계, 성장 예측(2026-2031년)Video As A Service (VaaS) - Market Share Analysis, Industry Trends & Statistics, Growth Forecasts (2026 - 2031) |
||||||
 Mordor Intelligence
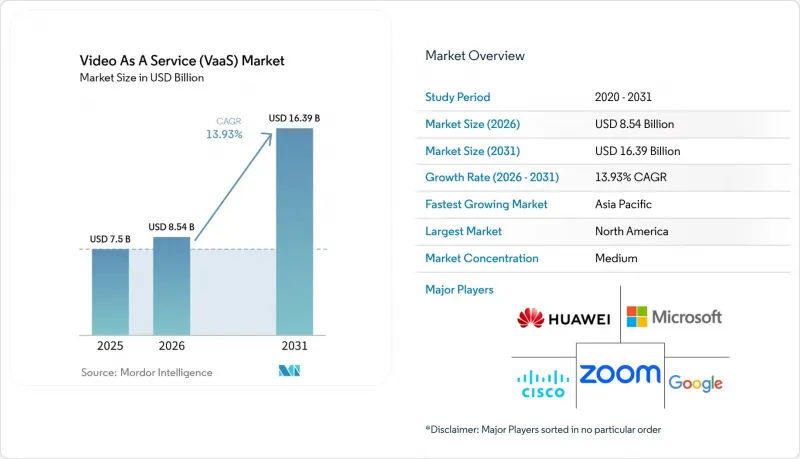
Mordor Intelligence에 의하면, VaaS(Video As A Service) 시장 규모는 2025년에 75억 달러로 평가되었습니다. 2026년에 85억 4,000만 달러에 달하고, 2031년까지 163억 9,000만 달러에 이를 것으로 예측되며, 2026년부터 2031년에 걸쳐 CAGR 13.93%로 성장할 전망입니다.
본 보고서는 플랫폼(용도 관리, 디바이스 관리 등), 디바이스(모바일 디바이스, 엔터프라이즈 컴퓨팅, 회의실용 엔드포인트), 서비스(매니지드, 프로페셔널), 배포 모델(퍼블릭 클라우드, 프라이빗 클라우드, 하이브리드 클라우드), 최종 사용자 산업(정부·국방, BFSI 등), 지역별로 분류되어 있습니다. 시장 전망은 금액(달러) 기준으로 제시되어 있습니다.
세계의 VaaS(Video As A Service) 시장 동향 및 인사이트
설비 투자(CAPEX)에서 운영비(OPEX)로의 전환
2024년 한 해 동안 기업들은 자체 브리지에서 종량제 클라우드 비디오로 예산을 전환했습니다. 미국의 한 대형 통신사는 비디오 포트폴리오의 4분의 1을 서비스 모델로 전환함으로써 연간 감가상각비를 두 자릿수 비율로 절감하고, 영업 자유 현금흐름을 끌어올렸다고 보고했습니다. 감가상각비 절감을 통해 대역폭 업그레이드 자금을 확보하는 경우가 많으며, 이는 이용량을 두 배로 늘리는 선순환을 만들어내고 있습니다. 재무 부서는 월별 요금의 투명성을 높이 평가하고 있으며, 이는 거시경제의 역풍 속에서도 VaaS에 대한 지출을 완화하는 요인이 되고 있습니다. 이에 대응하여 각 벤더사는 사용자 단위의 라이선스 계층을 간소화하여 조달 프로세스의 복잡성을 줄이고 있습니다. 조기 도입 기업들의 사례에 따르면, 클라우드 플랫폼이 버전 관리를 담당함으로써 이번 전환을 통해 라이프사이클 지원에 드는 오버헤드가 감소하는 것으로 확인되었습니다.
고객 용도에 동영상 API 통합
어느 유럽 보험사는 2025년, 실시간 보험 계약 데이터를 템플릿화된 시나리오에 반영하는 API 게이트웨이를 활용하여 4만 편의 맞춤형 갱신 안내 동영상을 배포했습니다. 현재는 직접적인 이해관계자가 된 마케팅 부서가, 과거에는 IT 부서가 주도하던 구매 주기를 가속화하고 있습니다. 동영상에 고객 관계 관리(CRM) 데이터를 통합함으로써 고객 유지 캠페인이 가속화되고, 동적인 업셀링 제안이 가능해집니다. API의 성숙도가 높아짐에 따라, 보험사들은 재생 화면 옆에 동의 획득 및 클릭스루 기능을 통합하여 규정 준수 절차를 강화하고 있습니다. 이러한 접근 방식을 통해 컨텐츠의 길이를 보험 계약의 복잡성에 맞추어 조정할 수 있으므로, 고객 1인당 저장 시간이 단축되고 참여도가 향상되는 동시에 호스팅 비용도 절감됩니다.
데이터 소재지에 관한 규제 요건
호주의 한 은행 그룹은 개정된 건전성 기준을 준수하기 위해 2025년에 모든 회의 녹화본을 로컬에서 호스팅되는 인스턴스로 이전했습니다. 지오펜스를 통한 트래픽 라우팅의 세분화는 운영을 지원하는 한편, 지역을 아우르는 모니터링을 위한 도구 요구 사항을 높이고 있습니다. 벤더는 여러 관할권에 대응하는 규정 준수 템플릿을 유지해야 하므로, 엔지니어링 업무 부담이 증가하고 있습니다. 데이터 처리 계약 협상은 규제가 엄격한 업계에서 판매 주기를 길어지게 합니다. 일부 구매자들은 On-Premise 관리와 세계 확장성 간의 균형을 맞추기 위해 하이브리드 클라우드 모델을 채택하고 있으며, 이로 인해 도입 아키텍처가 복잡해지고 있습니다.
부문별 분석
2025년, 용도 관리 제품군은 ‘VaaS(Video As A Service)’ 시장에서 가장 큰 점유율을 차지하며 전 세계 매출의 33.60%를 차지했습니다. 기업들은 회의 조정, 캘린더 연동, 실시간 보안 제어를 기본 요건으로 삼고 있습니다. 로우코드 커넥터를 통해 인사 팀은 IT 티켓을 발행하지 않고도 온보딩 세션을 예약할 수 있게 되었으며, 이에 따라 사용자 기반이 확대되고 테넌트당 이용 시간이 증가하고 있습니다. 각 벤더사는 참가자의 참여도를 반응 이모티콘의 출현 빈도까지 추적할 수 있는 회의 라이프사이클 시각화 기능을 통해 차별화를 꾀하고 있습니다.
한편, 컨텐츠 관리 플랫폼은 2031년까지 연평균 성장률(CAGR) 16.22%를 기록하며 다른 부문을 앞지를 것으로 전망됩니다. 구매자들은 메타데이터, 챕터 구분, 규정 준수 태그 지정을 핵심 기능으로 간주하는 경향이 점점 더 강해지고 있습니다. 프로바이더는 직원 포털에 재생 위젯을 삽입하는 소프트웨어 개발 키트(SDK)를 통해 이러한 기능을 제공합니다. 컨텐츠 중심 모듈 분야의 VaaS(Video As A Service) 시장 규모는 데이터 보존 정책이 ESG 아카이브 요구 사항과 통합됨에 따라 확대될 것으로 예측됩니다. 장치 관리 하위 모듈에서는 현재 에너지 지표가 표시되도록 되어, 지속가능성 팀이 각 엔드포인트별 전력 소비량을 추적할 수 있게 되었습니다. 이는 플랫폼 업데이트에 관한 협의를 기업의 기후 목표와 연계함으로써 창출되는 부가가치입니다.
2025년에도 엔터프라이즈 컴퓨팅의 엔드포인트는 ‘VaaS(Video As A Service)’ 시장의 54.20%를 차지했습니다. 데스크톱 및 노트북 클라이언트는 싱글 사인온(SSO) 및 정책 적용 기능을 통합하여 규제 대상 업계를 지원합니다. 탄탄한 화면 공유 기능과 키보드 접근성 기능을 통해 지식 근로자들의 참여도를 높게 유지하고 있습니다. 각 벤더사는 오픈 오피스에 최적화된 배경 소음 억제 기능을 개선하여, 비트레이트를 높이지 않고도 음성을 선명하게 전달하고 있습니다.
모바일 기기는 2026년부터 2031년에 걸쳐 연평균 성장률(CAGR) 17.6%를 기록하며, 순 신규 사용자 수가 가장 크게 증가할 것으로 전망됩니다. 현재 플래그십 모델은 실시간 깊이 매핑 기능을 갖춘 시네마틱 모드를 지원하여, 마케팅 팀이 사내용 업데이트 정보를 전적으로 모바일 워크플로우를 통해 제작할 수 있도록 돕고 있습니다. 이러한 변화로 인해 동영상 제작 소요 시간이 몇 주에서 몇 시간으로 단축됩니다. 5G 통신 범위가 교외 지역까지 확대되고, 현장 직원들 사이에서 신뢰성에 대한 우려가 해소된다면, 모바일용 VaaS(Video As A Service) 시장 점유율은 더욱 확대될 것으로 예측됩니다. 회의실 규모에 따라 지능형 오디오 구역 설정 기능을 갖춘 천장 설치형 360도 카메라에 대한 수요가 증가하고 있으며, 이를 통해 원격 참가자의 음성 수신이 균일해집니다.
지역별 분석
북미는 클라우드의 높은 성숙도, 지속적 수익형 소프트웨어에 대한 자본 시장의 활발한 수요, 그리고 AI를 활용한 컨텐츠 거버넌스의 조기 도입에 힘입어 2025년에는 전 세계 매출의 37.40%를 차지하며 선도적 위치를 유지했습니다. 미국의 기업들은 음성 분석을 경영진을 위한 브리핑 자료 라이브러리와 통합하고 있는 반면, 캐나다의 이중 언어 규정은 자동 번역 수요를 촉진하고 있습니다. 정부가 자금을 지원하는 광대역 보조금 덕분에 지방의 대역폭이 유지되고 있으며, 소규모 지자체로의 동영상 전송 범위가 확대되고 있습니다. 또한, 해당 지역에서는 엣지 컴퓨팅을 활용한 오프로드 시범 도입도 조기에 진행되고 있어, IoT 영상 분석 시 중앙 클라우드를 경유하는 홉 수를 줄이고 있습니다.
아시아태평양은 2031년까지 연평균 성장률(CAGR) 16.55%를 나타낼 것으로 예측되며, 이는 모든 지역 중 가장 높은 성장률입니다. 싱가포르는 2024년에 150 MW 규모의 새로운 코로케이션 용량을 추가했고, 서울은 5G 독립형(SA) 서비스 커버리지를 2배로 확대함으로써 이 지역 내 SaaS의 확장이 가능해졌습니다. 많은 아세안 기업들이 기존의 PBX 단계를 완전히 건너뛰었기 때문에 첫 번째 화상 회의 시스템 도입은 처음부터 클라우드 기반으로 이루어지고 있습니다. 언어의 다양성은 앱 내 자막의 현지화를 촉진하고 있으며, 폭넓은 언어 팩을 제공하는 업체에게는 경쟁상의 차별화 요소가 되고 있습니다. 인도네시아와 필리핀에 도입된 엣지 노드는 퍼스트 마일의 지터를 줄여, 섬 지역에 거주하는 사용자에게 일관된 경험을 제공합니다.
유럽은 여전히 엄격한 데이터 보호법과 적극적인 탈탄소화 목표를 특징으로 하고 있습니다. 한 독일 자동차 그룹은 2024년에 도시 간 항공편 8,000편을 화상 회의로 대체하여 스코프 3 배출 강도를 4% 감축했습니다. 배출량 감사 기관은 VaaS 대시보드를 이동 회피에 대한 대체 증거로 인정하고, 비디오 예산을 ESG 프레임워크 내에 포함시키고 있습니다. 소버린 클라우드를 선호함에 따라, 벤더에 대한 지원 요청이 여러 하위 지역으로 분산되고 있습니다. EU의 ‘디지털 시장법’은 개방적인 상호운용성을 장려하고 있으며, 서비스 제공업체들에게 표준 기반의 코덱 및 인증 플러그인의 채택을 권장하고 있습니다.
기타 혜택 :
- 엑셀 형식 시장 예측(ME) 시트
- 3개월간의 애널리스트 지원
자주 묻는 질문
목차
제1장 서론
제2장 조사 방법
제3장 주요 요약
제4장 시장 구도
제5장 시장 규모 및 성장 예측
제6장 경쟁 구도
제7장 시장 기회 및 향후 전망
KTH 26.06.29According to Mordor Intelligence, the video as a service market size is projected to be USD 7.5 billion in 2025, USD 8.54 billion in 2026, and reach USD 16.39 billion by 2031, growing at a CAGR of 13.93% from 2026 to 2031.
This report is Segmented by Platform (Application Management, Device Management, and More), Device (Mobility Devices, Enterprise Computing, Room-Based Endpoints), Service (Managed, Professional), Deployment Model (Public Cloud, Private Cloud, Hybrid Cloud), End-User Industry (Government and Defense, BFSI, and More), Geography. The Market Forecasts are Provided in Terms of Value (USD).
Global Video As A Service (VaaS) Market Trends and Insights
Shift from Capital Expenditure to Operating Expenditure
Enterprises redirected budgets from proprietary bridges to pay-per-use cloud video throughout 2024. A tier-one US telco reported that moving one-quarter of its video portfolio to a service model cut annual depreciation by double digits and lifted operating free cash flow. Depreciation relief often funds bandwidth upgrades, forming a self-reinforcing flywheel that multiplies usage. Finance units appreciate monthly fee visibility, which cushions VaaS spending during macro headwinds. Vendors respond by simplifying per-user licensing tiers, reducing procurement complexity. Early adopters confirm that the switch trims lifecycle support overhead because cloud platforms absorb version management.
Embedded Video APIs in Customer Applications
A European insurer distributed 40,000 personalised renewal videos in 2025 using an API gateway that pulls real-time policy data into templated scenes. Marketing departments, now direct stakeholders, accelerate purchase cycles that were previously IT-led. Integration of customer relationship management data inside video accelerates retention campaigns and supports dynamic upsell prompts. As API maturity grows, insurers embed consent capture and click-through next to playback, tightening compliance loops. This approach also shrinks hosting costs because content length can be tailored to policy complexity, reducing storage minutes per customer while boosting engagement.
Sovereign Data-Residency Requirements
An Australian banking group migrated all meeting recordings to a locally hosted instance in 2025 to align with updated prudential standards. Geo-fenced traffic routing fragments support operations and raise tooling needs for cross-region monitoring. Vendors must maintain compliance templates for multiple jurisdictions, increasing engineering overhead. Negotiating data-processing agreements lengthens sales cycles in regulated verticals. Some buyers adopt hybrid-cloud models to balance local control with global elasticity, complicating deployment architectures.
Other drivers and restraints analyzed in the detailed report include:
- Low-Latency 5G and Edge Acceleration
- Hybrid-Work Mandates Driving Room Upgrades
- Bandwidth Constraints in Emerging Economies
For complete list of drivers and restraints, kindly check the Table Of Contents.
Segment Analysis
Application-management suites accounted for the largest video as a service market share in 2025, accounting for 33.60% of global revenue. Enterprises rank meeting orchestration, calendar integration, and real-time security controls as baseline requirements. Low-code connectors allow human resources teams to schedule onboarding sessions without IT tickets, widening user bases and lifting per-tenant minute volumes. Vendors differentiate in meeting-lifecycle visualisations that trace attendee engagement down to reaction-emoji frequency.
Content-management platforms, however, are forecast to outpace other categories with a 16.22% CAGR to 2031. Buyers increasingly view metadata, chaptering, and compliance tagging as core. Providers expose these functions through software development kits that insert playback widgets in employee portals. The video as a service market size for content-centric modules is anticipated to expand as retention policies converge with ESG archiving mandates. Device-management submodules now surface energy metrics, letting sustainability teams track per-endpoint power draw, a value add that ties platform renewal conversations to corporate climate goals.
Enterprise computing endpoints still captured 54.20% of the video as a service market size in 2025. Desktop and laptop clients integrate single sign-on and policy enforcement, supporting regulated industries. Rich screen-share functions and keyboard accessibility features keep knowledge-worker engagement high. Vendors refine background-noise suppression tuned for open-plan offices, improving clarity without raising bitrate.
Mobile devices will add the most net new users at an 17.6% CAGR between 2026 and 2031. Flagship handsets now support cinematic mode with real-time depth mapping, encouraging marketing teams to produce internal updates entirely on mobile workflows. This shift compresses video production timelines from weeks to hours. The video as a service market share for mobile is expected to broaden once 5G coverage blankets suburban zones, removing reliability hesitation among field staff. At the room scale, demand coalesces around ceiling-mounted 360-degree cameras with intelligent audio zoning, equalising voice pickup for remote participants.
Geography Analysis
North America preserved leadership with 37.40% of global revenue in 2025, underpinned by high cloud maturity, robust capital-market appetite for recurring-revenue software, and early AI content-governance deployments. US enterprises integrate speech analytics with executive briefing libraries, while Canadian bilingual regulations spur automatic translation demand. Government-funded broadband grants sustain rural bandwidth, extending video reach into smaller municipalities. The region is also early to trial edge-compute offload, reducing central-cloud hops for IoT video analytics.
Asia-Pacific is projected to post a 16.55% CAGR to 2031, the fastest among all territories. Singapore added 150 MW of new colocation capacity in 2024, and Seoul doubled 5G standalone coverage, enabling regional SaaS expansion. Many ASEAN enterprises skipped legacy PBX stages altogether, so first-time video roll-outs are natively cloud-based. Linguistic diversity drives in-app caption localisation, creating competitive differentiation for providers with broad language packs. Edge nodes launched in Indonesia and the Philippines trim first-mile jitter, improving experience parity for archipelagic users.
Europe remains defined by stringent data-protection statutes and aggressive decarbonisation goals. A German automotive group replaced 8 000 inter-city flights with video in 2024, lowering Scope 3 emissions intensity by 4%. Emissions auditors accept VaaS dashboards as proxy evidence for avoided travel, anchoring video budgets inside ESG frameworks. Sovereign-cloud preferences fragment vendor support demands across multiple sub-regions. The bloc's Digital Markets Act pushes for open interoperability, nudging providers to adopt standards-based codecs and authentication plugins.
- Cisco Systems Inc.
- Zoom Video Communications Inc.
- Microsoft Corporation
- Google LLC
- Huawei Technologies Co. Ltd.
- Adobe Inc.
- Poly (HP Inc.)
- Avaya LLC
- Brightcove Inc.
- Symphony Communication Services
- Pexip AS
- LogMeIn Inc. (GoTo)
- Agora.io
- RingCentral Inc.
- 8x8 Inc.
- Amazon Web Services (Amazon Chime)
- Orange Business Services
- Vonage
- Tata Communications Ltd.
- Kaltura Inc.
- Genesys Telecommunications Labs
Additional Benefits:
- The market estimate (ME) sheet in Excel format
- 3 months of analyst support
TABLE OF CONTENTS
1 INTRODUCTION
- 1.1 Study Assumptions and Market Definition
- 1.2 Scope of the Study
2 RESEARCH METHODOLOGY
3 EXECUTIVE SUMMARY
4 MARKET LANDSCAPE
- 4.1 Market Overview
- 4.2 Market Drivers
- 4.2.1 Growing Corporate Shift from CAPEX-Heavy Video Infrastructure to OPEX-Friendly Cloud Subscriptions
- 4.2.2 Surging Consumption of Embedded Video APIs in Customer-Facing Apps (Banking, Retail, Tele-health)
- 4.2.3 Proliferation of Low-Latency 5G Networks in North America and Asia Accelerating UHD VaaS Adoption
- 4.2.4 Hybrid-Work Mandates Triggering Multi-Camera Room Upgrades Across Global 1000 Firms
- 4.2.5 AI-Powered Video Content Management Enhancing Compliance and Searchability for Regulated Industries
- 4.2.6 Rising Carbon-Reduction Targets Driving Preference for Cloud Video over Travel in Europe
- 4.3 Market Restraints
- 4.3.1 Persistent Concerns over Sovereign Data Residency in Government and BFSI Verticals
- 4.3.2 High Bandwidth Costs in Emerging African and Caribbean Markets Limiting HD Video Quality
- 4.3.3 Complex Legacy System Integration in Large Telecom and Manufacturing Enterprises
- 4.3.4 Intellectual-Property and Content-Licensing Risks in Cross-Border Video Distribution
- 4.4 Regulatory Outlook
- 4.5 Technological Outlook
- 4.6 Porter's Five Forces Analysis
- 4.6.1 Bargaining Power of Buyers
- 4.6.2 Bargaining Power of Suppliers
- 4.6.3 Threat of New Entrants
- 4.6.4 Threat of Substitutes
- 4.6.5 Intensity of Competitive Rivalry
- 4.7 Assessment of Impact of Macro-Economic Trends
5 MARKET SIZE AND GROWTH FORECASTS (VALUE)
- 5.1 By Platform
- 5.1.1 Application Management
- 5.1.2 Device Management
- 5.1.3 Network Management
- 5.1.4 Video Content Management
- 5.2 By Device
- 5.2.1 Mobility Devices
- 5.2.2 Enterprise Computing
- 5.2.3 Room-based Endpoints
- 5.3 By Service
- 5.3.1 Managed
- 5.3.2 Professional
- 5.4 By Deployment Model
- 5.4.1 Public Cloud
- 5.4.2 Private Cloud
- 5.4.3 Hybrid Cloud
- 5.5 By End-user Industry
- 5.5.1 Government and Defense
- 5.5.2 BFSI
- 5.5.3 Healthcare and Life Sciences
- 5.5.4 IT and Telecom
- 5.5.5 Media and Entertainment
- 5.5.6 Manufacturing
- 5.5.7 Education
- 5.5.8 Retail and E-Commerce
- 5.5.9 Other End-user Industries
- 5.6 By Geography
- 5.6.1 North America
- 5.6.1.1 United States
- 5.6.1.2 Canada
- 5.6.1.3 Mexico
- 5.6.2 South America
- 5.6.2.1 Brazil
- 5.6.2.2 Argentina
- 5.6.2.3 Rest of South America
- 5.6.3 Europe
- 5.6.3.1 Germany
- 5.6.3.2 United Kingdom
- 5.6.3.3 France
- 5.6.3.4 Italy
- 5.6.3.5 Spain
- 5.6.3.6 Rest of Europe
- 5.6.4 Asia-Pacific
- 5.6.4.1 China
- 5.6.4.2 Japan
- 5.6.4.3 South Korea
- 5.6.4.4 India
- 5.6.4.5 Australia
- 5.6.4.6 New Zealand
- 5.6.4.7 Rest of Asia-Pacific
- 5.6.5 Middle East and Africa
- 5.6.5.1 United Arab Emirates
- 5.6.5.2 Saudi Arabia
- 5.6.5.3 South Africa
- 5.6.5.4 Rest of Middle East and Africa
- 5.6.1 North America
6 COMPETITIVE LANDSCAPE
- 6.1 Strategic Developments
- 6.2 Vendor Positioning Analysis
- 6.3 Company Profiles (includes Global level Overview, Market level overview, Core Segments, Financials as available, Strategic Information, Products and Services, and Recent Developments)
- 6.3.1 Cisco Systems Inc.
- 6.3.2 Zoom Video Communications Inc.
- 6.3.3 Microsoft Corporation
- 6.3.4 Google LLC
- 6.3.5 Huawei Technologies Co. Ltd.
- 6.3.6 Adobe Inc.
- 6.3.7 Poly (HP Inc.)
- 6.3.8 Avaya LLC
- 6.3.9 Brightcove Inc.
- 6.3.10 Symphony Communication Services
- 6.3.11 Pexip AS
- 6.3.12 LogMeIn Inc. (GoTo)
- 6.3.13 Agora.io
- 6.3.14 RingCentral Inc.
- 6.3.15 8x8 Inc.
- 6.3.16 Amazon Web Services (Amazon Chime)
- 6.3.17 Orange Business Services
- 6.3.18 Vonage
- 6.3.19 Tata Communications Ltd.
- 6.3.20 Kaltura Inc.
- 6.3.21 Genesys Telecommunications Labs
7 MARKET OPPORTUNITIES AND FUTURE OUTLOOK
- 7.1 White-space and Unmet-Need Assessment