
|
시장보고서
상품코드
2066466
그린 데이터센터 시장 : 시장 점유율 분석, 업계 동향 및 통계, 성장 예측(2026-2031년)Green Data Center - Market Share Analysis, Industry Trends & Statistics, Growth Forecasts (2026 - 2031) |
||||||
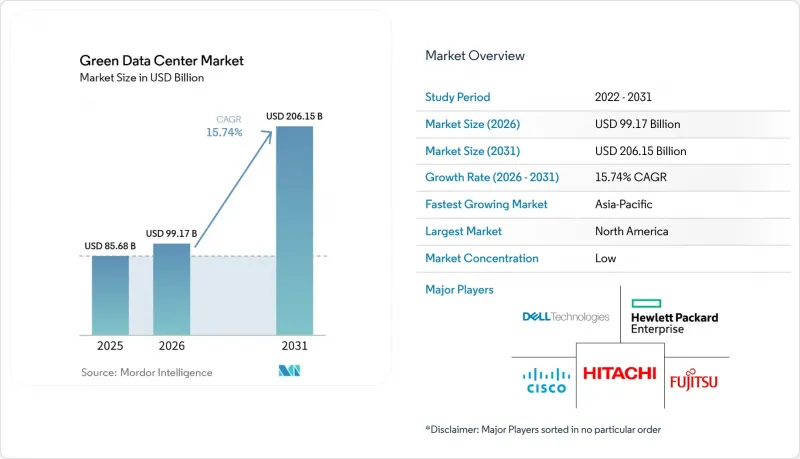
Mordor Intelligence에 의하면, 그린 데이터센터 시장 규모는 2025년에 856억 8,000만 달러로 평가되었고, 2026년 991억 7,000만 달러로 추정되고, 2031년까지 2,061억 5,000만 달러에 이를 것으로 예측되며, 예측 기간(2026-2031년) CAGR은 15.74%를 나타낼 전망입니다.
본 보고서는 구성 요소별(서비스, 솔루션), 데이터센터 유형별(코로케이션 제공업체, 하이퍼스케일러 및 클라우드 서비스 제공업체, 엔터프라이즈, 엣지), 티어 유형별(Tier 1 및 2, Tier 3, Tier 4), 산업 분야별(의료, 은행, 금융서비스 및 보험(BFSI), 정부 기관 등), 그리고 지역별로 분류되어 있습니다. 시장 전망은 금액(달러) 기준으로 제시되어 있습니다.
세계의 그린 데이터센터 시장 동향 및 인사이트
하이퍼스케일 클라우드 확장이 100% 재생에너지로 전환
그린 데이터센터 시장은 현재 자사의 직접 소비량을 훨씬 웃도는 규모의 풍력, 태양광 및 배터리 하이브리드 프로젝트를 계약하고 있는 하이퍼스케일 사업자들로부터 혜택을 받고 있습니다. 아마존은 2024년까지 전사적으로 100% 재생에너지 사용을 달성할 예정이며, 마이크로소프트는 2030년까지 탄소 네거티브 사업 운영을 공약하고 있고, 구글은 잉여 재생전력을 폐열을 추가로 수익화하는 도시 지역 난방 프로젝트에 활용하고 있습니다. 이러한 전략을 통해 사업자는 가격이 안정적인 전력을 확보하고, 재생에너지 크레딧 판매를 통해 헤지 수익을 창출하며, 코로케이션 시설 소유자가 향후 따를 조달 모델을 확립할 수 있게 됩니다.
OECD 회원국에서 PUE 1.3 이하로 규제를 추진
EU의 새로운 지침과 개정된 미국 에너지 기준에 따라, 그린 데이터센터 시장에서 PUE, 물 사용 효율 및 탄소 집약도에 대한 투명한 보고가 의무화되었습니다. 독일의 에너지 효율법에서는 냉각 효율 공개가 의무화되어 있는 반면, AWS는 2024년에 전 세계 PUE 1.15를 보고했으며, AI 기반 워크로드 스케줄링과 액체 냉각을 결합함으로써 규제 준수가 가능함을 입증했습니다. 조기에 개보수를 실시하는 사업자는 팬의 전력 소비 감소 및 기계적 중복성 축소를 통한 비용 절감 효과를 누릴 수 있으며, 코로케이션 계약 갱신 시 경쟁력을 높일 수 있습니다. 규정 위반에 대한 처벌은 회계연도마다 강화되고 있으며, 에너지 효율이 높은 장비 도입을 위한 단기적인 움직임이 가속화되고 있습니다.
브라운필드 개보수와 비교한 초기 설비 투자(CAPEX)의 가산율(30-40%)
고성능 단열재, 액체 침지 냉각 랙에 대응하는 구조화 케이블, 그리고 현장 태양광 발전 및 축전 시스템은 기존 쉘에 비해 건설 비용을 최대 40%까지 증가시킵니다. 저탄소 콘크리트나 상변화 단열벽과 같은 건축자재는 2025년에도 공급 제약이 지속되고 있어, 그린 데이터센터 시장의 전개에 일정상의 리스크를 초래하고 있습니다. 소규모 사업자들은 완전한 친환경 건축 대신 단계적인 효율화 개보수로 전환하는 경우가 많아, 부품 가격이 정상화될 때까지 전체적인 용량 증가세가 주춤하고 있습니다.
부문별 분석
솔루션 부문은 2025년 매출의 62.54%를 차지했으며, 자본 집약도 측면에서 그린 데이터센터 시장 규모를 주도하고 있습니다. 사업자들은 효율화 요건을 충족하기 위해 전원 조정 장치, 열회수형 칠러, AI를 활용한 DCIM 소프트웨어를 우선적으로 도입하고 있는 반면, 액체에서 칩으로의 냉각 제품 라인에서는 출하 대수가 두 자릿수 증가를 기록했습니다. 서비스 부문은 절대값으로는 작지만, 시설 소유주들이 수명 주기 전반에 걸친 지속가능성 감사, AI를 활용한 워크로드 오케스트레이션, ESG 보고를 위해 전문가를 기용함에 따라 연평균 성장률(CAGR) 15.38%를 나타낼 것으로 전망됩니다.
효율 98%의 UPS 모듈과 스마트 그리드 인터페이스를 포함한 전원 시스템의 업그레이드를 통해 내결함성이 강화되고 운영 비용이 절감되었습니다. 냉각 솔루션은 고상식 에어 핸들러에서 온수 루프와 결합된 리어 도어식 열교환기로 전환되었습니다. 서비스 측면에서는 통합 파트너사들이 탄소 배출량 산정 대시보드와 재생에너지 크레딧(REC) 거래 플랫폼을 패키지로 제공합니다. 이러한 지속가능성 관리의 전문화는 그린 데이터센터 업계의 구조적 발전을 보여줍니다.
기업의 아웃소싱 전략이 지속되는 가운데, 코로케이션 기업들은 2025년 지출의 36.62%를 차지했으나, 하이퍼스케일러들은 연평균 성장률(CAGR) 16.21%를 기록하며 다른 기업들을 앞질러, 자체 소유 용량 부문에서 그린 데이터센터 시장 전체의 규모를 확대했습니다. 이들이 체결한 10억 달러 규모의 재생에너지 전력구매계약(PPA)과 맞춤형 침지 냉각 시스템은 기술 도입 동향을 주도하고 있으며, 그 영향은 소매용 코로케이션 스위트 분야로도 확산되고 있습니다.
기업 사업자는 견조한 추세를 유지하며, 이사회 차원에서 설정된 배출량 목표를 달성하기 위해 봉쇄형 포드 및 모듈식 배터리 저장 장치를 활용해 기존 시설(브라운필드)을 현대화했습니다. 엣지 마이크로 시설은 아직 발전 단계에 있지만, 5G 기지국의 운영을 지원하기 위해 수동 냉각 및 태양광 발전 기반 UPS를 도입했습니다. 클라우드 대기업의 조달 역량 덕분에 부품 공급업체의 비용 곡선은 지속적으로 하락하고 있으며, 이는 간접적으로 2차 공급업체 시장 진입 장벽을 낮추고 있습니다.
지역별 분석
북미는 2025년에 매출의 26.14%를 차지한 것으로 평가되었으며, 신뢰성이 높은 재생에너지 발전, 풍부한 세제 혜택, 그리고 버지니아주, 오리건주, 텍사스주 주변에 집중된 하이퍼스케일 사업이 이를 뒷받침하고 있습니다. 주 규제 당국이 상세한 ESG 정보 공개를 의무화하고 있는 만큼, AI 기반 에너지 관리 시스템이 조기에 도입되어 이 지역의 친환경 데이터센터 시장은 기술적 성숙도 면에서 앞서 나가고 있습니다.
아시아태평양은 일본의 탄소 중립 데이터센터 구상, 인도의 데이터 주권 정책, 호주의 재생에너지 구역이 신규 건설을 뒷받침함에 따라, 2031년까지 연평균 성장률(CAGR)이 22.86%를 나타낼 것으로 전망됩니다. 동남아시아의 송전망 병목 현상은 전용선을 활용한 태양광 발전과 축전지의 결합 사업을 촉진하고 있으며, 송전망 업그레이드가 실현된다면 이 지역은 비약적인 효율 향상을 이룰 수 있는 기반이 마련되어 있습니다.
유럽은 ‘기후 중립 데이터센터 운영자 협약(Climate Neutral Data Centre Operator Pact)’과 같은 통일된 정책을 통해 중심적인 역할을 유지하고 있습니다. 북유럽의 데이터센터 캠퍼스에서는 자연 냉각과 풍부한 수력 발전을 활용하여 열을 도시 열 공급망에 공급함으로써, 실효 PUE를 1.1까지 낮추고 있습니다. 남유럽에서는 태양광 발전과 다른 전력원을 결합한 하이브리드 프로젝트가 가속화되고 있으며, 독일의 기업용 전력구매계약(PPA)이 프랑크푸르트에서의 멀티클라우드 도입을 뒷받침하고 있습니다. 전반적으로, 지역 정책의 일관성이 그린 데이터센터 시장의 투자 모멘텀을 뒷받침하고 있습니다.
기타 혜택 :
- 엑셀 형식 시장 예측(ME) 시트
- 3개월간의 애널리스트 지원
자주 묻는 질문
목차
제1장 서론
제2장 조사 방법
제3장 주요 요약
제4장 시장 구도
제5장 시장 규모 및 성장 예측
제6장 경쟁 구도
제7장 시장 기회 및 향후 전망
AJY 26.06.24According to Mordor Intelligence, the green data center market size was valued at USD 85.68 billion in 2025 and is estimated to grow from USD 99.17 billion in 2026 to reach USD 206.15 billion by 2031, at a CAGR of 15.74% during the forecast period (2026-2031).

This report is Segmented by Component (Service, Solution), Data Center Type (Colocation Providers, Hyperscalers/Cloud Service Providers, Enterprise, and Edge), Tier Type (Tier 1 and 2, Tier 3, Tier 4), Industry Vertical (Healthcare, BFSI, Government and More) and by Geography. The Market Forecasts are Provided in Terms of Value (USD).
Global Green Data Center Market Trends and Insights
Hyperscale Cloud Build-outs Shifting to 100% Renewable Power
The green data center market is benefiting from hyperscale operators that now contract for wind, solar, and battery-hybrid projects sized well beyond their direct consumption. Amazon achieved company-wide 100% renewable energy in 2024, Microsoft has pledged carbon-negative operations by 2030, and Google channels surplus renewable power into municipal district-heating projects that further monetise waste heat. These strategies help operators lock in price-stable electricity, create hedging income through renewable-energy credit sales, and establish procurement templates that colocation landlords subsequently follow
Regulatory Push for PUE <= 1.3 Across OECD Economies
New directives in the EU and updated U.S. energy codes require transparent reporting of PUE, water-usage effectiveness, and carbon intensity in the green data center market. Germany's Energy Efficiency Act mandates cooling-efficiency disclosures, while AWS reported a global PUE of 1.15 in 2024, proving compliance is feasible when AI-based workload scheduling and liquid cooling are combined. Operators that retrofit early capture cost savings from lower fan energy and reduced mechanical redundancy, improving competitiveness during colocation contract renewals. Penalties for non-compliance increase each fiscal year, creating a near-term rush to commission energy-efficient equipment.
Up-front CAPEX Premium (30-40%) Versus Brownfield Retrofits
High-performance insulation, structured cabling rated for immersion-cooled racks, and on-site solar plus storage systems inflate build costs by as much as 40% relative to conventional shells. Construction inputs such as low-carbon concrete and phase-change thermal walls remain supply-constrained in 2025, adding schedule risk to green data center market deployments. Smaller operators often pivot to incremental efficiency retrofits instead of full green builds, slowing overall capacity additions until component prices normalise.
Other drivers and restraints analyzed in the detailed report include:
- On-site Hydrogen Fuel-Cell Pilots in Greater than 10 MW Campuses (2025-2028)
- AI-workload Waste-Heat Reuse for District Heating Networks
- Limited Green-Power Grid Capacity in Emerging Economies
For complete list of drivers and restraints, kindly check the Table Of Contents.
Segment Analysis
Solutions generated 62.54% of 2025 revenue, underpinning the green data center market size leadership in capital intensity. Operators prioritised power-conditioning gear, heat-recovery chillers, and artificial-intelligence DCIM software to satisfy efficiency mandates, while liquid-to-chip cooling lines experienced double-digit unit shipment growth. Services, though smaller in absolute value, are forecast for 15.38% CAGR as facility owners engage specialists for lifecycle sustainability audits, AI-driven workload orchestration, and ESG reporting.
Power-train upgrades, including 98%-efficient UPS modules and smart grid interfaces, strengthened resilience and trimmed operating costs. Cooling solutions shifted from raised-floor air handlers to rear-door heat exchangers coupled with warm-water loops. On the services side, integration partners now bundle carbon accounting dashboards and renewable-certificate trading platforms. This professionalisation of sustainability management marks a structural uplift in the green data center industry.
Colocation firms held 36.62% of 2025 spending as enterprises continued outsourcing strategies, yet hyperscalers outpaced the field with a 16.21% CAGR, enlarging the overall green data center market size for self-owned capacity. Their billion-dollar renewable PPAs and custom-designed immersion systems set technology adoption curves that trickle down into retail colocation suites.
Enterprise operators remained steady, refreshing brownfield assets with containment pods and modular battery storage to meet board-level emissions targets. Edge micro-facilities, though nascent, adopted passive cooling and solar-powered UPS to support 5G cell-site processing. The procurement heft of cloud majors keeps component suppliers' cost curves descending, indirectly lowering barriers for second-tier providers.
Geography Analysis
North America accounted for 26.14% revenue in 2025, buttressed by reliable renewable generation, robust tax incentives, and hyperscale activity clustering around Virginia, Oregon, and Texas. State regulators impose granular ESG disclosures, prompting early adoption of AI-based energy management that pushes the regional green data center market ahead in technology maturity.
Asia Pacific is forecast for a 22.86% CAGR through 2031 as Japan's carbon-neutral data center initiative, India's data-sovereignty policy, and Australia's renewable energy zones catalyse new builds. Grid bottlenecks in Southeast Asia have spurred private-wire solar plus battery deals, positioning the region for leap-frog efficiency gains once interconnect upgrades materialise.
Europe maintains a central role through unified policy such as the Climate Neutral Data Centre Operator Pact. Nordic campuses leverage near-free cooling and ample hydropower, exporting heat into municipal networks and thereby lowering effective PUE to 1.1. Southern Europe accelerates solar-hybrid projects, and Germany's corporate PPAs fuel multicloud adoption in Frankfurt. Collectively, regional policy coherence sustains investment momentum within the green data center market
- Fujitsu Ltd
- Cisco Systems Inc.
- Hewlett Packard Enterprise Co.
- Dell Technologies Inc.
- Hitachi Ltd
- Schneider Electric SE
- IBM Corporation
- Eaton Corporation
- Vertiv Holdings Co
- Equinix Inc.
- Digital Realty Trust Inc.
- NTT Communications Corp.
- Amazon Web Services Inc.
- Microsoft Corp.
- Google LLC
- Huawei Technologies Co. Ltd
- Rittal GmbH and Co. KG
- Siemens AG
- Vapor IO Inc.
- Iron Mountain Inc.
- QTS Realty Trust Inc.
- Keppel Data Centres
Additional Benefits:
- The market estimate (ME) sheet in Excel format
- 3 months of analyst support
TABLE OF CONTENTS
1 INTRODUCTION
- 1.1 Study Assumptions and Market Definition
- 1.2 Scope of the Study
2 RESEARCH METHODOLOGY
3 EXECUTIVE SUMMARY
4 MARKET LANDSCAPE
- 4.1 Market Overview
- 4.2 Market Drivers
- 4.2.1 Hyperscale cloud build-outs shifting to 100 % renewable power
- 4.2.2 Regulatory push for PUE Less than or Equal to 1.3 across OECD economies
- 4.2.3 On-site hydrogen fuel-cell pilots in Greater Than 10 MW campuses (2025-2028)
- 4.2.4 AI-workload waste-heat reuse for district heating networks
- 4.2.5 Location-based renewable-energy credits monetization
- 4.2.6 Liquid-cooling turnkey ecosystems from server-OEM alliances
- 4.3 Market Restraints
- 4.3.1 Up-front CAPEX premium (30-40 %) versus brownfield retrofits
- 4.3.2 Limited green-power grid capacity in emerging economies
- 4.3.3 Scarcity of recycled-water rights near urban cores
- 4.3.4 Supply-chain volatility for low-GWP refrigerants (R-718, R-1234yf)
- 4.4 Supply-Chain Analysis
- 4.5 Regulatory Landscape
- 4.6 Technological Outlook
- 4.7 Porter's Five Forces Analysis
- 4.7.1 Bargaining Power of Suppliers
- 4.7.2 Bargaining Power of Buyers
- 4.7.3 Threat of New Entrants
- 4.7.4 Intensity of Competitive Rivalry
- 4.7.5 Threat of Substitute Products
- 4.8 Assesment of Macroeconomic Factors on the Market
5 MARKET SIZE AND GROWTH FORECASTS (VALUE)
- 5.1 By Component
- 5.1.1 By Service
- 5.1.1.1 System Integration
- 5.1.1.2 Monitoring Services
- 5.1.1.3 Professional Services
- 5.1.1.4 Other Services
- 5.1.2 By Solution
- 5.1.2.1 Power
- 5.1.2.2 Cooling
- 5.1.2.3 Servers
- 5.1.2.4 Networking Equipment
- 5.1.2.5 Management Software
- 5.1.2.6 Other Solutions
- 5.1.1 By Service
- 5.2 By Data Center Type
- 5.2.1 Colocation Providers
- 5.2.2 Hyperscalers/Cloud Service Providers
- 5.2.3 Enterprise and Edge
- 5.3 By Tier Type
- 5.3.1 Tier 1 and 2
- 5.3.2 Tier 3
- 5.3.3 Tier 4
- 5.4 By Industry Vertical
- 5.4.1 Healthcare
- 5.4.2 BFSI
- 5.4.3 Government
- 5.4.4 Telecom and IT
- 5.4.5 Manufacturing
- 5.4.6 Media and Entertainment
- 5.4.7 Other Verticals
- 5.5 By Geography
- 5.5.1 North America
- 5.5.1.1 United States
- 5.5.1.2 Canada
- 5.5.1.3 Mexico
- 5.5.2 South America
- 5.5.2.1 Brazil
- 5.5.2.2 Argentina
- 5.5.2.3 Rest of South America
- 5.5.3 Europe
- 5.5.3.1 Germany
- 5.5.3.2 United Kingdom
- 5.5.3.3 France
- 5.5.3.4 Netherlands
- 5.5.3.5 Rest of Europe
- 5.5.4 Asia_Pacific
- 5.5.4.1 China
- 5.5.4.2 Japan
- 5.5.4.3 India
- 5.5.4.4 South Korea
- 5.5.4.5 Australia and New Zealand
- 5.5.4.6 Rest of Asia-Pacific
- 5.5.5 Middle East and Africa
- 5.5.5.1 Middle East
- 5.5.5.1.1 United Arab Emirates
- 5.5.5.1.2 Saudi Arabia
- 5.5.5.1.3 Turkey
- 5.5.5.1.4 Rest of Middle East
- 5.5.5.2 Africa
- 5.5.5.2.1 South Africa
- 5.5.5.2.2 Nigeria
- 5.5.5.2.3 Rest of Africa
- 5.5.5.1 Middle East
- 5.5.1 North America
6 COMPETITIVE LANDSCAPE
- 6.1 Market Concentration
- 6.2 Strategic Moves
- 6.3 Market Share Analysis
- 6.4 Company Profiles (includes Global level Overview, Market level overview, Core Segments, Financials as available, Strategic Information, Market Rank/Share, Products and Services, Recent Developments)
- 6.4.1 Fujitsu Ltd
- 6.4.2 Cisco Systems Inc.
- 6.4.3 Hewlett Packard Enterprise Co.
- 6.4.4 Dell Technologies Inc.
- 6.4.5 Hitachi Ltd
- 6.4.6 Schneider Electric SE
- 6.4.7 IBM Corporation
- 6.4.8 Eaton Corporation
- 6.4.9 Vertiv Holdings Co
- 6.4.10 Equinix Inc.
- 6.4.11 Digital Realty Trust Inc.
- 6.4.12 NTT Communications Corp.
- 6.4.13 Amazon Web Services Inc.
- 6.4.14 Microsoft Corp.
- 6.4.15 Google LLC
- 6.4.16 Huawei Technologies Co. Ltd
- 6.4.17 Rittal GmbH and Co. KG
- 6.4.18 Siemens AG
- 6.4.19 Vapor IO Inc.
- 6.4.20 Iron Mountain Inc.
- 6.4.21 QTS Realty Trust Inc.
- 6.4.22 Keppel Data Centres
7 MARKET OPPORTUNITIES and FUTURE OUTLOOK
- 7.1 White-space and Unmet-Need Assessment
