

|
시장보고서
상품코드
2066582
팀 협업 도구 시장 : 점유율 분석, 업계 동향과 통계, 성장 예측(2026-2031년)Team Collaboration Tools - Market Share Analysis, Industry Trends & Statistics, Growth Forecasts (2026 - 2031) |
||||||
 Mordor Intelligence
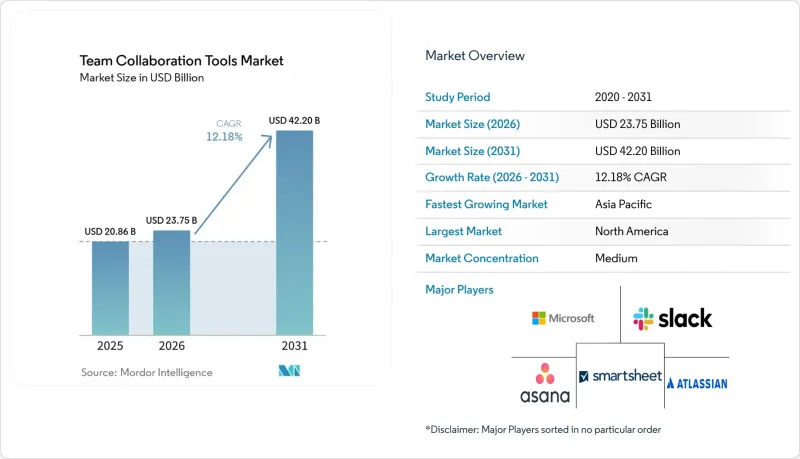
Mordor Intelligence에 의하면, 팀 협업 도구 시장 규모는 2025년 208억 6,000만 달러에서 2026년에는 237억 5,000만 달러로 확대되어 2031년까지 422억 달러에 이를 것으로 예상되고 있어 2026년부터 2031년까지 CAGR 12.18%로 성장할 전망입니다.
본 보고서는 도입 모델(클라우드, On-Premise, 하이브리드), 조직 규모(중소기업 및 대기업), 소프트웨어 유형(커뮤니케이션·조정, 회의, 프로젝트 관리, 화이트보드), 구성 요소(소프트웨어 및 서비스), 최종 사용 산업 분야(IT 및 통신, 은행, 금융서비스 및 보험(BFSI), 헬스케어 등) 및 지역별로 분류되어 있습니다. 시장 전망은 금액(달러) 기준으로 제시되어 있습니다.
전 세계 팀 협업 도구 시장 동향 및 인사이트
하이브리드 및 비동기형 업무 모델의 부상
기업들은 8-12개의 시간대에 걸쳐 분산되어 있는 직원들이 끝없이 이어지는 실시간 회의에 의존하지 않고도 협업할 수 있도록 디지털 업무 환경을 재구축하고 있습니다. 스레드 형식의 토론, 동영상 클립, AI 생성 요약과 같은 비동기 기능은 필수 요소로 자리 잡았으며, 분산형 팀의 68%가 플랫폼 선정 시 결정적인 요소로 꼽고 있습니다. Slack의 ‘Clips’ 이용은 2025년 1분기부터 2026년 1분기에 걸쳐 3배로 증가했습니다. 이는 매니저가 매일 진행하던 스탠드업 미팅을, 동료들이 원할 때 언제든지 시청할 수 있는 짧은 동영상으로 대체하여 진행 상황을 보고했기 때문입니다. 생산성에 관한 조사에 따르면, 비동기 환경에서 근무하는 직원의 81%가 “더 효율적”이라고 느끼는 반면, 회의 중심의 환경에서는 그 비율이 52%에 그치고 있습니다. 그러나 문서 중심 문화로의 전환에 따라 교육 수요가 증가하면서, 이는 결과적으로 서비스 수익의 성장을 뒷받침하고 있습니다. 비동기 기록은 감사 기준을 충족해야 하므로, ISO 27001과 같은 규정 준수 프레임워크가 도구 선정에 영향을 미치고 있습니다.
중소기업의 SaaS 조달 주기 가속화
모듈식 가격 책정 방식 덕분에 많은 중소기업에서 구매 결정까지 걸리는 기간이 9개월에서 90일 미만으로 단축되었으며, 여러 협업 제품군을 동시에 체험해 볼 수 있게 되었습니다. 2025년 맥킨지의 조사에 따르면, SaaS 스택을 자유롭게 조합한 기업들은 IT 비용을 18-22% 절감할 수 있었던 것으로 나타났습니다. 유연성은 복잡성을 초래합니다. 10개 이상의 앱을 동시에 사용하는 기업의 경우, 직원들의 불만도가 30% 더 높은 것으로 보고되고 있어, 알림을 한곳에서 관리할 수 있는 Workato와 같은 통합 허브에 대한 수요가 증가하고 있습니다. 따라서 팀 협업 도구 시장은 양극화되어 있으며, 중소기업은 속도를 중시하는 반면, 대기업은 거버넌스에 중점을 두고 있습니다.
섀도 IT와 도구의 난립이 CIO의 총소유비용(TCO)을 부풀리고 있습니다.
일반 소비자용 앱의 무단 설치로 인해 기업의 라이선싱, 통합 및 보안 비용이 최대 40%나 증가하고 있습니다. 평균적으로 조직은 14개의 협업 제품을 도입하고 있지만, 공식적으로 거버넌스가 적용되는 제품은 6개에 불과하며, 나머지 8개는 정책 적용이 일관되지 않은 ‘회색지대’에 놓여 있습니다. 플랫폼이 하나 늘어날 때마다 API 유지보수 및 사용자 지원 예산이 소모되어, 혁신에 투입되어야 할 자금이 전용되고 맙니다. 현재 각 벤더사는 직원들이 사전에 승인된 통합 기능을 직접 설치할 수 있는 엄선된 마켓플레이스를 제공하고 있으며, 완전한 차단보다는 거버넌스 체계에 중점을 두는 방향으로 전환하고 있습니다.
부문별 분석
하이브리드 솔루션은 2031년까지 연평균 성장률(CAGR) 12.86%로 확대되며, 도입 형태 중 가장 빠른 성장세를 보였습니다. 초기 비용이 낮기 때문에 2025년 시점에서도 클라우드가 팀 협업 도구 시장의 72.17%를 차지하고 있었지만, 규제상의 장벽으로 인해 은행과 정부 기관은 특정 워크로드를 On-Premise에서 유지해야만 했습니다. 마이크로소프트의 보고서에 따르면, 2026년 ‘Teams’의 신규 기업 계약 중 하이브리드 구성이 34%를 차지하여, 전년도의 22%에서 증가했습니다. 팀 협업 도구 시장 규모에서 이러한 점유율 확대는 조직이 데이터의 자율 관리와 클라우드 기반 AI 기능 사이에서 어떻게 균형을 맞추고 있는지를 보여줍니다.
진정한 데이터 모빌리티에 대한 수요가 높아지는 가운데, 각 벤더들은 회의 녹화 데이터를 로컬 하드웨어에 저장하면서, 텍스트 변환 처리는 퍼블릭 클라우드에서 수행할 수 있도록 해주는 엣지 어플라이언스 및 페더레이티드 ID 서비스에 대한 투자를 서둘러야 하는 상황에 놓여 있습니다. 소규모 제공업체들은 이러한 듀얼 스택 방식의 엔지니어링에 자금을 투입하는 데 어려움을 겪고 있으며, 하이퍼스케일 플랫폼과 틈새 서비스 간의 격차가 확대되고 있습니다. 데이터 현지화에 관한 법규를 도입하는 지역이 늘어남에 따라, 하이브리드 환경은 예외에서 표준으로 전환될 것으로 보입니다.
2025년에는 중소기업(SME)이 지출의 58.58%를 차지하며, 연평균 성장률(CAGR) 12.96%로 대기업을 웃도는 성장이 예상됩니다. 중소기업용 팀 협업 도구 시장 규모가 확대되고 있는 한 가지 이유는 기능이 모듈화된 SaaS 요금제를 통해 설비 투자에 대한 장벽이 해소되었기 때문입니다. 유연한월단위 라이선스 계약을 통해 중소기업은 3-4개의 플랫폼을 동시에 체험해 볼 수 있으며, 대부분의 경우 Slack의 메시징 기능과 Asana의 업무 관리, Miro의 화이트보드 기능을 함께 활용하고 있습니다.
비용 절감 효과는 매우 크며, 맥킨지의 추산에 따르면 모듈형 도구를 도입한 기업의 IT 지출은 최대 22%까지 절감되는 것으로 나타났습니다. 그러나 통합 프레임워크의 구축이 지연되면, 도구가 난립함으로써 그 장점이 훼손되고 맙니다. 따라서 중소기업을 대상으로 하는 벤더들은 코딩이 필요 없는 턴키 방식의 자동화 템플릿을 제공합니다. 반면, 대기업들은 마이크로소프트나 애트라시안이 제공하는 제품군 기반의 통합을 우선시하고 있으며, 단일 공급업체에 의한 거버넌스를 확보하는 대신 혁신 속도가 다소 느려지는 것을 용인하고 있습니다.
지역별 분석
2025년 매출액 중 북미가 39.29%를 차지했습니다. Microsoft Copilot이나 Slack AI와 같은 AI 애드온의 도입률은 포춘 500대 기업에서 40%를 넘어섰지만, 사용자 보급률이 포화 상태에 가까워짐에 따라 전체적인 성장률은 연평균 성장률(CAGR) 11.8%로 둔화되고 있습니다. 각 벤더사는 프리미엄 AI 및 거버넌스 모듈을 통해 사용자 1인당 평균 수익(ARPS) 향상에 주력하고 있습니다. 캐나다와 멕시코는 미국보다 다소 빠른 속도로 성장하고 있지만, 두 나라를 합쳐도 해당 지역 전체 지출의 6분의 1 미만에 그치고 있습니다.
아시아태평양은 연평균 성장률(CAGR) 13.22%를 기록하며 가장 빠르게 성장하고 있는 지역입니다. 인도의 DPDP법에 따라 국내 데이터센터 건설이 촉진되면서, 국내 벤더인 Zoho가 중소기업(SME) 부문에서 약 5분의 1 시장 점유율을 확보하는 데 기여하고 있습니다. 중국에서는 DingTalk과 같은 국내산 소프트웨어 제품군과, PIPL을 준수하는 폐쇄적인 환경에서 운영되는 해외 도구들 사이에서 여전히 양극화가 나타나고 있습니다. 일본의 연평균 성장률(CAGR)이 11.2%로 비교적 낮은 것은 대면 교류를 선호하는 문화적 경향을 반영한 것이지만, Cybozu의 로우코드 워크플로우 빌더가 기존 방식의 기업들을 점차 디지털 프로세스로 이끌고 있습니다. 동남아시아 국가들에서는 정부의 디지털화 추진에 힘입어 약 14%의 성장률을 기록하고 있습니다.
유럽은 팀 협업 도구 시장 규모의 24-26%를 차지하며 연평균 성장률(CAGR) 11.5%로 성장하고 있으며, 이는 GDPR(EU 개인정보보호규정) 및 DORA의 영향을 크게 받고 있습니다. 독일, 영국, 프랑스는 유럽 대륙 전체 지출의 60%를 차지하고 있으며, 가격보다 데이터 저장 위치 보장을 우선시하고 있습니다. 동유럽의 아웃소싱 거점들은 국경을 초월한 개발자 팀을 관리하기 위해 협업 솔루션을 신속하게 도입하고 있습니다. 중동 및 아프리카를 합친 지역에서는 아랍에미리트(UAE)의 스마트시티 계획과 남아프리카공화국의 금융 서비스 디지털화가 주도하는 가운데, 12% 중반대의 성장세를 유지하고 있습니다. 남미는 연평균 성장률(CAGR)이 12%에 육박해 다소 뒤처지고 있지만, 브라질이 시장의 대부분을 차지하고 있습니다.
기타 혜택:
- 엑셀 형식 시장 예측(ME) 시트
- 3개월간의 애널리스트 지원
자주 묻는 질문
목차
제1장 서론
제2장 조사 방법
제3장 주요 요약
제4장 시장 구도
제5장 시장 규모와 성장 예측
제6장 경쟁 구도
제7장 시장 기회와 향후 전망
JHS 26.06.29According to Mordor Intelligence, the team collaboration tools market size is expected to increase from USD 20.86 billion in 2025 to USD 23.75 billion in 2026 and reach USD 42.2 billion by 2031, growing at a CAGR of 12.18% over 2026-2031.
This report is Segmented by Deployment Model (Cloud, On-Premise, and Hybrid), Organisation Size (SMEs, and Large Enterprises), Software Type (Communication and Coordination, Conferencing, Project Management, and Whiteboarding), Component (Software, and Services), End-User Industry (IT and Telecom, BFSI, Healthcare, and More), and Geography. Market Forecasts are Provided in Terms of Value (USD).
Global Team Collaboration Tools Market Trends and Insights
Rise Of Hybrid and Asynchronous Work Models
Enterprises are re-architecting digital workplaces so employees scattered across 8-12 time zones can collaborate without endless live meetings. Asynchronous features such as threaded discussions, video clips, and AI-generated summaries have become must-haves, cited by 68% of distributed teams as decisive in platform selection. Slack's Clips usage tripled between Q1 2025 and Q1 2026 as managers replaced daily stand-ups with short video updates that colleagues could watch on demand. Productivity studies show that 81% of workers in asynchronous environments feel more effective versus 52% in meeting-heavy settings. However, shifting to a documentation-centric culture raises training needs, which in turn fuels service revenue growth. Compliance frameworks like ISO 27001 now influence tool choice because asynchronous records must meet audit standards.
Accelerating SaaS Procurement Cycles Among SMBs
Modular pricing has shortened buying decisions from nine months to under ninety days for many SMEs, enabling side-by-side trials of multiple collaboration suites. A 2025 McKinsey study found firms that adopted mix-and-match SaaS stacks cut IT costs by 18-22%. Flexibility brings complexity: companies juggling more than ten apps report 30% higher employee frustration, sparking demand for integration hubs like Workato that consolidate notifications. The Team collaboration tools market therefore bifurcates, with SMEs valuing speed while large enterprises focus on governance.
Shadow-IT And Multi-Tool Sprawl Inflating CIO TCO
Unauthorized adoption of consumer apps inflates enterprise licensing, integration, and security costs by as much as 40%. On average, organizations run fourteen collaboration products but formally govern only six, leaving eight in a gray zone of inconsistent policy enforcement. Each extra platform consumes budget for API maintenance and user support, diverting funds from innovation. Vendors now offer curated marketplaces where employees can self-install pre-approved integrations, shifting emphasis to governance frameworks rather than outright blockage.
Other drivers and restraints analyzed in the detailed report include:
- Generative-AI Plug-ins Boosting Productivity Per User
- Growing Focus on Employee-Experience Platforms
- Rising Data-Sovereignty and Residency Mandates
For complete list of drivers and restraints, kindly check the Table Of Contents.
Segment Analysis
Hybrid solutions expanded at a 12.86% CAGR through 2031, the quickest among deployment types. While cloud still controlled 72.17% of the Team collaboration tools market share in 2025 thanks to low upfront costs, regulatory hurdles prompted banks and governments to keep select workloads on premises. Microsoft reported that hybrid configurations accounted for 34% of new Teams enterprise deals in 2026, up from 22% the year prior. This growing slice of Team collaboration tools market size illustrates how organizations balance sovereign data control with cloud-based AI features.
Demand for true data mobility is pushing vendors to invest in edge appliances and federated identity services that let meeting recordings live on local hardware while transcriptions process in the public cloud. Smaller providers struggle to fund such dual-stack engineering, widening the gap between hyperscale platforms and niche offerings. As more regions adopt data-localization statutes, hybrid will likely shift from exception to default.
SMEs held 58.58% of spending in 2025 and are projected to outpace large enterprises at a 12.96% CAGR. The Team collaboration tools market size for SMEs rises partly because feature-modular SaaS tiers eliminate capital expenditure barriers. Flexible month-to-month licensing lets small firms test three or four platforms concurrently, often combining Slack messaging with Asana tasks and Miro whiteboards.
Cost savings can be substantial McKinsey pegged IT spend reductions at up to 22% for modular adopters but tool sprawl erodes those gains if integration frameworks lag. Vendors courting SMEs therefore ship turnkey automation templates that require no coding. Large enterprises, by contrast, prioritize consolidation with suitelike products from Microsoft or Atlassian, accepting moderately slower innovation in return for single-vendor governance.
Geography Analysis
North America accounted for 39.29% of 2025 revenue. Adoption of AI add-ons such as Microsoft Copilot and Slack AI surpassed 40% among Fortune 500 firms, yet overall growth moderates to 11.8% CAGR as user penetration approaches saturation. Vendors focus on boosting average revenue per seat via premium AI and governance modules. Canada and Mexico grow a bit faster than the United States, but together still represent less than one-sixth of regional spend.
Asia-Pacific is the fastest-growing region at 13.22% CAGR. India's DPDP Act spurs local data-center builds, helping domestic vendor Zoho secure roughly one-fifth of the SME segment. China remains bifurcated between domestic suites like DingTalk and global tools operating in walled-off partitions compliant with PIPL. Japan's more modest 11.2% CAGR reflects cultural preference for in-person interactions, though low-code workflow builders from Cybozu are nudging older firms toward digital processes. Southeast Asian nations log nearly 14% growth as governments mandate digitalization.
Europe holds 24-26% of the Team collaboration tools market size and grows at 11.5% CAGR, heavily shaped by GDPR and DORA. Germany, the United Kingdom, and France contribute 60% of continental spend, prioritizing data-residency guarantees over price. Eastern European outsourcing hubs adopt collaboration suites quickly to manage cross-border developer teams. The Middle East and Africa combined maintain mid-12% growth, led by United Arab Emirates smart-city programs and South African financial-services digitization. South America trails slightly at near-12% CAGR, with Brazil commanding the lion's share.
- Microsoft Corporation
- Salesforce Inc. (Slack)
- Google LLC (Workspace)
- Atlassian Corporation PLC
- Zoom Video Communications Inc.
- Smartsheet Inc.
- Asana Inc.
- Cisco Systems Inc.
- Zoho Corporation Pvt. Ltd.
- Monday.com Ltd.
- Wrike Inc.
- TigerConnect Inc.
- Huddle (Ninian Solutions Ltd.)
- Notion Labs Inc.
- ClickUp Inc.
- Basecamp LLC
- Miro Corporation
- Airtable Inc.
- Symphony Communication Services LLC
- Cybozu Inc.
Additional Benefits:
- The market estimate (ME) sheet in Excel format
- 3 months of analyst support
TABLE OF CONTENTS
1 INTRODUCTION
- 1.1 Study Assumptions and Market Definition
- 1.2 Scope of the Study
2 RESEARCH METHODOLOGY
3 EXECUTIVE SUMMARY
4 MARKET LANDSCAPE
- 4.1 Market Overview
- 4.2 Market Drivers
- 4.2.1 Rise of Hybrid and Asynchronous Work Models
- 4.2.2 Accelerating SaaS Procurement Cycles Among SMBs
- 4.2.3 Generative-AI Plug-ins Boosting Productivity per User
- 4.2.4 Growing Focus on Employee-Experience (EX) Platforms
- 4.2.5 In-App Workflow Automation Reducing Context Switching
- 4.2.6 Collaboration Analytics Quantifying Knowledge-Worker ROI
- 4.3 Market Restraints
- 4.3.1 Shadow-IT and Multi-Tool Sprawl Inflating CIO TCO
- 4.3.2 Rising Data-Sovereignty and Residency Mandates
- 4.3.3 Vendor Lock-in Concerns with Hyperscale Ecosystems
- 4.3.4 Escalating Privacy Lawsuits over Meeting Transcripts and Recordings
- 4.4 Industry Value-Chain Analysis
- 4.5 Regulatory Landscape
- 4.6 Technological Outlook
- 4.6.1 Generative-AI Integration Roadmap
- 4.7 Impact of Macroeconomic Factors on the Market
- 4.8 Porter's Five Forces Analysis
- 4.8.1 Bargaining Power of Suppliers
- 4.8.2 Bargaining Power of Buyers
- 4.8.3 Threat of New Entrants
- 4.8.4 Threat of Substitutes
- 4.8.5 Intensity of Competitive Rivalry
5 MARKET SIZE AND GROWTH FORECASTS (VALUE)
- 5.1 By Deployment Model
- 5.1.1 Cloud
- 5.1.2 On-Premise
- 5.1.3 Hybrid
- 5.2 By Organisation Size
- 5.2.1 Small and Medium Enterprises (SMEs)
- 5.2.2 Large Enterprises
- 5.3 By Software Type
- 5.3.1 Communication and Coordination Software
- 5.3.2 Conferencing Software
- 5.3.3 Project and Task Management Suites
- 5.3.4 Whiteboarding and Ideation Platforms
- 5.4 By Component
- 5.4.1 Software
- 5.4.2 Services
- 5.5 By End-User Industry
- 5.5.1 Information Technology and Telecom
- 5.5.2 Banking, Financial Services and Insurance (BFSI)
- 5.5.3 Healthcare and Life-Sciences
- 5.5.4 Education
- 5.5.5 Retail and E-Commerce
- 5.5.6 Government and Public Sector
- 5.6 By Geography
- 5.6.1 North America
- 5.6.1.1 United States
- 5.6.1.2 Canada
- 5.6.1.3 Mexico
- 5.6.2 South America
- 5.6.2.1 Brazil
- 5.6.2.2 Argentina
- 5.6.2.3 Rest of South America
- 5.6.3 Europe
- 5.6.3.1 Germany
- 5.6.3.2 United Kingdom
- 5.6.3.3 France
- 5.6.3.4 Russia
- 5.6.3.5 Rest of Europe
- 5.6.4 Asia-Pacific
- 5.6.4.1 China
- 5.6.4.2 India
- 5.6.4.3 Japan
- 5.6.4.4 South-East Asia
- 5.6.4.5 Rest of Asia-Pacific
- 5.6.5 Middle East
- 5.6.5.1 United Arab Emirates
- 5.6.5.2 Saudi Arabia
- 5.6.5.3 Rest of Middle East
- 5.6.6 Africa
- 5.6.6.1 South Africa
- 5.6.6.2 Rest of Africa
- 5.6.1 North America
6 COMPETITIVE LANDSCAPE
- 6.1 Market Concentration
- 6.2 Strategic Moves
- 6.3 Market Share Analysis
- 6.4 Company Profiles (includes Global Level Overview, Market Level Overview, Core Segments, Financials as available, Strategic Information, Market Rank/Share, Products and Services, Recent Developments)
- 6.4.1 Microsoft Corporation
- 6.4.2 Salesforce Inc. (Slack)
- 6.4.3 Google LLC (Workspace)
- 6.4.4 Atlassian Corporation PLC
- 6.4.5 Zoom Video Communications Inc.
- 6.4.6 Smartsheet Inc.
- 6.4.7 Asana Inc.
- 6.4.8 Cisco Systems Inc.
- 6.4.9 Zoho Corporation Pvt. Ltd.
- 6.4.10 Monday.com Ltd.
- 6.4.11 Wrike Inc.
- 6.4.12 TigerConnect Inc.
- 6.4.13 Huddle (Ninian Solutions Ltd.)
- 6.4.14 Notion Labs Inc.
- 6.4.15 ClickUp Inc.
- 6.4.16 Basecamp LLC
- 6.4.17 Miro Corporation
- 6.4.18 Airtable Inc.
- 6.4.19 Symphony Communication Services LLC
- 6.4.20 Cybozu Inc.
7 MARKET OPPORTUNITIES AND FUTURE OUTLOOK
- 7.1 White-Space and Unmet Need Analysis


