
|
시장보고서
상품코드
2066590
자동 3D 프린팅 시장 : 시장 점유율 분석, 업계 동향 및 통계, 성장 예측(2026-2031년)Automated 3D Printing - Market Share Analysis, Industry Trends & Statistics, Growth Forecasts (2026 - 2031) |
||||||
 Mordor Intelligence
Mordor Intelligence에 의하면, 자동 3D 프린팅 시장 규모는 2025년 29억 1,000만 달러로 평가되었고, 2026년에는 39억 9,000만 달러로 추정되고, 2026-2031년 CAGR 36.11%로 성장을 지속할 전망이며, 2031년에는 186억 4,000만 달러에 이를 것으로 예측됩니다.
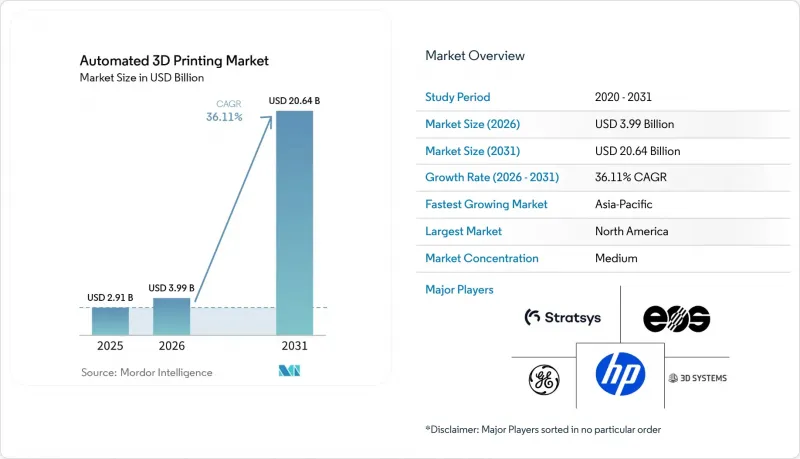
본 보고서는 제품군별(하드웨어, 소프트웨어, 서비스), 공정별(자동 생산, 자재관리, 부품 취급 등), 최종 사용자 산업별(산업 제조, 자동차, 항공우주 및 방위, 소비재 등), 용도별(시제품 제작, 최종 용도 부품 제조 등) 및 지역별로 분류되어 있습니다. 시장 전망은 금액(달러) 기준으로 제시되어 있습니다.
세계의 자동 3D 프린팅 시장 동향 및 인사이트
소프트웨어, 센서, AI의 융합이 ‘무인 공장’을 실현합니다.
실시간 열화상, 음향 모니터링 및 층별 형상 검사를 통해 결함이 확대되기 전에 감지할 수 있게 되어, 금속 분말 베드 방식 시스템에서 불량률을 최대 60%까지 줄이고 있습니다. 제조 실행 시스템(MES)은 설계 파일과 기계의 원격 측정 데이터 및 품질 기록을 연동하여, 수작업으로 작성하는 로그북 없이도 AS9100 및 ISO 13485를 준수하는 감사 추적을 생성합니다. 힘·토크 센서가 탑재된 협동 로봇이 90초 이내에 빌드 플레이트를 교체하기 때문에 1교대당 2명의 작업자가 필요 없어집니다. 미국의 주요 방위산업체들은 이미 CMMC 2.0에 기반한 디지털 스레드 준수를 의무화하고 있으며, 통합 소프트웨어 스택의 도입이 가속화되고 있습니다. 독일과 일본은 다축 플랫폼에 적층 성형 헤드를 통합한 하이브리드 기계의 설계를 선도하고 있는 반면, IEC 62443은 중소기업을 위한 보안 기준을 제시하고 있습니다.
대규모 대중 맞춤화에 대한 수요 증가
소비재 브랜드는 사출 성형으로는 구현할 수 없는 격자 구조를 활용하여 제품 주기를 18개월에서 6주로 단축하고 있습니다. 완전히 3D 프린팅된 신발은 조립 과정을 생략함으로써, 마이크로 팩토리가 며칠 이내에 지역별 동향에 대응할 수 있게 해줍니다. 의료 분야에서는 AI 플랫폼이 CT 스캔 데이터를 바탕으로 환자별로 최적화된 척추 케이지를 15분 만에 생성함으로써, 수술 계획 수립 시간을 단축하고 있습니다. 화장품 제조업체는 3D 프린팅을 통해 격자 구조의 어플리케이터를 제작함으로써, 재료 낭비를 30% 줄이면서도 사용자에게 맞춤형 촉감을 제공합니다. 스포츠 용품 분야에서는 규제상의 장벽이 낮아 도입이 가속화되고 있지만, 의료기기 분야에서는 ISO 10993 및 FDA 510(k) 요건을 충족해야 함에도 불구하고, 적층 가공 워크플로우의 유연성이 주는 이점을 누리고 있습니다.
높은 초기 설비 투자 비용
산업용 금속 프린터의 가격은 0.5-500만 달러로, 합리적인 리스 계약을 이용할 수 없는 중소기업에게는 진입 장벽이 되고 있습니다. EY의 2024년 조사에 따르면, 제조업체의 62%가 도입에 있어 가장 큰 장애물로 자금 문제를 꼽았습니다. 서비스 뷰로는 대차대조표에 미치는 부담을 줄이고 있으며, 한 대형 제공업체는 부품 단위 과금 모델을 통해 2024년 3분기에 1억 2,750만 달러의 추가 수익을 기록했습니다. 즉시 견적을 제공하는 온라인 마켓플레이스는 전년 대비 18.9%의 매출 성장을 기록하며, 자산 부담이 적은 조달에 대한 수요가 증가하고 있음을 보여주고 있습니다. 미국 중소기업청(SBA)과 유럽투자은행(EIB)이 제공하는 대출 프로그램은 금리를 낮춰주지만, 많은 기업들이 여전히 이러한 선택지를 잘 알지 못하고 있습니다.
부문별 분석
2025년, 하드웨어는 자동 3D 프린팅 시장 매출의 53.11%를 차지하며 가장 큰 점유율을 기록했습니다. 이는 멀티 레이저 방식의 파우더 베드 시스템 및 하이브리드 기계에 대한 투자를 반영한 것입니다. 그러나 현재는 설비 투자(Capex)를 운영 비용(OpEx)으로 전환하여, 고객이 기술의 노후화를 피할 수 있도록 지원하는 서비스 뷰로에 대한 수요가 증가하고 있습니다. 한 대형 온디맨드 공급업체는 2024년 3분기에 적층 가공 관련 매출로 1억 2,750만 달러를 기록하며, 단기 납기 부품에 대한 수요가 증가하고 있음을 여실히 보여주었습니다. 7,000개사의 인증 공급업체와 구매자를 연결해 주는 마켓플레이스에서는 견적이 몇 초 만에 처리되어 조달 주기가 단축될 뿐만 아니라, 생산 능력에 대한 접근성도 확대되고 있습니다.
소프트웨어, 소모품, 예측 유지보수를 다년 계약으로 묶은 구독형 번들 패키지의 성장에 힘입어, 서비스 시장은 2031년까지 연평균 성장률(CAGR) 37.21%를 기록하며 하드웨어 시장을 앞지를 것으로 전망됩니다. 시뮬레이션 스위트는 지지대 생성과 조형 방향 결정을 자동화하여, 생산 전 작업량을 50% 줄여줍니다. 기계 공급업체들은 원격 진단 및 실시간 모니터링 기능을 점점 더 많이 도입하고 있으며, 이를 통해 행정 업무를 최소화하면서도 ISO 9001 및 AS9100의 감사 요건을 충족하고 있습니다. 따라서 기업이 대차대조표에 과도한 부담을 주지 않고도 부품 생산량을 확대할 수 있기 때문에 3D 프린팅 서비스 시장 규모는 꾸준히 확대되고 있습니다.
2025년에는 자동 생산이 38.49%의 점유율을 차지하며 주류가 되었으나, 하이브리드 셀이 적층 성형, 절삭 가공, 열처리, 검사 작업 등 여러 제조 공정을 통합함에 따라 멀티 프로세싱은 연평균 37.35%라는 견실한 성장세를 보일 것으로 전망됩니다. 예를 들어, 5축 레이저 적층 플랫폼을 사용하면 한 번의 세팅만으로 터빈 블레이드 수리가 가능해져 공정 간 대기 시간을 사실상 없애고, 항공우주 분야의 금형 리드타임을 최대 60% 단축하고 있습니다. 또한, 소형 하이브리드 머신의 경우, 분말 베드 모듈과 12,000 rpm 스핀들을 결합하는 사례가 늘어나고 있어, 사출 성형 금형의 컨포멀 냉각 채널 가공 효율이 크게 향상되고 있습니다.
각 제조업체들이 금형의 당일 납품을 목표로 하는 가운데, 로봇을 활용한 부품 취급 시스템이 도입되어 300kg짜리 플레이트를 자율적으로 교체함으로써 업무 효율이 크게 향상되고 있습니다. 자동 분진 제거 시스템도 중요한 혁신 기술로 등장하여, 다품종 생산 환경에서 수작업에 소요되는 시간을 최대 70%까지 단축하고 있습니다. 또한, Hermle의 모듈식 팔레트 풀은 하이브리드형(적층 조형·절삭 가공) 셀과 원활하게 연동되도록 되어, 이를 통해 무인 가동 시간이 연장되었습니다. 그 결과, 자동 3D 프린팅 시장에서 변화가 나타나고 있으며, 공장이 물리적 설치 면적을 확대하지 않고도 처리량을 높이는 것을 목표로 하는 가운데, 멀티 프로세싱이 주목받고 있습니다.
지역별 분석
2025년, 북미는 자동 3D 프린팅 시장 매출의 34.83%를 차지했습니다. 5억 달러 상당의 연방 정부 보조금 덕분에 항공우주 분야의 인증 절차가 가속화되어, 인증 주기가 3년에서 18개월로 단축되었습니다. 보잉과 록히드 마틴은 2027년까지 국내 조달 비율 70%를 확보하기 위해 사내 금속 분말 베드 방식 3D 프린터의 도입을 확대했습니다. 캐나다는 몬트리올의 클러스터에 5,000만 캐나다 달러(3,700만 달러)를 투자한 반면, 멕시코에서는 니어쇼어링을 추진함으로써 48시간 이내에 자동차용 금형을 납품할 수 있는 하이브리드 셀이 도입되었습니다.
아시아태평양은 2031년까지 연평균 성장률(CAGR) 36.78%를 기록하며 성장할 것으로 전망됩니다. 인도의 국가 전략에서는 IIT(인도공과대학) 내 티타늄 및 니켈 분말 연구 거점에 자금을 지원하고 있으며, 한국의 K-AM 이니셔티브에서는 조선용 하이브리드 기술에 1억 5,000만 달러를 투자하고 있습니다. 또한, 중국의 각 OEM 기업들은 항공우주용 소재 공급 부족에도 불구하고 2025년에는 해당 지역의 하드웨어 판매의 40%를 차지했습니다. 일본의 주요 공작기계 기업들은 지향성 에너지 적층(DED) 기술을 다축 가공과 통합하고 있으며, 호주의 방위군은 현장 수리를 위해 필드 프린터를 도입하는 등, 지역 전반에 걸쳐 다양한 도입 촉진요인이 나타나고 있습니다.
유럽은 ‘호라이즌 유럽’의 지원금과 각국의 독자적인 프로그램을 통해 계속해서 강력한 존재감을 유지하고 있습니다. 독일의 프라운호퍼 연구소는 지멘스, EOS, 트럼프와 제휴하여 디지털 트윈을 활용한 모니터링에 주력하고 있으며, EOS는 미국 고객에게 서비스를 제공하기 위해 텍사스주에 300만 달러를 투자했습니다. 프랑스의 합작 기업 AddUp은 터빈 부품을 공급하고 있으며, 영국의 캐터펄트 센터는 의료 및 에너지 분야에서의 응용을 가속화하고 있습니다. 중동 및 아프리카에서는 에너지 및 방위용 예비 부품의 현지 생산에 중점을 두고 있으며, 남미는 여전히 발전 단계에 있지만 분말 공급망이 성숙해짐에 따라 자동차 및 석유 부문에서 성장이 나타나고 있습니다.
기타 혜택 :
- 엑셀 형식 시장 예측(ME) 시트
- 3개월간의 애널리스트 지원
자주 묻는 질문
목차
제1장 서론
제2장 조사 방법
제3장 주요 요약
제4장 시장 구도
제5장 시장 규모 및 성장 예측
제6장 경쟁 구도
제7장 시장 기회 및 향후 전망
AJY 26.06.30According to Mordor Intelligence, the automated 3D printing market size is expected to grow from USD 2.91 billion in 2025 to USD 3.99 billion in 2026 and is forecast to reach USD 18.64 billion by 2031 at a 36.11% CAGR over 2026-2031.
This report is Segmented by Offering (Hardware, Software, and Services), Process (Automated Production, Material Handling, Part Handling, and More), End-User Vertical (Industrial Manufacturing, Automotive, Aerospace and Defense, Consumer Products, and More), Application (Prototyping, Manufacturing of End-Use Parts, and More), and Geography. The Market Forecasts are Provided in Terms of Value (USD).
Global Automated 3D Printing Market Trends and Insights
Software, Sensor and AI Convergence Enabling Lights-Out Factories
Real-time thermal imaging, acoustic monitoring, and layer-wise geometry checks now flag defects before they propagate, cutting scrap in metal powder-bed systems by up to 60%. Manufacturing execution systems link design files with machine telemetry and quality records, generating audit trails that satisfy AS9100 and ISO 13485 without manual logbooks. Collaborative robots equipped with force-torque sensors swap build plates in under 90 seconds, eliminating the need for two operators per shift. Large U.S. defense contractors already mandate digital-thread compliance under CMMC 2.0, accelerating the adoption of integrated software stacks.Germany and Japan lead hybrid machine design that embeds additive heads into multi-axis platforms, while IEC 62443 provides a security baseline for small and medium enterprises.
Rising Demand for Mass Customization at Scale
Consumer brands exploit lattice geometries that injection molding cannot match, compressing product cycles from 18 months to six weeks. Fully 3D-printed footwear eliminates assembly labor, letting micro-factories respond to regional trends within days. In healthcare, AI platforms generate patient-specific spinal cages from CT scans in 15 minutes, thereby shortening surgical planning time. Cosmetic firms print lattice applicators that reduce material waste by 30% while delivering a tailored tactile feel. Fewer regulatory hurdles in sporting goods speed adoption, whereas medical devices navigate ISO 10993 and FDA 510(k), but still benefit from the flexibility of additive workflows.
High Initial Capital Expenditure
Industrial metal printers cost USD 0.5-5 million, a hurdle for small enterprises that lack affordable leases. EY's 2024 survey found that 62% of manufacturers cited capital constraints as the top barrier to adoption. Service bureaus alleviate balance-sheet pressure; one leading provider booked USD 127.5 million in additional revenue in Q3 2024 on a pay-per-part model. Online marketplaces offering instant quotes posted 18.9% year-over-year sales growth, signaling demand for asset-light procurement. Lending programs from the U.S. Small Business Administration and the European Investment Bank reduce interest rates, yet many firms remain unaware of these options.
Other drivers and restraints analyzed in the detailed report include:
- Growth in Adoption of Robotics for Industrial Automation
- Corporate Net-Zero Commitments Driving Lightweight Parts
- Limited Qualified Materials Catalogue
For complete list of drivers and restraints, kindly check the Table Of Contents.
Segment Analysis
Hardware captured the largest slice of the Automated 3D Printing market revenue at 53.11% in 2025, reflecting investment in multi-laser powder-bed systems and hybrid machines. However, demand now tilts toward service bureaus that convert capex into opex, letting clients avoid technology obsolescence. A leading on-demand provider posted USD 127.5 million in additive sales in Q3 2024, highlighting growing demand for quick-turn parts. Marketplaces that match 7,000 qualified suppliers with buyers process quotes in seconds, shrinking procurement cycles and widening access to capacity.
Services are projected to outpace hardware at a 37.21% CAGR to 2031, underpinned by subscription bundles that wrap software, consumables, and predictive maintenance into multiyear contracts. Simulation suites automate support generation and build orientation, cutting pre-production labor by 50%. Machine vendors increasingly embed remote diagnostics and real-time monitoring, satisfying ISO 9001 and AS9100 audits with minimal paperwork. The Automated 3D Printing market size for services, therefore, expands steadily as firms scale part volumes without heavy balance-sheet exposure.
Automated production dominated in 2025 with a 38.49% share, yet multiprocessing is projected to expand at a robust 37.35% annually as hybrid cells integrate multiple manufacturing processes, including additive, subtractive, heat treatment, and inspection tasks. For instance, a five-axis laser deposition platform is now capable of repairing turbine blades in a single setup, effectively eliminating inter-operation queues and reducing aerospace tooling lead times by up to 60%. Additionally, compact hybrid machines are increasingly combining powder-bed modules with 12,000-rpm spindles, enabling the machining of conformal cooling channels in injection molds with greater efficiency.
As manufacturers strive to achieve one-day tool delivery, robotic part-handling systems are being deployed to autonomously swap 300-kilogram plates, significantly enhancing operational efficiency. Automated depowdering systems have also emerged as a critical innovation, cutting manual touch time by up to 70% in high-mix production environments. Furthermore, Hermle's modular pallet pools now seamlessly interface with hybrid additive-subtractive cells, thereby increasing unmanned operational hours. Consequently, the Automated 3D Printing market is witnessing a shift, with multiprocessing gaining traction as factories aim to boost throughput without expanding their physical footprint.
Complete Report Scope:
- By Offering
- Hardware
- Software
- Services
- By Process
- Automated Production
- Material Handling
- Part Handling
- Post-Processing
- Multiprocessing
- By End-user Vertical
- Industrial Manufacturing
- Automotive
- Aerospace and Defense
- Consumer Products
- Healthcare
- Energy
- Rest of End-user Verticals
- By Application
- Prototyping
- Manufacturing of End-use Parts
- Tooling
- Rest of Applications
- By Geography
- North America
- United States
- Canada
- Mexico
- South America
- Brazil
- Argentina
- Rest of South America
- Europe
- Germany
- United Kingdom
- France
- Italy
- Spain
- Russia
- Rest of Europe
- Asia-Pacific
- China
- Japan
- India
- South Korea
- Australia and New Zealand
- Rest of Asia-Pacific
- Middle East
- Saudi Arabia
- United Arab Emirates
- Turkey
- Rest of Middle East
- Africa
- South Africa
- Nigeria
- Rest of Africa
- North America
Geography Analysis
North America accounted for 34.83% of the Automated 3D Printing market revenue in 2025. Federal grants worth USD 500 million accelerate aerospace qualification, compressing certification cycles from three years to 18 months. Boeing and Lockheed Martin expanded in-house metal powder-bed fleets to ensure 70% domestic sourcing by 2027. Canada invested CAD 50 million (USD 37 million) in a Montreal cluster, while Mexico's nearshoring push installs hybrid cells that deliver automotive tooling within 48 hours.
Asia-Pacific is forecast to grow at 36.78% CAGR through 2031. India's National Strategy funds titanium and nickel powder hubs at IITs, South Korea's K-AM Initiative directs USD 150 million to shipbuilding hybrids, and Chinese OEMs captured 40% of regional hardware sales in 2025 despite aerospace material bottlenecks. Japan's machine-tool giants integrate directed energy deposition with multi-axis machining, and Australian defense units deploy field printers for on-site repairs, illustrating diverse adoption drivers across the region.
Europe maintains a strong footprint through Horizon Europe grants and national programs. German Fraunhofer institutes collaborate with Siemens, EOS, and Trumpf on digital-twin monitoring, while EOS invested USD 3 million in Texas to serve U.S. clients. French joint venture AddUp supplies turbine components, and the United Kingdom's Catapult centers accelerate medical and energy applications. The Middle East and Africa focus on energy and defense spare-parts localization, and South America remains nascent but grows in automotive and oil sectors as powder supply chains mature.
- Stratasys Ltd
- 3D Systems Corporation
- General Electric Company
- EOS GmbH
- HP Inc.
- Desktop Metal Inc.
- SLM Solutions Group AG
- The ExOne Company
- Materialise NV
- Universal Robots AS
- ABB Ltd
- Formlabs Inc.
- PostProcess Technologies Inc.
- Authentise Inc.
- Carbon Inc.
- Renishaw plc
- Siemens AG
- Coobx AG
- DWS Systems
- Additive Industries BV
Additional Benefits:
- The market estimate (ME) sheet in Excel format
- 3 months of analyst support
TABLE OF CONTENTS
1 INTRODUCTION
- 1.1 Study Assumptions and Market Definition
- 1.2 Scope of the Study
2 RESEARCH METHODOLOGY
3 EXECUTIVE SUMMARY
4 MARKET LANDSCAPE
- 4.1 Market Overview
- 4.2 Market Drivers
- 4.2.1 Increasing Investments in R&D
- 4.2.2 Growth in Adoption of Robotics for Industrial Automation
- 4.2.3 Rising Demand for Mass Customisation at Scale
- 4.2.4 Software, Sensor and AI Convergence Enabling Lights-Out Factories
- 4.2.5 Government Incentives for Localised Manufacturing and Reshoring
- 4.2.6 Corporate Net-Zero Commitments Driving Lightweight Parts
- 4.3 Market Restraints
- 4.3.1 High Initial Capital Expenditure
- 4.3.2 Limited Qualified Materials Catalogue
- 4.3.3 Inter-operability Issues Across Proprietary Platforms
- 4.3.4 Cyber-Physical Security Risks in Fully Automated Cells
- 4.4 Industry Supply-Chain Analysis
- 4.5 Impact of Macroeconomic Factors on the Market
- 4.6 Regulatory Landscape
- 4.7 Technological Outlook
- 4.8 Porter's Five Forces Analysis
- 4.8.1 Threat of New Entrants
- 4.8.2 Bargaining Power of Buyers
- 4.8.3 Bargaining Power of Suppliers
- 4.8.4 Threat of Substitute Products
- 4.8.5 Intensity of Competitive Rivalry
5 MARKET SIZE AND GROWTH FORECASTS (VALUE)
- 5.1 By Offering
- 5.1.1 Hardware
- 5.1.2 Software
- 5.1.3 Services
- 5.2 By Process
- 5.2.1 Automated Production
- 5.2.2 Material Handling
- 5.2.3 Part Handling
- 5.2.4 Post-Processing
- 5.2.5 Multiprocessing
- 5.3 By End-user Vertical
- 5.3.1 Industrial Manufacturing
- 5.3.2 Automotive
- 5.3.3 Aerospace and Defense
- 5.3.4 Consumer Products
- 5.3.5 Healthcare
- 5.3.6 Energy
- 5.3.7 Rest of End-user Verticals
- 5.4 By Application
- 5.4.1 Prototyping
- 5.4.2 Manufacturing of End-use Parts
- 5.4.3 Tooling
- 5.4.4 Rest of Applications
- 5.5 By Geography
- 5.5.1 North America
- 5.5.1.1 United States
- 5.5.1.2 Canada
- 5.5.1.3 Mexico
- 5.5.2 South America
- 5.5.2.1 Brazil
- 5.5.2.2 Argentina
- 5.5.2.3 Rest of South America
- 5.5.3 Europe
- 5.5.3.1 Germany
- 5.5.3.2 United Kingdom
- 5.5.3.3 France
- 5.5.3.4 Italy
- 5.5.3.5 Spain
- 5.5.3.6 Russia
- 5.5.3.7 Rest of Europe
- 5.5.4 Asia-Pacific
- 5.5.4.1 China
- 5.5.4.2 Japan
- 5.5.4.3 India
- 5.5.4.4 South Korea
- 5.5.4.5 Australia and New Zealand
- 5.5.4.6 Rest of Asia-Pacific
- 5.5.5 Middle East
- 5.5.5.1 Saudi Arabia
- 5.5.5.2 United Arab Emirates
- 5.5.5.3 Turkey
- 5.5.5.4 Rest of Middle East
- 5.5.6 Africa
- 5.5.6.1 South Africa
- 5.5.6.2 Nigeria
- 5.5.6.3 Rest of Africa
- 5.5.1 North America
6 COMPETITIVE LANDSCAPE
- 6.1 Market Concentration
- 6.2 Strategic Moves
- 6.3 Market Share Analysis
- 6.4 Company Profiles (includes Global Level Overview, Market Level Overview, Core Segments, Financials as available, Strategic Information, Market Rank/Share, Products and Services, Recent Developments)
- 6.4.1 Stratasys Ltd
- 6.4.2 3D Systems Corporation
- 6.4.3 General Electric Company
- 6.4.4 EOS GmbH
- 6.4.5 HP Inc.
- 6.4.6 Desktop Metal Inc.
- 6.4.7 SLM Solutions Group AG
- 6.4.8 The ExOne Company
- 6.4.9 Materialise NV
- 6.4.10 Universal Robots AS
- 6.4.11 ABB Ltd
- 6.4.12 Formlabs Inc.
- 6.4.13 PostProcess Technologies Inc.
- 6.4.14 Authentise Inc.
- 6.4.15 Carbon Inc.
- 6.4.16 Renishaw plc
- 6.4.17 Siemens AG
- 6.4.18 Coobx AG
- 6.4.19 DWS Systems
- 6.4.20 Additive Industries BV
7 MARKET OPPORTUNITIES AND FUTURE OUTLOOK
- 7.1 White-Space and Unmet-need Assessment