
|
시장보고서
상품코드
2066708
전기 트럭 : 시장 점유율 분석, 업계 동향 및 통계, 성장 예측(2026-2031년)Electric Truck - Market Share Analysis, Industry Trends & Statistics, Growth Forecasts (2026 - 2031) |
||||||
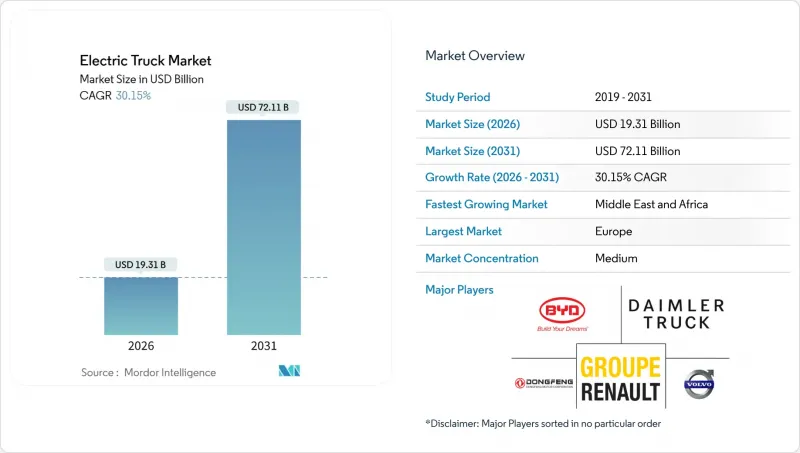
Mordor Intelligence에 의하면, 전기 트럭 시장 규모는 2026년에 193억 1,000만 달러에 달할 것으로 예상됩니다. 예측 기간(2026-2031년) CAGR 30.15%로 성장해 2031년에는 721억 1,000만 달러에 이를 전망입니다.
본 보고서는 구동 방식(BEV, FCEV, PHEV), 트럭 유형(소형, 중형, 대형, 트랙터 트레일러), 용도(물류, 지자체, 건설, 소매, 유틸리티), 주행 거리, 배터리용량, 모터 아키텍처 및 지역별로 분류되어 있습니다. 시장 전망은 금액(달러) 및 수량(대)으로 표시되어 있습니다.
세계의 전기 트럭 시장 동향 및 인사이트
배터리 팩 가격이 1kWh당 100달러 선을 밑돌았습니다.
최근 전기 트럭 시장에서 리튬 이온 배터리 팩의 가격이 대폭 하락했으며, 앞으로도 하락세가 이어질 것으로 예상되어 가까운 시일 내에 디젤 트랙터와 비용 면에서 동등한 수준에 도달할 것으로 전망됩니다. 이러한 가격 하락을 주도하고 있는 것은 중국의 셀 제조업체들로, 대량 생산되는 LFP(인산철리튬) 화학계 배터리에서 에너지 밀도의 현저한 향상을 실현하고 있습니다. 이로 인해 차량 운영 사업자의 경우, 중형 트럭의 도심 노선에서 투자 회수 기간이 단축되었으며, 기존보다 훨씬 길었던 차량 교체 주기가 대폭 단축되었습니다. 최근 캘리포니아주에서 사업을 전개하고 있는 펩시코는 자사의 테슬라 세미(Tesla Semi) 차량 군에서 디젤식 클래스 8 트랙터에 비해 마일당 에너지 비용이 대폭 감소했다고 보고했습니다. 또한, LFP는 신형 전기 트럭의 배터리용량 시장에서 큰 점유율을 차지하고 있으며, 사이클 수명 향상과 수명 주기 전반에 걸친 자본 집약도 감소를 입증하고 있습니다.
대형 차량에 대한 CO2 및 NOx 배출 규제 강화
2020년대 후반부터 유럽연합(EU)의 ‘유로 7’ 규제로 인해 전기 트럭 시장의 대형 차량 NOx 배출량이 대폭 감소하게 될 것입니다. 또한, EU는 21세기 중반까지 차량 전체의 CO2 배출량을 대폭 감축하도록 의무화하고 있습니다. 미국에서는 EPA의 ‘3단계’ 규정에 따라, 각 OEM 업체들은 향후 10년 이내에 신규 판매되는 클래스 8 트럭의 상당 부분을 무공해 차량으로 전환해야 합니다. 규정을 위반할 경우, 트랙터 1대당 막대한 벌금이 부과됩니다. 한편, 중국에서는 가까운 시일 내에 특정 중량 기준을 초과하는 모든 트럭에 ‘국가 VI-b’ 기준이 적용될 예정입니다. 또한, 금세기 말까지 도시 지역의 화물 운송에 따른 CO2 배출량에 대해 엄격한 제한이 설정되어 있습니다. 미래를 내다보는 노력의 일환으로, 볼보 그룹은 각 운송업체들이 유로 7 규정의 기한을 맞추기 위해 서둘러 대응을 진행하는 가운데, 올해 유럽 내 트럭 판매량의 상당 부분을 무공해 차량으로 판매했다고 보고했습니다. 규제 상황에 더해, ISO 14083에 따른 스코프 3 보고 의무화로 인해 기업의 조달 결정에 대한 규제 압박이 더욱 강화되고 있습니다.
메가와트급 충전 인프라의 부족
2026년, 전기 트럭 시장에서 전 세계적으로 운영 중인 메가와트급 충전 시스템(MCS) 충전소는 극히 소수에 불과하여, 차량 도입 속도에 비해 크게 뒤처지고 있습니다. 다임러와 볼보의 합작 회사는 2027년까지 다수의 고성능 충전소를 설치할 계획이지만, 이 정도로는 주요 화물 운송 노선의 극히 일부에만 대응할 수 있습니다. 미국에서는 연방 정부의 NEVI 기금으로부터 막대한 자금이 배정되었음에도 불구하고, 인허가 절차의 지연으로 인해 2025년 12월 시점에서 가동을 시작한 충전소는 극히 소수에 불과했습니다. 게다가, 발전소에서의 계통 연계 지연도 추가적인 지연의 원인이 되고 있습니다. 내셔널 그리드 ESO는 영국의 주요 물류 센터에서 계통 연계에 상당한 대기 시간이 발생하고 있음을 시사하고 있습니다. 그 결과, 운송 회사는 배터리 팩의 용량을 과도하게 설정할 수밖에 없게 되어, 단위 비용이 대폭 증가했습니다.
부문별 분석
2025년에는 도시 지역의 충전 네트워크가 성숙기에 접어들고, 하루 250km의 주행 주기를 확실하게 확보할 수 있게 된 것을 배경으로, 배터리식 전기 트럭의 점유율은 55.61%를 차지했습니다. 미국이 2030년까지 7개의 수소 허브에 자금을 지원하고, 200곳의 대형 트럭용 충전소 건설을 계획하고 있는 만큼, 연료전지 플랫폼 시장은 2031년까지 연평균 성장률(CAGR) 30.17%를 기록하며 성장할 전망입니다. 2024년, 니콜라사는 클래스 8 연료전지 트랙터 여러 대를 출시하며 장거리 운행이 가능한 차량에 대한 수요가 증가하고 있음을 여실히 보여주었습니다. 인프라가 제한적인 지역의 사업자들은 디젤을 이용한 백업 기능을 갖춘 플러그인 하이브리드 차량을 선호하는 추세입니다. 특히 주목할 만한 것은 볼보의 ‘FH Electric’ 하이브리드 모델로, 적당한 전기 주행 거리는 물론 디젤을 이용한 예비 주행 거리도 확보하고 있습니다. 캘리포니아주의 수소 가격은 에너지 패리티를 고려했을 때 여전히 디젤보다 훨씬 높은 수준이지만, 전해조 비용의 감소로 인해 금세기 말까지 가격이 크게 하락할 것으로 예측됩니다. 전기 트럭의 상황은 변화하고 있으며, 라스트 마일 배송에서는 배터리가 주도적인 역할을 하는 반면, 장거리 운송에서는 수소가 독자적인 입지를 다져가고 있습니다.
부수적인 요인들도 수소의 부상을 뒷받침하고 있습니다. 유럽의 운송업체들은 운전자의 근무 시간을 최적화하기 위해 신속한 연료 보급을 우선시하고 있으며, 다가오는 CO2 규제로 인해 무거운 배터리로 인한 적재량 감소에 대해 벌금이 부과될 우려가 있습니다. 중요한 진전으로, 다임러의 연료전지 프로토타입 ‘GenH2’는 2025년 말에 대규모 실증 주행을 성공적으로 완료하며 내구성에 대한 우려를 해소했습니다. 동시에, 리튬철인산염 기술의 발전으로 인해 단거리·대량 수송 노선에서 배터리 팩의 우위가 확고해졌으며, 활기 넘치는 도심 지역에서는 배터리식 전기자동차가 계속해서 중요한 역할을 수행할 것이 보장되고 있습니다.
2025년 전기 트럭 시장에서 12톤 이상의 대형 모델은 매출의 43.47%를 차지했으며, 캘리포니아주, 뉴욕주 및 EU가 2032년까지 클래스 8 트럭 판매 대수의 40-50%를 무공해 차량으로 전환할 것을 요구하고 있는 만큼, 2031년까지 연평균 성장률(CAGR) 30.19%를 기록할 전망입니다. 2025년 말까지 대용량 LFP 배터리 팩을 탑재하고 뛰어난 실제 주행 거리를 자랑하는 다임러의 ‘eActros 600’은 수많은 사전 주문을 확보했습니다. 중형 트럭 플랫폼은 지자체 및 도시 지역의 화물 운송 계약을 수주하고 있습니다. 2025년, BYD는 북미에서 입지를 다지며 상당수의 차량을 납품하는 한편, 도시 지역의 폐기물 수거 입찰에서 낙찰을 따냈습니다. 라스트 마일 배송에서 비용 경쟁력을 갖춘 소형 트럭 부문에서는 리비안의 ‘EDV-700’이 장거리 주행에서 인상적인 가동률을 달성했습니다. 장거리용 트랙터에 탑재된 대용량 배터리는 적재량 감소로 인해 적재 능력이 현저히 저하되지만, 그린 화물 프리미엄을 통해 손실된 적재량이 보충되므로 이러한 상충 관계는 허용 범위 내로 간주됩니다.
업계 관계자들은 다음 성장 동력으로 특수 용도의 틈새 시장에 주목하고 있습니다. 덤프트럭, 유틸리티 섀시, 소방차 등이 주목받고 있는데, 이는 이들 차량의 운행 주기가 거점에서의 충전 주기와 완벽하게 일치하기 때문입니다. 한편, 트랙터 트레일러의 구성에서는 가동 중지 시간을 최소화하기 위해 메가와트급 충전 기술 혁신이 추진되고 있습니다. 대형 트럭의 도입 속도가 다른 등급으로의 전기 트럭 시장 확대 추세를 좌우할 것으로 보입니다.
지역별 분석
2025년, 유럽은 유로 7 규제와 EU의 CO₂ 프레임워크에 기반한 통일된 규정 준수 방침에 힘입어 전기 트럭 시장에서 36.77%라는 높은 점유율을 차지했습니다. 그해 말까지 독일, 프랑스, 네덜란드에서는 고출력 충전기의 설치가 크게 진전되어, eActros 600이나 FH Electric과 같은 모델에 대해 충분한 충전 인프라가 확보되었습니다. 노르웨이에서는 통행료 면제나 구매 가격의 일부 지원과 같은 정책을 통해 제로 배출 트럭의 도입이 크게 촉진되었으며, 이는 신규 등록 대수에서 상당한 비중을 차지했습니다. 반면 영국에서는 송전망 연결에 시간이 오래 걸리는 탓에 차고지 전기화에 어려움이 발생했고, 강력한 인센티브가 마련되어 있었음에도 불구하고 대규모 차량 함대의 전환 속도가 더뎌졌습니다.
아시아태평양에서는 중국의 규제 체계와 보조금 프로그램에 따른 전기 트럭의 대규모 도입에 힘입어, 대수 면에서 유럽의 강력한 경쟁자로 부상하고 있습니다. 일본의 수소 인프라에 대한 막대한 투자는 히노 자동차의 연료전지 개발 계획을 뒷받침하고 있습니다. 한편, 인도에서는 보조금 프로그램이 종료됨에 따라 전기 트럭의 가격이 디젤 트럭에 비해 여전히 훨씬 비싸기 때문에 그 성장세가 주춤해졌습니다. 호주에서는 정부의 이니셔티브에 힘입어 물류센터용 충전기 설치에 대한 재정 지원이 이루어졌으며, 주간 화물 운송 시범 사업이 촉진되었습니다.
북미에서는 연방 정부의 인센티브에 더해, 향후 몇 년 동안 제로 배출 트럭의 판매 비율을 높여야 한다는 주 차원의 규제가 도입되어 그 혜택을 누리고 있습니다. 테슬라가 대기업에 전기 트럭을 납품한 것은 에너지 효율 측면에서 이러한 차량이 지닌 비용상의 이점을 부각시켰습니다. 캐나다의 재정적 인센티브 또한 주요 물류 노선에서의 전기 트럭 도입을 촉진하고 있습니다. 중동 및 아프리카은 대규모 수주와 제로 배출 상용차 함대에 대한 정부의 야심 찬 목표에 힘입어, 2031년까지의 전기 트럭 시장에서 연평균 성장률(CAGR) 30.23%라는 가장 높은 성장률을 기록하고 있습니다. 남아프리카에서는 수입 관세 도입안에 따른 잠재적인 문제가 있음에도 불구하고, 광산 현장에서 배터리 구동 트럭의 시범 운영이 진행되고 있습니다. 남미에서는 정책의 차이가 시장을 형성하고 있습니다. 브라질의 세제로 인해 차량 가격이 급등하고 있는 반면, 칠레의 광업용 차량에 대한 자금 지원이 해당 지역에서의 도입을 가속화하고 있습니다.
기타 혜택 :
- 엑셀 형식 시장 예측(ME) 시트
- 3개월간의 애널리스트 지원
자주 묻는 질문
목차
제1장 서론
제2장 조사 방법
제3장 주요 요약
제4장 주요 업계 동향
제5장 시장 구도
제6장 시장 규모 및 성장 예측
제7장 경쟁 구도
제8장 시장 기회 및 향후 전망
제9장 부록
제10장 CEO가 생각해야 할 중요 전략적 과제
KTH 26.06.29According to Mordor Intelligence, the electric truck market size is estimated at USD 19.31 billion in 2026, and is expected to reach USD 72.11 billion by 2031, at a CAGR of 30.15% during the forecast period (2026-2031).

This report is Segmented by Propulsion Type (BEV, FCEV, and PHEV), Truck Type (Light, Medium, Heavy, and Tractor-Trailer), Application (Logistics, Municipal, Construction, Retail, and Utility), Range, Battery Capacity, Motor Architecture, and Geography. Market Forecasts are in Value (USD) and Volume (Units).
Global Electric Truck Market Trends and Insights
Battery-Pack Price Declines Below USD 100/kWh Threshold
In recent years, lithium-ion pack prices have significantly decreased in the electric truck market and are expected to continue declining, reaching cost parity with diesel tractors in the near future. Chinese cell manufacturers have driven this reduction, achieving notable advancements in energy density with high-volume LFP chemistries. Fleet operators are now experiencing faster payback periods on medium-duty urban routes, significantly shortening replacement cycles that were historically much longer. Recently, PepsiCo's operations in California reported substantially lower energy costs per mile for its Tesla Semi fleet compared to diesel Class 8 tractors. Additionally, LFP has captured a significant share of new electric truck battery capacity, demonstrating improved cycle life and reduced lifetime capital intensity.
Tightening CO2 & NOx Emission Mandates for Heavy Vehicles
Starting in the late 2020s, the European Union's Euro 7 limits will significantly reduce heavy-duty NOx emissions in the electric truck market. Additionally, the EU mandates a substantial reduction in fleet-wide CO2 emissions by mid-century . In the U.S., the EPA's Phase 3 rule requires OEMs to ensure a significant portion of new Class 8 sales are zero-emission within the next decade. Non-compliance comes with a hefty financial penalty per tractor. Meanwhile, in China, the National VI-b standards will apply to all trucks over a specific weight threshold starting in the near future . Furthermore, a stringent limit on urban freight CO2 emissions is set for the end of the decade. In a proactive move, Volvo Group reported selling a notable percentage of its trucks as zero-emission in Europe during the current year, as fleets rushed to meet the Euro 7 deadline. Adding to the regulatory landscape, mandatory Scope 3 reporting under ISO 14083 tightens the grip of regulations on corporate procurement decisions.
Sparse Megawatt-Class Charging Infrastructure
By early 2026, only a limited number of Megawatt Charging System (MCS) stations were operational globally in the electric truck market, lagging significantly behind the rollout of vehicles. The Daimler-Volvo joint venture plans to establish a significant number of high-performance charging points by 2027, but this will only service a small portion of the primary freight corridors. In the U.S., while federal NEVI funds allocated substantial financial resources, only a few charging sites became operational by December 2025, hindered by permitting delays. Additionally, interconnections at depots are causing further setbacks; National Grid ESO has indicated extensive wait times for connections at major logistics centers in the U.K. As a result, fleets are overspecifying their battery packs, significantly increasing unit costs.
Other drivers and restraints analyzed in the detailed report include:
- Corporate Fleet-Decarbonization Pledges (Scope 3 Focus)
- Growing Green-Freight Contract Premiums from Shippers
- High Up-Front Vehicle Cost vs. Diesel in Emerging Markets
For complete list of drivers and restraints, kindly check the Table Of Contents.
Segment Analysis
Battery-electric trucks commanded a 55.61% share in 2025, underpinned by maturing urban charging networks and dependable 250 km daily cycles. Fuel-cell platforms are set for a 30.17% CAGR through 2031 as the United States funds seven hydrogen hubs with 200 heavy-truck stations planned by 2030. In 2024, Nikola rolled out several Class 8 fuel-cell tractors, highlighting a burgeoning demand for vehicles capable of extended-range duties. Operators in regions with limited infrastructure are gravitating towards plug-in hybrids, which offer a diesel backup. Notably, Volvo's FH Electric hybrid combines a moderate electric range with an additional diesel margin. While hydrogen prices in California remain significantly higher than diesel when adjusted for energy parity, declining electrolyzer costs hint at a potential substantial reduction by the end of the decade. The electric truck landscape is evolving, with batteries leading the charge in last-mile deliveries, while hydrogen is carving a niche in long-haul transport.
Secondary dynamics are bolstering hydrogen's rise. European transporters prioritize swift refueling to optimize driver hours, and looming CO2 regulations threaten penalties for payload reductions due to hefty batteries. In a significant move, Daimler's GenH2 fuel-cell prototype successfully completed an extensive pilot run in late 2025, addressing durability concerns. Concurrently, advancements in lithium-iron-phosphate technology are solidifying battery packs' dominance on high-volume routes with shorter distances, ensuring battery-electric vehicles remain pivotal in bustling urban settings.
Heavy-duty models above 12 tonnes represented 43.47% of revenue in 2025 in the electric truck market and will post a 30.19% CAGR through 2031 as California, New York, and the EU demand 40-50% zero-emission Class 8 sales by 2032. By late 2025, Daimler's eActros 600, equipped with a large-capacity LFP pack and boasting an extensive real-world range, garnered significant pre-orders. Platforms in the medium-duty range are securing municipal and urban freight contracts; in 2025, BYD made a mark in North America, delivering a substantial number of units and clinching city waste-collection tenders. Light trucks, benefiting from a cost edge in last-mile services, saw Rivian's EDV-700 achieve impressive uptime over an extensive distance. While the large-capacity batteries on long-haul tractors impose a noticeable reduction in capacity due to payload penalties, the trade-off is deemed acceptable as green-freight premiums compensate for the lost tonnage.
Industry players are eyeing vocational niches as the next frontier. Tipper bodies, utility chassis, and fire-service rigs are in the spotlight, due to their duty cycles syncing perfectly with depot charging. Meanwhile, tractor-trailer setups are pursuing megawatt charging innovations to minimize downtime. The pace of heavy-duty adoption is poised to dictate the trajectory of the electric truck market's expansion into other classes.
Geography Analysis
In 2025, Europe held a significant share of the electric truck market with 36.77%, supported by the unified compliance signals of Euro 7 and the EU's CO2 framework. By the end of the year, Germany, France, and the Netherlands had made substantial progress in installing high-power chargers, ensuring adequate coverage for models like the eActros 600 and FH Electric. Norway's policies, including toll exemptions and partial funding of purchase prices, significantly boosted the adoption of zero-emission trucks, which formed a notable portion of new registrations. In contrast, the U.K. faced challenges with depot electrification due to prolonged grid connection timelines, which slowed the transition for large fleets despite the availability of strong incentives.
Asia Pacific, driven by China's large-scale deployment of electric trucks under its regulatory framework and subsidy programs, is emerging as a strong competitor to Europe in terms of volume. Japan's substantial investment in hydrogen infrastructure supports Hino's fuel-cell development plans. Meanwhile, India's momentum slowed following the expiration of its subsidy program, as the cost of electric trucks remained significantly higher than diesel alternatives. In Australia, government initiatives funded the installation of depot chargers, facilitating pilot projects for interstate freight operations.
North America benefits from federal incentives and state-level regulations mandating a higher share of zero-emission truck sales in the coming years. Tesla's delivery of electric trucks to major corporations highlighted the cost advantages of these vehicles in terms of energy efficiency. Canada's financial incentives have also encouraged the deployment of electric trucks along key logistics routes. The Middle East and Africa logs the fastest 30.23% CAGR through 2031 in the electric truck market, driven by large-scale orders and ambitious government targets for zero-emission commercial fleets. South Africa is testing battery-powered trucks in mining operations, despite potential challenges from proposed import duties. In South America, policy differences are shaping the market: Brazil's tax policies have increased vehicle prices, while Chile's funding for mining fleets is accelerating adoption in the region.
- BYD Auto Co. Ltd.
- Daimler Truck Holding AG
- Volvo Group
- Scania AB
- PACCAR Inc.
- Navistar International Corp.
- Isuzu Motors Ltd.
- Hino Motors Ltd.
- Dongfeng Motor Corporation
- Groupe Renault
- Tesla Inc.
- Nikola Corp.
- Rivian Automotive
- Hyundai Motor Co.
- Tata Motors Ltd.
- MAN Truck & Bus SE
- FAW Group
- Foton Motor
- Ashok Leyland
- Quantron AG
Additional Benefits:
- The market estimate (ME) sheet in Excel format
- 3 months of analyst support
TABLE OF CONTENTS
1 Introduction
- 1.1 Study Assumptions & Market Definition
- 1.2 Scope of the Study
2 Research Methodology
3 Executive Summary
4 Key Industry Trends
- 4.1 Urbanization, Population & Vehicle/Transit Demand
- 4.2 EV Penetration in Truck Market
- 4.3 Fuel vs Electricity Price Spread (Per km, ICE vs EV)
- 4.4 EV vs ICE Total Cost of Ownership (TCO) Gap
- 4.5 Financing & Ownership Models (Loans, Leasing, Subscription)
- 4.6 Battery Chemistry Mix & Pack Energy Density (LFP vs NMC etc.)
- 4.7 Home, Workplace & Public Charger Access / Density
- 4.8 Fast-Charging Network Coverage & Power Bands
- 4.9 Alternative Fuels Infrastructure (Hydrogen for FCEVs)
- 4.10 Subsidy & Consumer Incentive Value (Purchase, Tax, Toll/Parking Benefits)
- 4.11 OEM EV Line-up & Model Pipeline
- 4.12 Value-Chain & Distribution-Channel Analysis
- 4.13 Regulatory, Fiscal & Industrial Policy Framework
5 Market Landscape
- 5.1 Market Overview
- 5.2 Market Drivers
- 5.2.1 Battery-Pack Price Declines Below USD 100/Kwh Threshold
- 5.2.2 Tightening CO2 & NOX Emission Mandates for Heavy Vehicles
- 5.2.3 Corporate Fleet-Decarbonization Pledges (Scope 3 Focus)
- 5.2.4 Growing "Green-Freight" Contract Premiums from Shippers
- 5.2.5 Dynamic Wireless Charging Pilots on Key Logistics Corridors
- 5.2.6 Expanded Mining-Site Electrification Grants in Latam
- 5.3 Market Restraints
- 5.3.1 Sparse Megawatt-Class Charging Infrastructure
- 5.3.2 High Up-Front Vehicle Cost Vs Diesel in Emerging Markets
- 5.3.3 Grid-Connection Delays at Large Depot Sites
- 5.3.4 Nickel & Manganese Supply-Chain Volatility
- 5.4 Value / Supply-Chain Analysis
- 5.5 Regulatory Landscape
- 5.6 Technological Outlook
- 5.7 Porter's Five Forces
- 5.7.1 Competitive Rivalry
- 5.7.2 Threat of New Entrants
- 5.7.3 Threat of Substitutes
- 5.7.4 Bargaining Power of Suppliers
- 5.7.5 Bargaining Power of Buyers
6 Market Size & Growth Forecasts (Value (USD) and Volume (Units))
- 6.1 By Propulsion Type
- 6.1.1 Battery-Electric (BEV)
- 6.1.2 Fuel-Cell Electric (FCEV)
- 6.1.3 Plug-in Hybrid (PHEV)
- 6.2 By Truck Type
- 6.2.1 Light Truck (Less than or equal to 3.5 t GVW)
- 6.2.2 Medium-Duty Truck (3.6-12 t)
- 6.2.3 Heavy-Duty Truck (More than 12 t)
- 6.2.4 Tractor-Trailer
- 6.3 By Application
- 6.3.1 Logistics & Parcel
- 6.3.2 Municipal Services (Waste, Street-sweep)
- 6.3.3 Construction & Mining
- 6.3.4 Retail & FMCG Delivery
- 6.3.5 Utility & Other Industrial
- 6.4 By Range
- 6.4.1 Less than 150 km
- 6.4.2 150 - 300 km
- 6.4.3 301 - 500 km
- 6.4.4 More than 500 km
- 6.5 By Battery Capacity
- 6.5.1 Less than 150 kWh
- 6.5.2 150 - 300 kWh
- 6.5.3 301 - 500 kWh
- 6.5.4 More than 500 kWh
- 6.6 By Motor Architecture
- 6.6.1 Single-Motor
- 6.6.2 Dual-Motor
- 6.6.3 Tri/Quad-Motor
- 6.7 By Region
- 6.7.1 North America
- 6.7.1.1 United States
- 6.7.1.2 Canada
- 6.7.1.3 Rest of North America
- 6.7.2 South America
- 6.7.2.1 Brazil
- 6.7.2.2 Argentina
- 6.7.2.3 Chile
- 6.7.2.4 Colombia
- 6.7.2.5 Rest of South America
- 6.7.3 Europe
- 6.7.3.1 Germany
- 6.7.3.2 France
- 6.7.3.3 United Kingdom
- 6.7.3.4 Italy
- 6.7.3.5 Spain
- 6.7.3.6 Netherlands
- 6.7.3.7 Norway
- 6.7.3.8 Sweden
- 6.7.3.9 Russia
- 6.7.3.10 Rest of Europe
- 6.7.4 Asia Pacific
- 6.7.4.1 China
- 6.7.4.2 Japan
- 6.7.4.3 India
- 6.7.4.4 South Korea
- 6.7.4.5 Australia
- 6.7.4.6 New Zealand
- 6.7.4.7 Indonesia
- 6.7.4.8 Thailand
- 6.7.4.9 Singapore
- 6.7.4.10 Rest of Asia Pacific
- 6.7.5 Middle East and Africa
- 6.7.5.1 Saudi Arabia
- 6.7.5.2 United Arab Emirates
- 6.7.5.3 Turkey
- 6.7.5.4 Israel
- 6.7.5.5 South Africa
- 6.7.5.6 Nigeria
- 6.7.5.7 Egypt
- 6.7.5.8 Kenya
- 6.7.5.9 Rest of Middle East and Africa
- 6.7.1 North America
7 Competitive Landscape
- 7.1 Market Concentration
- 7.2 Strategic Moves
- 7.3 Market Share Analysis
- 7.4 Company Profiles (includes Global Level Overview, Market Level Overview, Core Segments, Financials as Available, Strategic Information, Market Rank/Share for Key Companies, Products and Services, SWOT Analysis, and Recent Developments)
- 7.4.1 BYD Auto Co. Ltd.
- 7.4.2 Daimler Truck Holding AG
- 7.4.3 Volvo Group
- 7.4.4 Scania AB
- 7.4.5 PACCAR Inc.
- 7.4.6 Navistar International Corp.
- 7.4.7 Isuzu Motors Ltd.
- 7.4.8 Hino Motors Ltd.
- 7.4.9 Dongfeng Motor Corporation
- 7.4.10 Groupe Renault
- 7.4.11 Tesla Inc.
- 7.4.12 Nikola Corp.
- 7.4.13 Rivian Automotive
- 7.4.14 Hyundai Motor Co.
- 7.4.15 Tata Motors Ltd.
- 7.4.16 MAN Truck & Bus SE
- 7.4.17 FAW Group
- 7.4.18 Foton Motor
- 7.4.19 Ashok Leyland
- 7.4.20 Quantron AG
8 Market Opportunities & Future Outlook
- 8.1 White-space & Unmet-Need Assessment
9 Appendix
- 9.1 Global Overview
- 9.2 Porter's Five Forces Framework (detailed tables)
- 9.3 Global Value-Chain Analysis
- 9.4 Market Dynamics (Detailed DROs)
- 9.5 Sources & References
- 9.6 List of Tables & Figures
- 9.7 Primary Insights
- 9.8 Data Pack
- 9.9 Glossary of Terms
