
|
시장보고서
상품코드
2066709
상용차 시장 : 시장 점유율 분석, 업계 동향 및 통계, 성장 예측(2026-2031년)Commercial Vehicles - Market Share Analysis, Industry Trends & Statistics, Growth Forecasts (2026 - 2031) |
||||||
 Mordor Intelligence
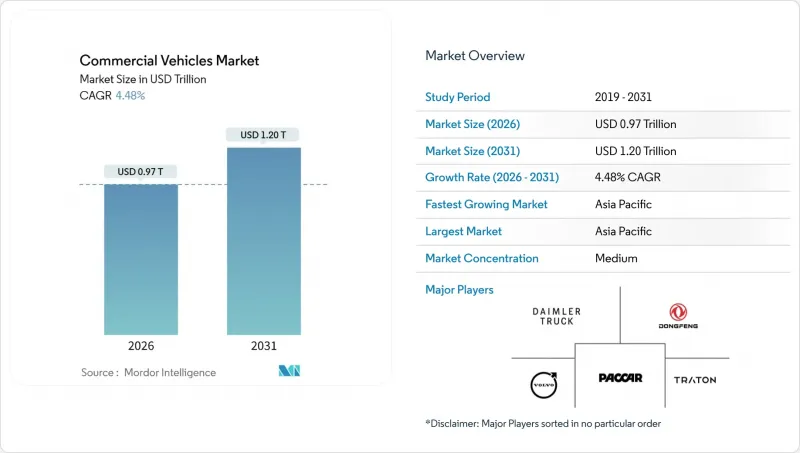
Mordor Intelligence에 의하면, 상용차 시장 규모는 2026년에 9,700억 달러로 추정되고, 2031년까지 1조 2,000억 달러로 확대될 것으로 예측되며, 예측 기간 중 CAGR 4.48%로 성장할 전망입니다.
본 보고서는 차종별(버스, 대형 상용 트럭 등), 추진 방식별(하이브리드차 및 전기차, 내연기관), 차량 총중량별(클래스 1, 클래스 2 등), 최종 이용 산업별(물류 및 전자상거래, 건설 및 광업 등) 및 지역별로 분류되어 있습니다. 시장 전망은 금액(달러) 및 수량(대)으로 제시되어 있습니다.
세계의 상용차 시장 동향 및 인사이트
미국, EU, 중국의 CO2 및 NOx 배출 규제 강화
2024년 이후, 각국 정부는 엄격한 탄소 규제를 강화함으로써 OEM(자동차 제조업체)의 개발 기간을 단축시키고, 규정 준수 비용을 증가시켰습니다. 그러나 현재는 보조금과 세액 공제를 통해 제로 에미션 트럭의 총 소유 비용이 상쇄되고 있습니다. 미국 환경보호청(EPA)의 새로운 3단계 목표에 따르면, 2027년형 대형 차량의 CO2 배출량 감축이 의무화되어 있습니다. 한편, 유럽의 친환경 교통 회랑에는 일정 간격으로 메가와트급 충전기가 설치될 예정입니다. 중국에서는 대형 트럭에도 더 엄격한 배출 기준이 적용됨에 따라 NOx 배출량이 대폭 감소했으며, 기준을 충족하지 못하는 디젤 차량의 조기 폐차가 진행되고 있습니다. 캘리포니아주와 독일의 차량 운영 사업자들은 초기 인프라 구축에 따른 과제보다 규제의 명확성을 더 중요하게 여기며, 전기 트럭 구매를 위한 장기적인 노력을 추진하고 있습니다. 그 결과, 설비 투자에 대한 보조금이나 탄소 가격 책정과 같은 정책들이 상용차 시장의 성장을 뒷받침하고 있습니다.
전자상거래의 폭발적인 성장과 3PL의 확대로 인해 라스트 마일용 차량이 필요해지고 있습니다.
소포 처리량이 급증하여 창고 자동화 속도를 앞지르자, 물류 기업들은 특히 도시 지역의 무공해 구역에서 운행되는 소형 밴의 전기화를 피할 수 없게 되었습니다. 아마존은 2025년 말까지 북미 및 유럽 전역에 대규모 전기 밴 차량을 도입할 예정입니다. 한편, DHL은 향후 몇년내에 도시 지역 차량의 대부분을 전기차로 전환하는 것을 목표로 하고 있으며, 이를 위해 막대한 투자를 약속했습니다. 런던, 파리, 베이징 등의 도시에서는 출퇴근 시간대에 내연기관(ICE) 밴의 통행을 제한하는 디젤 규제가 도입되어 있으며, 이에 대응하기 위해 유럽에서는 도시 내 배송 차량으로 전기 밴이 점점 더 선호되는 선택지가 되고 있습니다. 미국에서는 교외의 장거리 노선이나 충전 인프라가 미비하다는 등의 이유로 도입이 지연되고 있지만, 로스앤젤레스와 뉴욕에서 진행된 시범 프로그램을 통해 거점에서의 충전이 일상적인 운행 주기를 효과적으로 뒷받침할 수 있음이 입증되었습니다. 이러한 동향은 상용차 시장에서 소형 전기 상용차에 대한 수요가 견조하게 확대되고 있음을 여실히 보여주고 있습니다.
5 MW 규모의 기지 충전기의 계통 연계 지연(24개월 이상)
전력 회사의 처리 지연으로 인해 차량의 전기화 일정이 늦어지고 있습니다. 영국에서는 계통 연계 신청에 상당한 지연이 발생하고 있습니다. 한편, 캘리포니아주에서는 대규모 프로젝트에서 대기 기간이 길어지는 사례가 빈번하게 발생하고 있습니다. 변전소 현대화 사업은 변압기 부족과 주택용 태양광 발전의 계통 연계에 우선순위를 두는 규제상의 순서로 인해 차질을 빚고 있습니다. 독일에서는 인프라 구축을 위한 공동 자금 지원이 가능하지만, 자금 지급 절차가 지연되고 있어 가까운 시일 내에 상황이 개선될 전망은 없습니다. 전력 회사가 승인 절차를 신속히 처리하거나 규제 당국이 우선 처리 제도를 마련하지 않는 한, 물류 센터의 전기화는 계속해서 지연될 것이며, 이는 상용차 시장의 단기적인 성장 가능성을 저해할 것입니다.
부문별 분석
대형 트럭의 경우, 2025년 판매 대수 점유율이 42.15%를 차지한 것으로 평가되었으며, 적재량 및 주행 거리 등의 제약으로 인해 메가와트급 충전기가 보급되기 전까지는 디젤 차량이 주류를 이어갈 것으로 보입니다. 중형 트럭은 인프라의 향방이 명확해질 때까지 기다리는 상황이며, 버스는 지자체의 예산이나 정치적 주기에 따라 좌우됩니다. 북미의 지방 지역에서는 픽업 트럭이 여전히 가솔린 차량이 주류를 이루고 있지만, 포드 F-150 라이트닝이나 리비안의 각 모델을 도입한 시범 운용 차량들은 유틸리티 및 건설 업계에서의 조기 전환을 시사하고 있습니다. 소형 상용차는 소포 운송량 증가와 도심 지역의 배기가스 규제의 영향으로 가장 빠르게 성장했습니다. 밴에는 150-200kWh의 배터리 팩이 필요하지만, 이는 대형 트럭보다 적은 양이며, 연료세가 부과되기 전이라도 3년이라는 투자 회수 기간을 실현하고 있습니다. 소형 밴 상용차 시장 규모는 연평균 성장률(CAGR) 6.24%로 확대될 전망이며, 이는 버스 및 중형 부문을 웃도는 성장 속도입니다.
유럽의 제로 배출 구역에서는 피크 시간대에 디젤 차량을 이용한 배송을 금지함으로써 밴 도입이 가속화되고 있으며, 보조금 덕분에 도시 지역에서의 운영에 따른 투자 회수 기간이 단축되고 있습니다. 북미에서는 장거리 노선이 주류를 이루고 있어 디젤 차량이 여전히 지배적이지만, 시범 운영 데이터를 분석한 결과, 거점에서의 충전을 통해 하루 주행 거리 요구 사항을 충족할 수 있음이 시사되고 있습니다. 대형 트럭의 성장은 배터리 비용의 추이와 주요 노선 주변의 충전 인프라에 대한 자금 조달 여부에 좌우되기 때문에 2031년까지는 밴이 상용차 시장의 확장을 이끄는 주역이 될 것입니다.
2025년 상용차 시장에서 내연기관 차량은 매출의 69.03%를 차지했으나, 하이브리드차 및 전기차는 연평균 성장률(CAGR) 8.33%를 기록하며 구조적인 재균형이 진행되고 있음을 보여주고 있습니다. 전동화의 선두를 달리고 있는 것은 배터리식 전기차이지만, 신중한 태도를 보이는 차량 소유자들에게는 플러그인 하이브리드차가 인프라 격차를 해소하는 역할을 하고 있습니다. 디젤 엔진은 니켈·몰리브덴 가격의 급등과 규제의 복잡화에 직면해 있어, 비용 면에서의 우위를 점차 잃어가고 있습니다. CNG는 집중 급유 체계가 갖춰진 쓰레기 수거차나 대중교통 차량에서 여전히 사용되고 있지만, 전기차의 총 소유 비용(TCO)이 낮아짐에 따라 그 성장세는 완만하게 그치고 있습니다. 가솔린 차량과 LPG 차량은 도시 지역의 규제 때문에 점차 존재감을 잃어가고 있습니다.
배터리식 전기차의 보급 현황은 지역에 따라 다릅니다. 중국과 유럽에서는 보조금 및 접근 규제로 인해 가장 빠르게 발전하고 있습니다. 북미에서는 도시 지역의 배송 업무에서 전기화가 진행되는 반면, 장거리 운송에서는 디젤이 여전히 사용되고 있습니다. 신흥 시장에서는 충전기의 보급을 기다리며 도입이 미뤄지고 있습니다. 장거리 운행용 연료전지의 시범 운영은 진전을 보이고 있지만, 높은 수소 비용이 규모 확대의 걸림돌이 되고 있습니다. 2031년까지의 추진 시스템 구성은 정책 시행 시기와 배터리 밀도 향상이라는 이정표에 따라 달라질 것이며, 이는 상용차 시장공급망을 재편하게 될 것입니다.
지역별 분석
아시아태평양은 2025년에 전 세계 매출의 46.25%를 차지했으며, 상용차 시장에서 전 세계 최고 수준인 연평균 성장률(CAGR) 7.74%를 나타낼 것으로 전망됩니다. 중국은 구매세 면제와 배터리 교체 네트워크 확충을 발판으로 삼아, BYD, SAIC 모터, 포톤 모터가 생산하는 120만 대의 전기 상용차 시장에서 주도적인 위치를 차지하고 있습니다. 인도에서는 FAME-II의 연장에 따라 주요 대도시권에서 소형 상용차의 전기화가 촉진되고 있는 반면, 일본과 한국은 대형 상용차용 수소 실증 사업에 주력하고 있습니다. 동남아시아는 중국의 조립 공장을 유치하고 있지만, 인프라 구축이 뒤처져 있어 보급이 제한되고 있습니다.
유럽은 독일의 대규모 충전소 구축 자금 지원과 제로 배출 구역 확대를 원동력으로 삼아 전진하고 있습니다. 프랑스와 영국에서는 디젤 밴의 도심 진입이 제한되어 있어, 밴의 전기화를 촉진하고 있는 한편, 도시 지역의 전력망에 부담을 주고 있습니다. 남유럽은 인프라와 재정적 여유 면에서 뒤처져 있지만, 2026년까지 시행될 인센티브 조치를 통해 그 격차를 줄이는 것을 목표로 하고 있습니다. 러시아는 제재의 영향으로 여전히 디젤차가 주류를 이루고 있으며, 혹독한 겨울 날씨로 인해 배터리 효율이 떨어지고 있습니다.
북미는 양극화되어 있습니다. 캘리포니아주와 북동부 지역에서는 제로 배출 규제가 추진되고 있는 반면, 중서부 지역에서는 장거리 운송에 여전히 디젤이 사용되고 있습니다. 캐나다 연방 정부의 리베이트 제도가 온타리오주와 퀘벡주에서의 도입을 뒷받침하고 있지만, 농촌 지역의 장거리 운송에서는 그 효과가 미미합니다. 브라질과 아르헨티나에서는 전기 버스 시범 운영이 진행되고 있지만, 충전 비용이 낮아질 때까지는 화물 운송의 대부분이 여전히 디젤 차량에 의존할 것입니다. 중동 및 아프리카에서는 물류 자유구역에 대한 초기 관심이 나타나고 있지만, 석유 경제와 미비한 인프라로 인해 실질적인 시장 점유율 전환이 지연되고 있습니다. 전반적으로 아시아태평양과 유럽이 상용차 시장의 성장을 주도할 것으로 보이며, 북미 및 신흥 지역은 2028년 이후에 이를 따라잡을 전망입니다.
기타 혜택 :
- 엑셀 형식 시장 예측(ME) 시트
- 3개월간의 애널리스트 지원
자주 묻는 질문
목차
제1장 서론
제2장 조사 방법
제3장 주요 요약
제4장 업계 주요 동향
제5장 시장 구도
제6장 시장 규모 및 성장 예측
제7장 경쟁 구도
제8장 시장 기회 및 향후 전망
제9장 CEO가 직면하는 중요 전략적 과제
AJY 26.06.30According to Mordor Intelligence, the commercial vehicles market size reached USD 0.97 trillion in 2026 and is projected to climb to USD 1.20 trillion by 2031, advancing at a 4.48% CAGR over the forecast period.
This report is Segmented by Vehicle Type (Buses, Heavy-Duty Commercial Trucks, and More), Propulsion Type (Hybrid and Electric Vehicles, Internal Combustion Engine), Gross Vehicle Weight Rating (Class 1, Class 2, and More), End-Use Industry (Logistics and E-Commerce, Construction and Mining, and More), and Geography. The Market Forecasts are Provided in Terms of Value (USD) and Volume (Units).
Global Commercial Vehicles Market Trends and Insights
Tightening CO2 and NOx Emission Limits in the United States, EU and China
After 2024, governments ramped up stringent carbon regulations, shortening OEM development timelines and increasing compliance expenses. However, subsidies and tax credits are now offsetting the total ownership costs for zero-emission trucks. The new EPA Phase 3 targets mandate reduced CO2 emissions for 2027 heavy-duty vehicle models. Meanwhile, Europe's clean-transport corridors are set to install megawatt chargers at regular intervals. In China, the extension of stricter emission standards to larger trucks has significantly reduced NOx emissions, leading to the premature retirement of non-compliant diesel units. Fleet operators in California and Germany have made long-term commitments to electric truck purchases, valuing regulatory clarity over the challenges of early infrastructure deployment. As a result, initiatives like subsidized capital expenditures and carbon pricing are propelling the commercial vehicles market upward.
Explosive E-commerce and 3PL Growth Requiring Last-mile Fleets
As parcel volumes surged, outpacing the pace of warehouse automation, logistics firms found themselves compelled to electrify their light-duty vans, especially those operating in urban zero-emission zones. Amazon has rolled out a substantial fleet of electric vans across North America and Europe by the end of 2025. Meanwhile, DHL has committed significant investments, aiming to electrify a majority of its urban fleet in the coming years. In response to municipal diesel restrictions in cities like London, Paris, and Beijing, which curtail peak-hour access for internal combustion engine (ICE) vans, electric vans are increasingly becoming a preferred choice for urban delivery vehicles in Europe. While the United States trails in adoption-attributed to its longer suburban routes and a sparse network of chargers-pilot programs in Los Angeles and New York have showcased that depot charging can effectively support daily operational cycles. These developments highlight a robust and growing demand for electrified light-duty vehicles in the commercial vehicles market.
Grid-connection Delays (Above 24 Months) for 5 MW Depot Chargers
Fleet electrification timelines are being stretched by utility backlogs. In the United Kingdom, connection requests face significant delays. Meanwhile, in California, larger projects often encounter extended waiting periods. Substation upgrades are hindered by transformer shortages and a regulatory sequence that prioritizes residential solar tie-ins. In Germany, while co-funding is available for infrastructure, the disbursement process is slow, with any relief not expected in the near term. Unless utilities expedite approvals or regulators enforce fast-track queues, depot electrification will continue to lag, dampening the near-term potential for the commercial vehicles market.
Other drivers and restraints analyzed in the detailed report include:
- Record Low Battery-pack USD/kWh Unlocking HD-truck Parity
- Megawatt-charging Corridor Pilots on I-5 and Rhine-Alpine
- Insurance-premium Spike for BEV Trucks in North America and EU (Above 35%)
For complete list of drivers and restraints, kindly check the Table Of Contents.
Segment Analysis
Heavy-duty trucks, despite a 42.15% 2025 volume share, shoulder payload and range constraints that keep diesel dominant until megawatt chargers proliferate. Medium-duty units await infrastructure clarity, while buses depend on municipal budgets and political cycles. Pick-up trucks remain mostly gasoline in rural North America, although pilot fleets featuring Ford F-150 Lightning and Rivian variants signal an early transition in utilities and construction. Light commercial vans grew fastest, propelled by parcel density and city-center emission rules. Vans require 150-200 kWh packs-less than those of heavy-duty trucks-supporting three-year payback horizons even before fuel levies. The commercial vehicles market size for light vans is set to expand at a 6.24% CAGR, outpacing bus and medium-duty segments.
European zero-emission zones accelerate van adoption by banning diesel deliveries during peak hours, and subsidies shorten payback in urban operations. North America's longer routes retain diesel dominance, yet pilot data suggest depot charging can sustain daily range needs. Heavy-duty truck growth hinges on battery-cost curves and corridor charging funding, meaning vans will be the workhorse of commercial vehicles market expansion through 2031.
Internal-combustion engines kept 69.03% of 2025 revenue in the commercial vehicles market, but hybrid and electric variants log an 8.33% CAGR, signaling structural rebalancing. Battery-electric leads electrification, while plug-in hybrids bridge infrastructure gaps for cautious fleets. Diesel engines face nickel-moly inflation and regulatory complexity, eroding cost advantages. CNG persists in refuse and transit fleets with central refueling, yet growth stays modest as electric TCO declines. Gasoline and LPG fade under urban restrictions.
Battery-electric uptake varies by region: China and Europe advance fastest via subsidies and access rules; North America electrifies urban delivery while preserving diesel for long haul; emerging markets delay until chargers proliferate. Fuel-cell pilots progress for long-range duty cycles, but high hydrogen costs stall scale-up. The propulsion mix through 2031 will pivot on policy timing and battery-density milestones, reshaping supply chains in the commercial vehicles market.
Geography Analysis
Asia-Pacific generated 46.25% of global revenue in 2025 and will post a 7.74% CAGR, the highest worldwide in the commercial vehicles market. China leads with 1.2 million electric commercial vehicles produced by BYD, SAIC Motor, and Foton Motor, benefiting from purchase-tax waivers and battery-swap corridors. India's FAME-II extensions spur light-duty electrification in top metros, while Japan and South Korea double down on hydrogen heavy-duty pilots. Southeast Asia attracts Chinese assembly plants, yet slower infrastructure roll-outs limit penetration.
Europe advances on the strength of Germany's significant charger fund and expanding zero-emission zones . France and the United Kingdom restrict diesel van access to city centers, boosting van electrification but straining urban grids. Southern Europe trails in infrastructure and fiscal leeway, though incentives through 2026 aim to narrow the gap. Russia remains mostly diesel amid sanctions, and harsh winters degrade battery efficiency.
North America is bifurcated: California and the Northeast push zero-emission mandates, while the Midwest keeps diesel for long haul. Canada's federal rebates spark adoption in Ontario and Quebec, yet rural distances mute impact. Brazil and Argentina pilot electric buses, but most freight stays diesel until charging costs fall. The Middle East and Africa show early interest in logistics free zones, but oil economies and nascent infrastructure delay meaningful share shifts. Collectively, Asia-Pacific and Europe will drive the commercial vehicles market expansion, while North America and emerging regions catch up post-2028.
- Daimler Truck AG
- Volvo Group
- PACCAR Inc.
- Traton SE
- Dongfeng Motor Corporation Ltd.
- Tata Motors Limited
- BYD Auto Co., Ltd.
- SAIC Motor Corporation Limited
- Ford Motor Company
- General Motors Company
- Toyota Motor Corporation
- Hyundai Motor Company
- Nissan Motor Co., Ltd.
- Mahindra & Mahindra Ltd.
- Renault Group
- Rivian Automotive Inc.
- Iveco Group N.V.
- Isuzu Motors Ltd.
- Beiqi Foton Motor Co., Ltd.
Additional Benefits:
- The market estimate (ME) sheet in Excel format
- 3 months of analyst support
TABLE OF CONTENTS
1 Introduction
- 1.1 Study Assumptions & Market Definition
- 1.2 Scope of the Study
2 Research Methodology
3 Executive Summary
4 Key Industry Trend
- 4.1 Urbanization, Population and Vehicle/Transit Demand
- 4.2 EV Penetration in Commercial Vehicle
- 4.3 Fuel vs Electricity Price Spread (Per km, ICE vs EV)
- 4.4 EV vs ICE Total Cost of Ownership (TCO) Gap
- 4.5 Financing and Ownership Models (Loans, Leasing, Subscription)
- 4.6 Battery Chemistry Mix and Pack Energy Density (LFP vs NMC etc.)
- 4.7 Home, Workplace and Public Charger Access / Density
- 4.8 Fast-Charging Network Coverage and Power Bands
- 4.9 Alternative Fuels Infrastructure (Hydrogen for FCEVs)
- 4.10 Subsidy and Consumer Incentive Value
- 4.11 OEM EV Line-up and Model Pipeline
- 4.12 Value-Chain and Distribution-Channel Analysis
- 4.13 Regulatory, Fiscal and Industrial Policy Framework
5 Market Landscape
- 5.1 Market Overview
- 5.2 Market Drivers
- 5.2.1 Tightening CO2 and NOx Emission Limits in the United States, EU and China
- 5.2.2 Explosive E-commerce and 3PL Growth Requiring Last-mile Fleets
- 5.2.3 Record Low Battery-pack USD/kWh Unlocking HD-truck Parity
- 5.2.4 Megawatt-charging Corridor Pilots on I-5 and Rhine-Alpine
- 5.2.5 Commercial Battery-swap Ecosystems Proven in China's Mining Hubs
- 5.2.6 OEM Battery-as-a-Service (BaaS) Subscription Rollout
- 5.3 Market Restraints
- 5.3.1 Grid-connection Delays (Above 24 Months) for 5 MW Depot Chargers
- 5.3.2 Insurance-premium Spike for BEV Trucks in North America and EU (Above 35%)
- 5.3.3 Residual-value Uncertainty for First-gen Electric HD Trucks
- 5.3.4 Rising Nickel and Moly Surcharges Inflating Diesel Powertrain Costs
- 5.4 Value / Supply-Chain Analysis
- 5.5 Regulatory Landscape
- 5.6 Technological Outlook
- 5.7 Porter's Five Forces
- 5.7.1 Bargaining Power of Suppliers
- 5.7.2 Bargaining Power of Buyers
- 5.7.3 Threat of New Entrants
- 5.7.4 Threat of Substitutes
- 5.7.5 Competitive Rivalry
6 Market Size & Growth Forecasts (Value (USD) and Volume (Units))
- 6.1 By Vehicle Type
- 6.1.1 Buses
- 6.1.2 Heavy-Duty Commercial Trucks
- 6.1.3 Medium-Duty Commercial Trucks
- 6.1.4 Light Commercial Pick-up Trucks
- 6.1.5 Light Commercial Vans
- 6.2 By Propulsion Type
- 6.2.1 Hybrid and Electric Vehicles
- 6.2.1.1 Battery Electric Vehicle (BEV)
- 6.2.1.2 Fuel Cell Electric Vehicle (FCEV)
- 6.2.1.3 Hybrid Electric Vehicle (HEV)
- 6.2.1.4 Plug-in Hybrid Electric Vehicle (PHEV)
- 6.2.2 Internal Combustion Engine (ICE)
- 6.2.2.1 Diesel
- 6.2.2.2 Compressed Natural Gas (CNG)
- 6.2.2.3 Gasoline
- 6.2.2.4 Liquefied Petroleum Gas (LPG)
- 6.2.1 Hybrid and Electric Vehicles
- 6.3 By Gross Vehicle Weight Rating (Tonnage Class)
- 6.3.1 Class 1 (Below 1.8 t)
- 6.3.2 Class 2 (1.8-3.5 t)
- 6.3.3 Class 3 (3.5-7.5 t)
- 6.3.4 Class 4 (7.5-16 t)
- 6.3.5 Class 5 (Above 16 t)
- 6.4 By End-Use Industry
- 6.4.1 Logistics and E-commerce
- 6.4.2 Construction and Mining
- 6.4.3 Public Transport
- 6.4.4 Utilities and Municipal Services
- 6.4.5 Others (Agriculture, Retail)
- 6.5 By Geography
- 6.5.1 North America
- 6.5.1.1 United States
- 6.5.1.2 Canada
- 6.5.1.3 Rest of North America
- 6.5.2 South America
- 6.5.2.1 Brazil
- 6.5.2.2 Argentina
- 6.5.2.3 Rest of South America
- 6.5.3 Europe
- 6.5.3.1 Germany
- 6.5.3.2 United Kingdom
- 6.5.3.3 France
- 6.5.3.4 Italy
- 6.5.3.5 Russia
- 6.5.3.6 Rest of Europe
- 6.5.4 Asia-Pacific
- 6.5.4.1 China
- 6.5.4.2 India
- 6.5.4.3 Japan
- 6.5.4.4 South Korea
- 6.5.4.5 Rest of Asia-Pacific
- 6.5.5 Middle East and Africa
- 6.5.5.1 Saudi Arabia
- 6.5.5.2 United Arab Emirates
- 6.5.5.3 South Africa
- 6.5.5.4 Rest of the Middle East and Africa
- 6.5.1 North America
7 Competitive Landscape
- 7.1 Market Concentration
- 7.2 Strategic Moves
- 7.3 Market Share Analysis
- 7.4 Company Profiles (includes Global Level Overview, Market Level Overview, Core Segments, Financials as Available, Strategic Information, Market Rank/Share for Key Companies, Products and Services, SWOT Analysis, and Recent Developments)
- 7.4.1 Daimler Truck AG
- 7.4.2 Volvo Group
- 7.4.3 PACCAR Inc.
- 7.4.4 Traton SE
- 7.4.5 Dongfeng Motor Corporation Ltd.
- 7.4.6 Tata Motors Limited
- 7.4.7 BYD Auto Co., Ltd.
- 7.4.8 SAIC Motor Corporation Limited
- 7.4.9 Ford Motor Company
- 7.4.10 General Motors Company
- 7.4.11 Toyota Motor Corporation
- 7.4.12 Hyundai Motor Company
- 7.4.13 Nissan Motor Co., Ltd.
- 7.4.14 Mahindra & Mahindra Ltd.
- 7.4.15 Renault Group
- 7.4.16 Rivian Automotive Inc.
- 7.4.17 Iveco Group N.V.
- 7.4.18 Isuzu Motors Ltd.
- 7.4.19 Beiqi Foton Motor Co., Ltd.
8 Market Opportunities & Future Outlook
- 8.1 White-space & Unmet-Need Assessment