
|
시장보고서
상품코드
2072447
액화천연가스(LNG) 벙커링 : 시장 점유율 분석, 업계 동향 및 통계, 성장 예측(2026-2031년)Liquefied Natural Gas (LNG) Bunkering - Market Share Analysis, Industry Trends & Statistics, Growth Forecasts (2026 - 2031) |
||||||
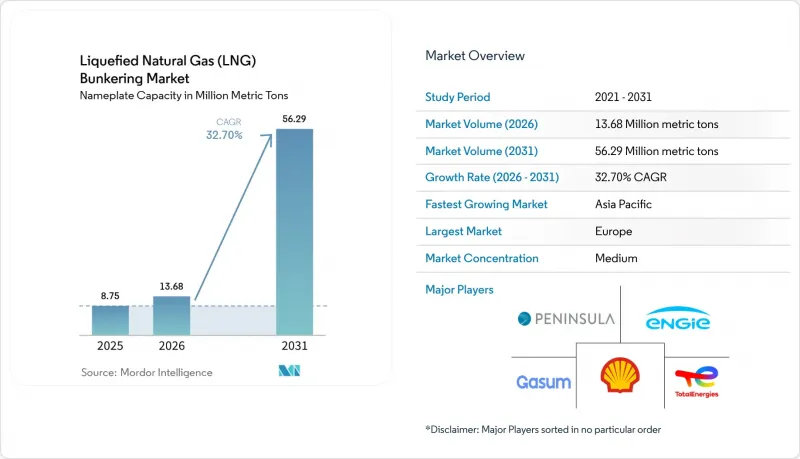
Mordor Intelligence에 의하면, 정격 용량 기반에서의 액화천연가스(LNG) 벙커링 시장 규모는 2025년에 875만 메트릭 톤으로 평가되었습니다. 2026년에는 1,368만 메트릭톤에 이르고, 2031년까지 5,629만 메트릭톤에 달할 것으로 전망되며, 2026년부터 2031년에 걸쳐 CAGR 32.70%를 나타낼 것으로 예측됩니다.

본 보고서는 최종 사용자별(유조선 함대, 컨테이너선 함대, 벌크선·일반 화물선 함대, 페리 및 OSV, 기타 최종 사용자) 및 지역별(북미, 유럽, 아시아태평양, 남미, 중동 및 아프리카)로 분류되어 있습니다. 시장 규모 및 전망은 수량(미터톤) 단위로 표시되어 있습니다.
세계의 액화천연가스(LNG) 벙커링 시장 동향 및 인사이트
IMO 2020년 황 함량 규제 대응 추진
2020년에 발효된 0.5%의 황 함량 상한선으로 인해 고황 연료유의 비용 측면에서의 우위는 사라졌으며, 선주들은 스크러버, 초저황 연료유 또는 LNG 중 하나를 선택할 수밖에 없게 되었습니다. 2024년까지 스크러버 사후 장착은 5,000척 전후로 안정화되었으나, 주요 허브 항구에서는 LNG가 VLSFO(초저유황 연료유)에 비해 1메트르톤당 150-250달러의 가격 우위를 유지했기 때문에 신조선 결정은 듀얼 연료 엔진 쪽으로 기울게 되었습니다. 2025년 싱가포르와 로테르담에서 항만국 검사가 강화됨에 따라, 규정 미준수 시 발생하는 비용이 증가했고, 이에 따라 LNG 대응 선박으로의 선단 현대화가 가속화되었습니다.
LNG 추진선 수주 잔고의 급증
선급협회의 자료에 따르면, 2024년 4월 운항 중인 LNG 추진선은 535척, 수주량은 509척이며, 그 용량의 절반 이상을 컨테이너선이 차지했습니다. CMA CGM사만 해도 77척의 LNG 추진선을 발주했으며, 2025년 중반까지 44척을 인도받았습니다. 대형 컨테이너선 수주가 집중되면서 예측 가능한 연료 수요라는 선순환이 형성되었고, 이것이 허브 항만의 추가적인 인프라 투자를 뒷받침하고 있습니다.
벙커선 및 육상 저장 탱크에 대한 막대한 설비 투자
7,500입방미터 규모의 벙커선 1척을 건조하는 데는 6,000만-7,500만 달러가 소요되며, 운항 비용은 연간 최대 800만 달러가 듭니다. 육상 저장 탱크에 대한 투자액은 1억 2,000만 달러를 초과하며, ISO 20519 및 IGF 코드에 따른 24개월에 걸친 인허가 절차가 필요하기 때문에 신흥 시장에서의 프로젝트가 지연되고 있습니다. 이러한 비용 장벽으로 인해, 2차 노선을 운항하는 사업자들은 주요 허브를 우회하거나 추가 연료를 적재해야 하는 상황에 처하게 되어, LNG의 경제적 우위가 훼손되고 있습니다.
부문별 분석
2025년 기준으로 컨테이너 선단의 운항은 LNG 벙커링 시장 규모의 39.7%를 차지했으며, 2031년까지 연평균 성장률(CAGR) 35.8%로 성장할 것으로 전망됩니다. CMA CGM이 보유한 44척의 운항 중인 LNG 추진선과 추가로 발주된 33척은 대형 해운사의 대규모 노력을 여실히 보여주고 있습니다. 장기 공급 계약 협상 및 허브 항구에서의 우선적인 부두 확보가 가능하다는 점이 LNG 도입의 기반이 되고 있습니다. 유조선 함대의 도입률은 신조선 계획의 2% 미만에 그치고 있습니다. 이는 용선사가 운임 프리미엄 지불을 꺼리고 있는 점과, 중동 및 서아프리카의 선적 터미널에 LNG 인프라가 갖춰져 있지 않은 것이 원인입니다. 벌크 화물 및 일반 화물 운송 사업자들도 이와 같은 과제에 직면해 있습니다. 연료 탱크 때문에 화물 적재 공간이 줄어들 뿐만 아니라, 운임 시장이 여전히 세분화되어 있기 때문입니다.
LNG 벙커링 시장은 아시아태평양 및 유럽 간 노선의 컨테이너 운송에 계속 의존하고 있으며, 싱가포르, 로테르담, 미국 멕시코만 연안의 인프라 집중 현상을 더욱 심화시키고 있습니다. 노르웨이의 페리와 해양 지원선은 전환 비용의 40%를 보전해 주는 보조금의 혜택을 받고 있는 반면, 크루즈 선사들은 지중해와 카리브해의 항만 도시들이 정한 대기질 규제를 충족하기 위해 LNG를 도입하고 있습니다. 향후 성장은 IMO가 2030년 및 2040년 탄소 집약도 목표를 충분히 강화할지, 그리고 투자를 메탄올이나 암모니아 쪽으로 전환할지에 따라 좌우될 것입니다. 초기 징후에 따르면, 컨테이너 선사들은 LNG에 대한 투자를 지속할 것으로 보입니다. 이는 네트워크의 운송량 덕분에 연료 가격 변동에 대한 헤지가 가능하며, 대규모 선단 전체를 통해 자본 비용을 상각할 수 있기 때문입니다.
지역별 분석
유럽은 2025년, 조기 규제 조치, 밀집된 근해 항로망, 그리고 유럽 대륙의 성숙한 육상 인프라에 힘입어 LNG 벙커링 시장 점유율의 72.4%를 차지했습니다. 2025년 중반까지 로테르담, 안트베르펜 및 스칸디나비아의 각 항구에서는 40척 이상의 선박에 대한 동시 급유가 가능해졌습니다. 독일 브룬스뷔텔과 빌헬름스하펜에 위치한 용도가 변경된 FSRU 터미널은 2024년에 LNG 벙커링 기능을 추가하여 발트해 및 북해 항로에 서비스를 제공했습니다. 2024년에는 유럽해상안전청(EMSA)의 지침이 개정되어 안전 프로토콜이 통일되고, 국경을 넘는 운항 절차가 간소화되었습니다.
아시아태평양은 싱가포르 제2터미널, 중국 저우산(舟山)의 확장, 그리고 한국의 전용 벙커선 배치에 힘입어 2031년까지 연평균 성장률(CAGR) 40.5%를 기록하며 성장할 것으로 전망됩니다. 싱가포르의 유조선 공급 능력은 2024년에 12척을 동시에 수용할 수 있는 규모로 확대되어, 말라카 해협을 통과하는 정기선의 운송량을 뒷받침하고 있습니다. 중국에서는 2025년 초, 저우산(舟山)에 위치한 3만 입방미터 규모의 육상 탱크가 가동을 시작하여, 국내 연안 피더선 및 벌크 화물 운송에 서비스를 제공합니다. 일본과 한국은 초기 투자를 줄이기 위해 육상 탱크보다 벙커선을 선호하고 있지만, 이 전략은 처리 능력에 한계가 있어 선단 확대에 따라 추가 자원이 필요할 가능성이 있습니다.
북미는 여전히 틈새 시장이며, 이 지역의 취급량 대부분은 미국 멕시코만 연안 지역이 차지하고 있습니다. 하비 걸프(Harvey Gulf)사는 해양 공급선 및 컨테이너 피더선을 위해 2척의 벙커선을 운항하고 있지만, 서부 해안 및 캐나다 항만에서는 보다 명확한 규제 체계가 마련되기를 기다리고 있는 상황입니다. 남미, 중동 및 아프리카의 2025년 취급량은 전체의 3% 미만에 그쳤습니다. 페트로브라스사는 국내 가스 가격 개혁이 실현될 때까지 산토스 항의 확장 공사를 일시 중단하고 있으며, 파나마에는 LNG 저장 시설이 없어 벙커유 수요는 미국 멕시코만 연안으로 흘러가고 있습니다. 카타르 에너지의 Q-LNG는 하마드 항에서의 운용을 목적으로 2025년에 벙커선 1척을 발주하여 2027년에 인도받을 예정이며, 이는 중동의 향후 성장 가능성을 시사하고 있습니다.
기타 혜택 :
- 엑셀 형식 시장 예측(ME) 시트
- 3개월간의 애널리스트 지원
자주 묻는 질문
목차
제1장 서론
제2장 조사 방법
제3장 주요 요약
제4장 시장 구도
제5장 시장 규모 및 성장 예측
제6장 경쟁 구도
제7장 시장 기회 및 향후 전망
KTHAccording to Mordor Intelligence, the liquefied natural gas bunkering market size in terms of nameplate capacity is projected to be 8.75 million metric tons in 2025, 13.68 million metric tons in 2026, and reach 56.29 million metric tons by 2031, growing at a CAGR of 32.70% from 2026 to 2031.
This report is Segmented by End User (Tanker Fleet, Container Fleet, Bulk and General Cargo Fleet, Ferries and OSV, and Other End-Users) and Geography (North America, Europe, Asia-Pacific, South America, and Middle East and Africa). The Market Sizes and Forecasts are Provided in Terms of Volume (Metric Tons).
Global Liquefied Natural Gas (LNG) Bunkering Market Trends and Insights
IMO 2020 Sulphur-Cap Compliance Push
The 0.5% sulfur cap that entered into force in 2020 eliminated the cost advantage of high-sulfur fuel oil, leaving owners with scrubbers, very-low-sulfur fuel oil, or LNG. Scrubber retrofits stabilized near 5,000 vessels by 2024, while LNG retained a USD 150-250 per metric-ton price edge over VLSFO in major hub ports, tipping newbuild decisions toward dual-fuel engines. Intensified port-state inspections in Singapore and Rotterdam during 2025 raised the cost of non-compliance, accelerating fleet renewal toward LNG-capable tonnage.
Rapid Growth in LNG-Powered Vessel Orderbook
Classification-society data showed 535 LNG-powered ships in service and 509 on order as of April 2024, with container ships accounting for over half of capacity. CMA CGM alone contracted 77 LNG-fueled vessels, taking delivery of 44 by mid-2025. The concentration of orders in large container units has created a virtuous loop of predictable fuel demand that underpins further infrastructure spending in hub ports.
High CAPEX for Bunkering Vessels and Shore Tanks
A 7,500 cubic-meter bunkering vessel demands USD 60-75 million to build and up to USD 8 million annually for operations. Shore-tank investments exceed USD 120 million and involve 24-month permitting under ISO 20519 and the IGF Code, which delays projects in emerging markets. This cost hurdle forces operators on secondary routes to detour to major hubs or carry additional fuel, eroding LNG's economic advantage.
Other drivers and restraints analyzed in the detailed report include:
- Expansion of Global LNG Bunkering Infrastructure
- Cost Competitiveness of LNG Versus Low-Sulphur Fuel Oils
- Methane-Slip and Life-Cycle GHG Concerns
For complete list of drivers and restraints, kindly check the Table Of Contents.
Segment Analysis
Container fleet operations accounted for 39.7% of the LNG bunkering market size in 2025 and are projected to grow at a 35.8% CAGR through 2031. CMA CGM's fleet of 44 operational LNG-powered vessels and 33 additional units on order illustrates the scale commitment by mega-carriers. The ability to negotiate long-term supply contracts and secure priority berths in hub ports underpins adoption. Tanker fleet uptake remains below 2% of the newbuild pipeline because charterers resist freight premiums, and loading terminals in the Middle East and West Africa lack LNG infrastructure. Bulk and general cargo operators face similar obstacles, as cargo-hold space is sacrificed to fuel tanks, and freight markets remain fragmented.
The LNG bunkering market continues to depend on container traffic along Asia-Europe and trans-Pacific corridors, reinforcing infrastructure concentration in Singapore, Rotterdam, and the U.S. Gulf. Ferries and offshore-support vessels in Norway benefit from subsidies that offset 40% of conversion costs, while cruise lines deploy LNG to meet port-city air-quality mandates in the Mediterranean and Caribbean. Future growth hinges on whether IMO tightens 2030 and 2040 carbon-intensity goals enough to tip investment toward methanol or ammonia. Early evidence suggests container carriers will maintain LNG commitments because network volume allows hedging against fuel-price swings and amortizing capital costs across large fleets.
Complete Report Scope:
- By End User
- Tanker Fleet
- Container Fleet
- Bulk and General Cargo Fleet
- Ferries and OSV
- Other End-Users
- By Geography
- North America
- United States
- Canada
- Mexico
- Europe
- Germany
- France
- Spain
- Italy
- Netherlands
- Sweden
- Belgium
- Russia
- Rest of Europe
- Asia-Pacific
- China
- Japan
- South Korea
- Singapore
- Malaysia
- Australia
- Rest of Asia-Pacific
- South America
- Brazil
- Panama
- Argentina
- Rest of South America
- Middle East and Africa
- United Arab Emirates
- Saudi Arabia
- Oman
- South Africa
- Egypt
- Rest of Middle East and Africa
- North America
Geography Analysis
Europe captured 72.4% of the LNG bunkering market share in 2025, supported by early regulatory moves, dense short-sea networks, and the continent's mature shore infrastructure. Rotterdam, Antwerp, and Scandinavian ports offered simultaneous bunkering for more than 40 vessels by mid-2025. Germany's repurposed FSRU terminals at Brunsbuttel and Wilhelmshaven added LNG bunkering capability in 2024, serving Baltic and North Sea routes. Updated European Maritime Safety Agency guidelines harmonized safety protocols and simplified cross-border operations in 2024.
Asia-Pacific is forecast to grow at a 40.5% CAGR through 2031, propelled by Singapore's second terminal, China's Zhoushan expansion, and South Korea's deployment of dedicated bunkering vessels. Singapore's bunkering capacity rose to 12 simultaneous operations in 2024, supporting liner volumes through the Malacca Strait. In China, Zhoushan's 30,000 cubic-meter shore tanks opened in early 2025, serving domestic coastal feeders and bulk trades. Japan and South Korea favor bunkering vessels over shore tanks to limit upfront capital, though this strategy caps throughput and may require additional assets as the fleet grows.
North America remains a niche, with the U.S. Gulf accounting for most regional volumes. Harvey Gulf operates two bunkering vessels serving offshore supply and container feeders, while West Coast and Canadian ports await clearer regulatory frameworks. South America and the Middle East & Africa contributed less than 3% of 2025 volumes. Petrobras paused expansion in Santos pending domestic gas-price reforms, and Panama lacks LNG storage, diverting bunkering demand to the U.S. Gulf. QatarEnergy's Q-LNG ordered a bunkering vessel in 2025 for delivery in 2027 to serve Hamad Port, signaling future growth potential in the Middle East.
- Shell plc
- TotalEnergies SE
- Gasum Oy
- ENGIE SA
- Peninsula Petroleum
- ENN Energy Holdings
- Korea Gas Corporation (KOGAS)
- Harvey Gulf International Marine
- Gazprom Neft PJSC
- Naturgy Energy Group
- Titan Clean Fuels
- Crowley Maritime Corp.
- CMA CGM SA
- MOL (LNG Solutions)
- NYK Line
- QatarEnergy (Q-LNG)
- ExxonMobil Marine Fuels
- Petronas Marine
- Bunker Holding A/S
- GTT (Gaztransport & Technigaz)
- Cryostar SAS
Additional Benefits:
- The market estimate (ME) sheet in Excel format
- 3 months of analyst support
TABLE OF CONTENTS
1 Introduction
- 1.1 Study Assumptions & Market Definition
- 1.2 Scope of the Study
2 Research Methodology
3 Executive Summary
4 Market Landscape
- 4.1 Market Overview
- 4.2 Market Drivers
- 4.2.1 IMO 2020 sulphur-cap compliance push
- 4.2.2 Rapid growth in LNG-powered vessel orderbook
- 4.2.3 Expansion of global LNG bunkering infrastructure
- 4.2.4 Cost competitiveness of LNG versus low-sulphur fuel oils
- 4.2.5 Emergence of e-methane enabling carbon-neutral LNG supply
- 4.2.6 Automation & digital-twin solutions improving bunkering safety
- 4.3 Market Restraints
- 4.3.1 High CAPEX for bunkering vessels & shore tanks
- 4.3.2 Volatility of LNG spot prices
- 4.3.3 Methane-slip and life-cycle GHG concerns
- 4.3.4 Rising investment shift toward methanol & ammonia bunkering
- 4.4 Supply-Chain Analysis
- 4.5 Regulatory Landscape
- 4.6 Technological Outlook
- 4.7 Porter's Five Forces
- 4.7.1 Bargaining Power of Suppliers
- 4.7.2 Bargaining Power of Buyers
- 4.7.3 Threat of New Entrants
- 4.7.4 Threat of Substitutes
- 4.7.5 Competitive Rivalry
5 Market Size & Growth Forecasts
- 5.1 By End User
- 5.1.1 Tanker Fleet
- 5.1.2 Container Fleet
- 5.1.3 Bulk and General Cargo Fleet
- 5.1.4 Ferries and OSV
- 5.1.5 Other End-Users
- 5.2 By Geography
- 5.2.1 North America
- 5.2.1.1 United States
- 5.2.1.2 Canada
- 5.2.1.3 Mexico
- 5.2.2 Europe
- 5.2.2.1 Germany
- 5.2.2.2 France
- 5.2.2.3 Spain
- 5.2.2.4 Italy
- 5.2.2.5 Netherlands
- 5.2.2.6 Sweden
- 5.2.2.7 Belgium
- 5.2.2.8 Russia
- 5.2.2.9 Rest of Europe
- 5.2.3 Asia-Pacific
- 5.2.3.1 China
- 5.2.3.2 Japan
- 5.2.3.3 South Korea
- 5.2.3.4 Singapore
- 5.2.3.5 Malaysia
- 5.2.3.6 Australia
- 5.2.3.7 Rest of Asia-Pacific
- 5.2.4 South America
- 5.2.4.1 Brazil
- 5.2.4.2 Panama
- 5.2.4.3 Argentina
- 5.2.4.4 Rest of South America
- 5.2.5 Middle East and Africa
- 5.2.5.1 United Arab Emirates
- 5.2.5.2 Saudi Arabia
- 5.2.5.3 Oman
- 5.2.5.4 South Africa
- 5.2.5.5 Egypt
- 5.2.5.6 Rest of Middle East and Africa
- 5.2.1 North America
6 Competitive Landscape
- 6.1 Market Concentration
- 6.2 Strategic Moves (M&A, Partnerships, PPAs)
- 6.3 Market Share Analysis (Market Rank/Share for key companies)
- 6.4 Company Profiles (includes Global level Overview, Market level overview, Core Segments, Financials as available, Strategic Information, Products & Services, and Recent Developments)
- 6.4.1 Shell plc
- 6.4.2 TotalEnergies SE
- 6.4.3 Gasum Oy
- 6.4.4 ENGIE SA
- 6.4.5 Peninsula Petroleum
- 6.4.6 ENN Energy Holdings
- 6.4.7 Korea Gas Corporation (KOGAS)
- 6.4.8 Harvey Gulf International Marine
- 6.4.9 Gazprom Neft PJSC
- 6.4.10 Naturgy Energy Group
- 6.4.11 Titan Clean Fuels
- 6.4.12 Crowley Maritime Corp.
- 6.4.13 CMA CGM SA
- 6.4.14 MOL (LNG Solutions)
- 6.4.15 NYK Line
- 6.4.16 QatarEnergy (Q-LNG)
- 6.4.17 ExxonMobil Marine Fuels
- 6.4.18 Petronas Marine
- 6.4.19 Bunker Holding A/S
- 6.4.20 GTT (Gaztransport & Technigaz)
- 6.4.21 Cryostar SAS
7 Market Opportunities & Future Outlook
- 7.1 White-space & Unmet-Need Assessment


