
|
시장보고서
상품코드
2072464
LNG 운반선 : 시장 점유율 분석, 업계 동향 및 통계, 성장 예측(2026-2031년)LNG Carriers - Market Share Analysis, Industry Trends & Statistics, Growth Forecasts (2026 - 2031) |
||||||
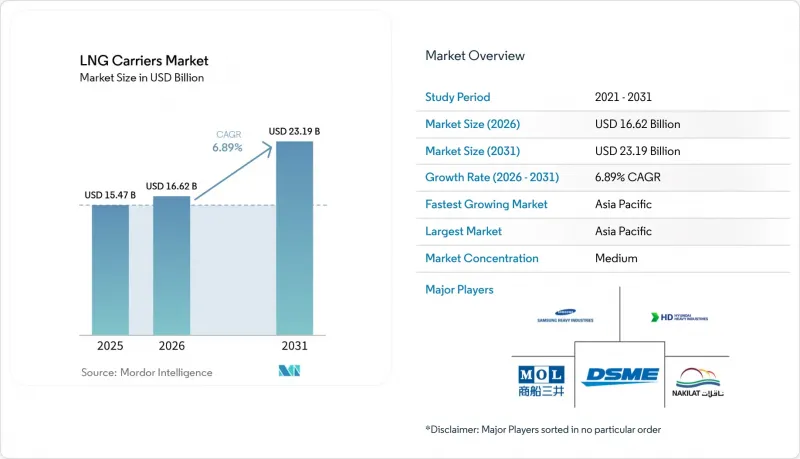
Mordor Intelligence에 의하면, LNG 운반선 시장 규모는 2025년 154억 7,000만 달러로 평가되었습니다. 2026년 166억 2,000만 달러에서 2031년까지 231억 9,000만 달러로 확대되어 2026년부터 2031년에 걸쳐 CAGR 6.89%를 나타낼 것으로 예측됩니다.

본 보고서는 저장 방식(모스식, 막식, 프리즘형 A, 프리즘형 B), 추진 방식(증기 터빈, DFDE/TFDE, X-DF 2행정 등), 선박 용량(14만 m³ 이하, 14만-18만 m³, 18만-22만 m³, 22만 m³ 초과), 용선 형태(정기 용선, 스팟/항해 용선, 벌크선 용선), 최종 사용자(LNG 생산자 등), 지역(북미, 유럽, 아시아태평양 등)에 따라 분류되어 있습니다.
세계의 LNG 운반선 시장 동향 및 인사이트
카타르에서 장기 용선 계약의 급증
카타르 에너지(Qatar Energy)는 수출 능력을 2024년 7,700만 톤에서 2030년까지 1억 4,200만 톤으로 확대할 계획이며, 이를 위해서는 25년간의 용선 계약에 따른 전용 운반선 122척이 필요합니다. 이러한 발주로 인해 2029년까지 한국 및 중국 조선소의 건조 할당량이 거의 모두 채워져, 독립 선주들 시장 진입이 제한되고 있습니다. 각 27만 1,000m³ 규모의 QC-Max형 선박 18척은 카타르-아시아 항로에서 단위 운송 비용을 12% 절감할 것입니다. 하루 약 12만 달러의 용선료는 생산자를 현물 시장의 변동으로부터 보호하는 동시에 선주에게 안정적인 현금 흐름을 보장합니다. 이로 인해 LNG 운반선 시장은 양극화되었으며, 독립 선주들은 남은 현물 화물 확보를 위한 경쟁에 나서지 않을 수 없게 되었습니다. 2024년 겨울에는 스팟 운임이 하루 25만 달러라는 최고치를 기록했습니다.
IMO의 EEXI 및 CII 규정 준수가 신조선 발주를 촉진하고 있습니다.
2023년에 발효된 효율화 규정에 따르면, 1만 DWT를 초과하는 선박에 대해 2019년 기준치에 비해 탄소 강도를 30% 감축해야 합니다. 3년 연속으로 "D"평가를 받은 증기 터빈선은 항해 속도에 제한을 받게 되어 항해 기간이 길어지고, 수익이 압박을 받게 됩니다. 구형 선박의 개조에는 800만-1,500만 달러의 비용이 소요되지만, 그 효과는 미미하기 때문에 취항 20년을 초과한 선박의 경우 해체가 경제적입니다. X-DF 또는 ME-GI 엔진을 탑재한 신조 선박은 탄소 강도를 최대 25% 줄이고, 메탄 배출량을 2 g/kWh 미만으로 낮춥니다. 이러한 장점 덕분에 2024-2025년 수주량의 68%가 듀얼 연료 추진 방식으로 전환되었습니다.
2027년 이후, 메탄 배출 규제가 강화될 전망
IMO(국제해사기구)의 해양환경보호위원회는 2030년까지 메탄 배출량을 3 g/kWh로 제한하는 기준을 마련할 예정이며, 이로 인해 기존의 듀얼 연료 설계는 위험에 처하게 될 것입니다. 이 기준을 준수하려면 촉매를 이용한 배출량 저감이나 엔진 교체가 필요하며, 선박 1척당 1,200만-1,800만 달러의 비용이 발생할 가능성이 있습니다. 업그레이드를 미루는 선주는 2030년 이전에 유럽이나 북미에서 입항 제한을 받을 우려가 있습니다. 대출자가 '포세이돈 원칙' 평가에 메탄 관련 지표가 반영됨에 따라 자금 조달 비용은 상승할 것으로 보입니다. 현재 추진 시스템에 대한 투자액 중 약 150억 달러가 조기 상각 위험에 노출되어 있습니다.
부문별 분석
2025년에는 막 기술이 LNG 운반선 시장 점유율의 70.8%를 차지했고, 적재율 98.5%를 실현하는 GTT사의 "Mark III Flex+" 그리고 "NO96" 각 변종에 힘입어 2031년까지 연평균 성장률(CAGR) 7.7%로 성장할 것으로 전망됩니다. 모스사의 구형 탱크는 북극해 항로에서 18%의 점유율을 유지하며 여전히 중요한 역할을 하고 있습니다. 한편, 사각형 탱크의 유형 A와 유형 B는 연안 피더 항로의 틈새 시장을 채우고 있습니다. 막식 시스템은 일일 증발 손실률을 약 0.11%로 낮추고, 적재물의 여유량을 줄임으로써 장거리 항로에서의 운임 수익성을 향상시킵니다. 선박 1척당 800만-1,200만 달러의 로열티 수입이 GTT사의 입지를 더욱 공고히 하고 있습니다.
신규 개발된 수소 대응 막은 2030년 이후에도 듀얼 연료의 유연성을 보장하지만, 단열층을 추가함에 따라 초기 비용이 10% 상승합니다. 친환경 연료에 대한 수요가 증가하는 가운데, 조기 도입은 재판매 가치를 높이고 운영 수명을 연장할 가능성이 있습니다. 모스사의 기술은 부피상의 단점보다 기계적 견고성이 우선시되는 빙해급 프로젝트에서 계속해서 채택될 전망입니다. Mark III Flex+의 주름형 스테인리스 라이너를 통한 점진적인 개선으로 인해 냉각 시간이 6시간 단축되어, 선박 1척당 연간 항해 횟수가 1회 증가합니다. 이로 인해 예측 기간 동안 막 기술의 우위가 더욱 공고해질 것입니다.
2025년 시점에서도 LNG 운반선 시장 규모의 40.2%를 증기 터빈이 차지하고 있었으나, X-DF 2행정 엔진은 2031년까지 연평균 성장률(CAGR) 8.6%로 성장하고 있습니다. 듀얼 연료 유닛은 보일오프 가스를 고압으로 연소시켜 연료 사용량을 25% 절감하며, 연간 400만 달러의 비용 절감 효과를 가져옵니다. ME-GI 엔진은 다연료 대응의 유연성 덕분에 신조선 수주의 24%를 차지하고 있습니다. DFDE 및 TFDE 시스템은 18%의 점유율을 차지하고 있으며, 배출 규제 해역에서의 기동성을 높여주지만, 효율성 면에서는 기준치에 미치지 못하는 상황입니다.
메탄 슬립에 대한 규제가 강화됨에 따라, 공기 윤활 등의 선체 개조로는 미미한 효과밖에 얻을 수 없음에도 불구하고 증기 터빈의 퇴역이 가속화되고 있습니다. 하이브리드 STaGE 패키지는 터빈과 보조 가스 엔진을 결합하여 특수한 수요를 충족시키고 있지만, 수주 점유율이 3%에 그치고 있는 것은 이 패키지의 높은 복잡성을 반영하고 있습니다. 장기적으로 볼 때, LNG 운반선 시장 역학은 저속 듀얼 연료 엔진과 잉여 보일오프 가스를 화물 탱크로 회수하는 재액화 설비의 결합을 촉진하고 있으며, 이를 통해 적재량과 항해당 수익이 향상됩니다.
지역별 분석
아시아태평양은 2025년에 LNG 운반선 시장 점유율의 48.7%를 차지했으며, 2031년까지 연평균 성장률(CAGR) 7.3%를 나타낼 것으로 전망됩니다. 일본과 한국은 합쳐서 연간 1억 2,200만 톤을 수입하고 있어, 안정적인 선박 용선 수요가 보장되어 있습니다. 2024년 중국 수요 감소로 인해 세계 무역이 위축되었으나, 이는 일시적인 현상으로 여겨지며, 석탄에서 가스로의 전환 목표에 따라 2026년 이후에는 LNG의 성장이 다시 가속화될 전망입니다. 동남아시아 국가들에서는 2030년까지 총 3,500만 톤의 수입이 예상되며, 이에 따라 LNG 운반선 수요가 더욱 증가하여 지역 간 위험 분산이 이루어지게 될 것입니다.
유럽은 2025년에 22%의 점유율을 차지했으며, 12곳의 신규 수입 터미널이 건설되고 재기화 능력이 연간 2억 4,000만 톤으로 확대된 것이 이를 뒷받침했습니다. 독일만 해도 러시아산 파이프라인 공급이 중단된 후, 2024년에는 FSRU를 통해 3,200만 톤을 수입했습니다. 재생에너지의 확대에 따라 베이스로드용 가스 사용은 억제되고 있지만, 메탄 누출과 관련된 항만 수용 규제로 인해 듀얼 연료 선박의 도입이 가속화되면서 LNG 운반선 시장의 현대화가 촉진되고 있습니다.
북미와 중동은 각각 15%와 10%의 점유율을 차지하는 수출 거점입니다. 미국의 액화량은 2024년에 9,800만 톤으로 증가하여, 멕시코만에서 아시아로 향하는 항로에서 연간 18-22척의 LNG 운반선 수요를 견인하고 있습니다. 카타르의 노스 필드 확장 계획에 따라 2030년까지 122척의 신조 선박이 확보됨에 따라, 수주 잔고의 성장세를 강화하는 동시에 LNG 운반선 시장 규모 확대를 뒷받침하고 있습니다. 남미는 5%의 점유율을 차지하고 있으며, 그 중심은 브라질입니다. 해당 국가에서는 수력 발전 이용 상황에 따라 수입 의존도가 변동하기 때문에 지역별 용선료율에 주기성이 나타나고 있습니다.
기타 혜택 :
- 엑셀 형식 시장 예측(ME) 시트
- 3개월간의 애널리스트 지원
자주 묻는 질문
목차
제1장 서론
제2장 조사 방법
제3장 주요 요약
제4장 시장 구도
제5장 시장 규모 및 성장 예측
제6장 경쟁 구도
제7장 시장 기회 및 향후 전망
KTHAccording to Mordor Intelligence, the LNG carriers market size is projected to expand from USD 15.47 billion in 2025 and USD 16.62 billion in 2026 to USD 23.19 billion by 2031, registering a CAGR of 6.89% between 2026 to 2031.
This report is Segmented by Containment Type (Moss, Membrane, Prismatic Type A, and Prismatic Type B), Propulsion Type (Steam Turbine, DFDE/TFDE, X-DF Two-Stroke, and More), Vessel Capacity (Up To 140k M3, 140 To 180k M3, 180 To 220k M3, and Above 220k M3), Charter Type (Time Charter, Spot/Voyage, and Bareboat), End-User (LNG Producers, and More), and Geography (North America, Europe, Asia-Pacific, and More).
Global LNG Carriers Market Trends and Insights
Surge in Long-Term Qatari Charter Contracts
QatarEnergy is lifting export capacity from 77 million tonnes in 2024 to 142 million tonnes by 2030, requiring 122 dedicated carriers on twenty-five-year charters. These orders absorb almost all Korean and Chinese yard slots through 2029 and restrict access for independent owners. The eighteen QC-Max vessels at 271,000 m3 each offer 12% lower unit shipping cost on Qatar-to-Asia routes. Charter rates of about USD 120,000 per day insulate producers from spot volatility while guaranteeing shipowners stable cash flows. This bifurcates the LNG carriers market, leaving independents to compete for residual spot cargoes where winter 2024 rates peaked at USD 250,000 per day.
IMO EEXI and CII Compliance Favoring Newbuild Orders
Efficiency rules that entered force in 2023 require a 30% carbon-intensity cut versus 2019 baselines for carriers above 10,000 DWT. Steam-turbine vessels rated D for three consecutive years face speed limits that prolong voyages and erode earnings. Retrofitting older hulls delivers only small gains for USD 8-15 million, making scrapping economical for units past twenty years. Newbuilds with X-DF or ME-GI engines cut carbon intensity by up to 25% and reduce methane slip below 2 g/kWh. These incentives shifted 68% of 2024-2025 orders toward dual-fuel propulsion.
Methane-Slip Rules Tightening after 2027
The IMO Marine Environment Protection Committee plans standards that limit methane slip to 3 g / kWh by 2030, putting legacy dual-fuel designs at risk. Compliance may require catalytic reduction or engine change-outs costing USD 12-18 million per vessel. Owners who defer upgrades could face port entry restrictions in Europe and North America before 2030. Financing costs will likely rise, as lenders embed methane metrics into Poseidon Principles assessments. About USD 15 billion in current propulsion investments risk early write-off.
Other drivers and restraints analyzed in the detailed report include:
- Rising Asian LNG Demand Amid Coal-to-Gas Switching
- Fleet Renewal of Aging Steam-Turbine Vessels
- Strait of Hormuz Geopolitical Risk
For complete list of drivers and restraints, kindly check the Table Of Contents.
Segment Analysis
Membrane technology secured 70.8% of the LNG carriers market share in 2025 and is projected to grow at a 7.7% CAGR to 2031, supported by GTT's Mark III Flex+ and NO96 variants that enable 98.5% cargo utilization. Moss spherical tanks stayed relevant for Arctic service with an 18% share, while prismatic Type A and Type B designs filled coastal feeder niches. Membrane systems lower boil-off rates to about 0.11% per day and cut cargo cushioning needs, enhancing freight economics on long routes. Royalties between USD 8 and USD 12 million per hull further anchor GTT's position.
Emerging hydrogen-ready membranes promise dual-fuel flexibility beyond 2030, although added insulation layers raise upfront cost by 10%. As demand for green fuels rises, early adoption could lift resale values and extend operational life. Moss technology should remain in ice-class projects where mechanical robustness outweighs volumetric penalties. Incremental gains from corrugated stainless liners in Mark III Flex+ shorten cooldown time by six hours, raising annual voyage counts by one per vessel. This reinforces membrane leadership over the forecast horizon.
Steam turbines still accounted for 40.2% of the LNG carriers market size in 2025, yet X-DF two-stroke engines are expanding at an 8.6% CAGR through 2031. Dual-fuel units burn boil-off gas at high pressure and cut fuel use by 25%, translating into USD 4 million yearly savings. ME-GI engines follow with 24% of newbuild orders thanks to multi-fuel flexibility. DFDE and TFDE systems occupy an 18% share that offers maneuvering agility in emission control areas but lags efficiency benchmarks.
Growing regulatory emphasis on methane slip accelerates steam-turbine retirement despite hull retrofits such as air lubrication that add only marginal benefit. Hybrid STaGE packages blend turbines with auxiliary gas engines and capture specialised trades, yet their 3% orderbook share reflects high complexity. Over time, LNG carriers' market dynamics favor slow-speed dual-fuel engines paired with reliquefaction plants that recover excess boil-off to the cargo tanks, boosting cargo delivered and revenue per voyage.
Complete Report Scope:
- By Containment Type
- Moss
- Membrane
- Prismatic Type A
- Prismatic Type B
- By Propulsion Type
- Steam Turbine
- DFDE/TFDE
- Slow-Speed Diesel + Relique
- ME-GI
- X-DF Two-Stroke
- Hybrid STaGE
- By Vessel Capacity
- Up to 140k m3
- 140 to 180k m3
- 180 to 220k m3
- Above 220k m3
- By Charter Type
- Time Charter
- Spot/Voyage
- Bareboat
- By End-User
- LNG Producers
- Portfolio Players and Traders
- Utilities and IPPs
- FSRU/FLNG Operators
- LNG Bunkering Service Providers
- By Geography
- North America
- United States
- Canada
- Mexico
- Europe
- Germany
- France
- Spain
- United Kingdom
- Russia
- Norway
- Rest of Europe
- Asia-Pacific
- China
- India
- Japan
- South Korea
- ASEAN Countries
- Australia and New Zealand
- Rest of Asia-Pacific
- South America
- Brazil
- Argentina
- Peru
- Rest of South America
- Middle East and Africa
- Saudi Arabia
- United Arab Emirates
- Qatar
- South Africa
- Nigeria
- Egypt
- Angola
- Rest of Middle East and Africa
- North America
Geography Analysis
Asia-Pacific commanded 48.7% of the LNG carriers market share in 2025 and is forecast to post a 7.3% CAGR to 2031. Japan and South Korea together import 122 million tonnes annually, guaranteeing steady charter demand. China's 2024 pullback trimmed global trade but is viewed as cyclical, with coal-to-gas targets likely to revive LNG growth beyond 2026. Southeast Asian countries expect combined imports of 35 million tonnes by 2030, creating incremental carrier need and balancing regional exposure.
Europe held a 22% share in 2025, propelled by twelve new import terminals that lifted regasification capacity to 240 million tonnes per year. Germany alone imported 32 million tonnes via FSRUs in 2024 after ending its Russian pipeline supply. Renewable build-out dampens baseload gas use, yet port entry rules on methane slip accelerate dual-fuel fleet adoption and stimulate LNG carriers market modernization.
North America and the Middle East are export hubs at 15% and 10% share, respectively. U.S. liquefaction rose to 98 million tonnes in 2024 and drives annual demand for eighteen to twenty-two carriers on Gulf-to-Asia routes. Qatar's North Field expansion secures 122 newbuilds through 2030, reinforcing orderbook momentum and underpinning LNG carriers market size growth. South America holds 5% share, led by Brazil, where import dependence varies with hydropower availability, adding cyclicality to regional charter rates.
- Samsung Heavy Industries Co. Ltd
- Hyundai Samho Heavy Industries Co. Ltd
- Daewoo Shipbuilding & Marine Engineering Co. Ltd
- Hyundai Heavy Industries Co. Ltd
- Kawasaki Heavy Industries Ltd
- Mitsubishi Heavy Industries Ltd
- Hudong-Zhonghua Shipbuilding Group
- China Merchants Heavy Industry
- Japan Marine United Corporation
- HJ Shipbuilding & Construction Co. Ltd
- STX Offshore & Shipbuilding Co. Ltd
- Royal Dutch Shell plc
- Nippon Yusen Kabushiki Kaisha (NYK Line)
- Mitsui O.S.K. Lines Ltd (MOL)
- Maran Gas Maritime Inc.
- Seapeak LLC
- Golar LNG Ltd
- GasLog Ltd
- Qatar Gas Transport Co. (Nakilat)
- BW LPG Ltd
Additional Benefits:
- The market estimate (ME) sheet in Excel format
- 3 months of analyst support
TABLE OF CONTENTS
1 Introduction
- 1.1 Study Assumptions & Market Definition
- 1.2 Scope of the Study
2 Research Methodology
3 Executive Summary
4 Market Landscape
- 4.1 Market Overview
- 4.2 Market Drivers
- 4.2.1 Surge in long-term Qatari/Qatargas charter contracts
- 4.2.2 IMO EEXI & CII compliance favouring newbuild orders
- 4.2.3 Rising Asian LNG demand amid coal-to-gas switching
- 4.2.4 Fleet renewal due to ageing steam-turbine vessels
- 4.2.5 Hydrogen-ready containment retrofits
- 4.2.6 AI-enabled voyage optimisation cutting boil-off losses
- 4.3 Market Restraints
- 4.3.1 Shipyard slot scarcity & cost inflation
- 4.3.2 Oversupply risk as 50 % of fleet on order
- 4.3.3 Methane-slip regulations tightening after 2027
- 4.3.4 Strait of Hormuz geopolitical chokepoint risk
- 4.4 Supply-Chain Analysis
- 4.5 Regulatory Landscape
- 4.6 Technological Outlook
- 4.7 Porter's Five Forces
- 4.7.1 Bargaining Power of Suppliers
- 4.7.2 Bargaining Power of Consumers
- 4.7.3 Threat of New Entrants
- 4.7.4 Threat of Substitutes Products & Services
- 4.7.5 Intensity of Competitive Rivalry
5 Market Size & Growth Forecasts
- 5.1 By Containment Type
- 5.1.1 Moss
- 5.1.2 Membrane
- 5.1.3 Prismatic Type A
- 5.1.4 Prismatic Type B
- 5.2 By Propulsion Type
- 5.2.1 Steam Turbine
- 5.2.2 DFDE/TFDE
- 5.2.3 Slow-Speed Diesel + Relique
- 5.2.4 ME-GI
- 5.2.5 X-DF Two-Stroke
- 5.2.6 Hybrid STaGE
- 5.3 By Vessel Capacity
- 5.3.1 Up to 140k m3
- 5.3.2 140 to 180k m3
- 5.3.3 180 to 220k m3
- 5.3.4 Above 220k m3
- 5.4 By Charter Type
- 5.4.1 Time Charter
- 5.4.2 Spot/Voyage
- 5.4.3 Bareboat
- 5.5 By End-User
- 5.5.1 LNG Producers
- 5.5.2 Portfolio Players and Traders
- 5.5.3 Utilities and IPPs
- 5.5.4 FSRU/FLNG Operators
- 5.5.5 LNG Bunkering Service Providers
- 5.6 By Geography
- 5.6.1 North America
- 5.6.1.1 United States
- 5.6.1.2 Canada
- 5.6.1.3 Mexico
- 5.6.2 Europe
- 5.6.2.1 Germany
- 5.6.2.2 France
- 5.6.2.3 Spain
- 5.6.2.4 United Kingdom
- 5.6.2.5 Russia
- 5.6.2.6 Norway
- 5.6.2.7 Rest of Europe
- 5.6.3 Asia-Pacific
- 5.6.3.1 China
- 5.6.3.2 India
- 5.6.3.3 Japan
- 5.6.3.4 South Korea
- 5.6.3.5 ASEAN Countries
- 5.6.3.6 Australia and New Zealand
- 5.6.3.7 Rest of Asia-Pacific
- 5.6.4 South America
- 5.6.4.1 Brazil
- 5.6.4.2 Argentina
- 5.6.4.3 Peru
- 5.6.4.4 Rest of South America
- 5.6.5 Middle East and Africa
- 5.6.5.1 Saudi Arabia
- 5.6.5.2 United Arab Emirates
- 5.6.5.3 Qatar
- 5.6.5.4 South Africa
- 5.6.5.5 Nigeria
- 5.6.5.6 Egypt
- 5.6.5.7 Angola
- 5.6.5.8 Rest of Middle East and Africa
- 5.6.1 North America
6 Competitive Landscape
- 6.1 Market Concentration
- 6.2 Strategic Moves (M&A, Partnerships, PPAs)
- 6.3 Market Share Analysis (Market Rank/Share for key companies)
- 6.4 Company Profiles (includes Global level Overview, Market level overview, Core Segments, Financials as available, Strategic Information, Products & Services, and Recent Developments)
- 6.4.1 Samsung Heavy Industries Co. Ltd
- 6.4.2 Hyundai Samho Heavy Industries Co. Ltd
- 6.4.3 Daewoo Shipbuilding & Marine Engineering Co. Ltd
- 6.4.4 Hyundai Heavy Industries Co. Ltd
- 6.4.5 Kawasaki Heavy Industries Ltd
- 6.4.6 Mitsubishi Heavy Industries Ltd
- 6.4.7 Hudong-Zhonghua Shipbuilding Group
- 6.4.8 China Merchants Heavy Industry
- 6.4.9 Japan Marine United Corporation
- 6.4.10 HJ Shipbuilding & Construction Co. Ltd
- 6.4.11 STX Offshore & Shipbuilding Co. Ltd
- 6.4.12 Royal Dutch Shell plc
- 6.4.13 Nippon Yusen Kabushiki Kaisha (NYK Line)
- 6.4.14 Mitsui O.S.K. Lines Ltd (MOL)
- 6.4.15 Maran Gas Maritime Inc.
- 6.4.16 Seapeak LLC
- 6.4.17 Golar LNG Ltd
- 6.4.18 GasLog Ltd
- 6.4.19 Qatar Gas Transport Co. (Nakilat)
- 6.4.20 BW LPG Ltd
7 Market Opportunities & Future Outlook
- 7.1 White-space & Unmet-Need Assessment
