
|
시장보고서
상품코드
2072470
압축 공기 에너지 저장(CAES) : 시장 점유율 분석, 업계 동향 및 통계, 성장 예측(2026-2031년)Compressed Air Energy Storage (CAES) - Market Share Analysis, Industry Trends & Statistics, Growth Forecasts (2026 - 2031) |
||||||
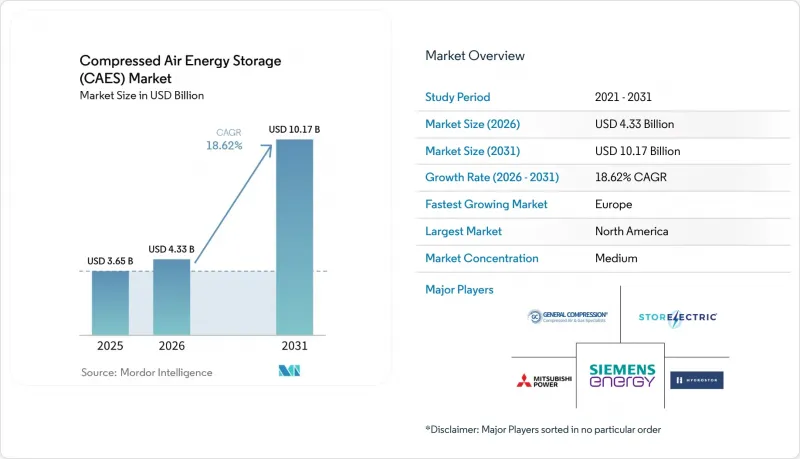
Mordor Intelligence에 의하면, 2026년 압축 공기 에너지 저장(CAES) 시장 규모는 43억 3,000만 달러로 추정되고 2025년 36억 5,000만 달러에서 확대해, 2031년에는 101억 7,000만 달러에 이를 것으로 예측됩니다.
2026년부터 2031년까지 연평균 성장률(CAGR) 18.6%로 성장할 것으로 전망됩니다.
본 보고서는 유형별(단열식, 비단열식 등), 저장 구성별(염돔형 동굴, 경암/채굴 동굴 등), 발전 용량별(소규모 및 중규모), 용도별(재생에너지 통합을 통한 전력 평활화, Power-to-X 수소 하이브리드 등), 최종 사용자별(전력 회사, 데이터센터 및 디지털 인프라 등), 지역별(북미, 유럽 등)
세계의 압축 공기 에너지 저장(CAES) 시장 동향 및 분석
재생에너지 도입 의무화가 전력 계통의 안정화를 위한 투자를 촉진합니다.
캘리포니아주, EU 및 호주 일부 주에서 시행되는 규제로 인해, 전력 회사들은 낮 시간대 재생에너지 공급 부족을 보완할 수 있는 장시간 전력 저장 용량을 확보해야 하는 상황에 놓여 있습니다. 캘리포니아주만 해도 비리튬계 에너지 저장 시설에 2억 7,000만 달러를 배정하고, 6시간의 지속 시간을 갖춘 설비에 대해 4GW의 목표를 설정함으로써, 압축 공기 에너지 저장(CAES) 시장 프로젝트에 명확한 정책적 방향을 제시하고 있습니다. 2025년에 최종 결정된 영국의 “'캡 앤 플로어' 이 제도는 방전 시간이 6시간을 초과하는 설비에 대해 규제된 수익원을 제공함으로써, CAES를 투자자들이 자금을 조달하기 쉬운 사업으로 만들고 있습니다. 이러한 틀은 “'덕 커브' 라고 불리는 현상에 직접 대응하는 것입니다. 이는 저녁 시간대 수요가 증가함에 따라 태양광 발전 출력이 급격히 감소하여 4-6시간 동안 공급 부족이 발생하는 시나리오이며, 이러한 상황에서는 배터리보다 CAES가 더 유리합니다. 호주의 뉴사우스웨일스주도 이에 발맞추어 1GW/13GWh 규모의 장주기 에너지 저장(LDES) 용량 계약을 체결하며, 압축 공기 에너지 저장(CAES) 시장을 더욱 확대했습니다.
단열식 CAES 기술의 $/kWh 비용 감소
열 관리 기술의 발전과 터보 기계의 표준화에 힘입어, 단열형 CAES의 설비 투자(CAPEX)는 1kW당 1,100-1,400달러까지 낮아졌으며, 왕복 효율은 70-75%로 향상되었습니다. 이로 인해 양수 발전 자산과의 격차 대부분이 해소되었습니다. 상변화 소재를 활용한 충진층식 축열 모듈은 현재 61.5%의 에너지 효율을 달성하여 3.5년 이내에 투자 회수가 가능하며, 화석 연료에 의존하지 않는 운영과 지속적인 탄소 크레딧 수입을 실현하고 있습니다. 90-200°C에서 가동되는 신개념 저온 단열 설계는 시동 시간이 90초 미만이기 때문에 주파수 조절 계약을 점차 확보해 나가고 있습니다. 이러한 비용 절감 및 성능 향상 덕분에, 압축 공기 에너지 저장(CAES) 시장은 차익 거래, 회전 예비력, 합성 관성을 포함한 다중 서비스 포트폴리오에서 주류 옵션으로서의 입지를 확립해 가고 있습니다.
높은 초기 설비 투자 비용이 시장 진입의 장벽이 되고 있습니다.
일반적인 유틸리티 규모의 CAES 설비의 경우, 단열 설계를 적용할 때 1kW당 1,600-2,300달러가 소요되며, 프로젝트 전체 예산은 1억 달러를 초과합니다. 맥킨토시 발전소의 인플레이션 조정 후 건설 비용은 개발사가 직면한 막대한 대차대조표상 위험을 여실히 보여주고 있습니다. 75%의 효율을 자랑하는 단열식 시스템의 경우 투자 회수 기간이 4-6년이 소요되는 반면, 계량기 앞쪽의 배터리 어레이는 2-3년 만에 투자 회수가 가능하기 때문에 비교해 보면 불리한 상황에 놓여 있습니다. 지질 조사, 맞춤형 터보 기계 및 저장 동굴 내벽 시공에 대한 보증으로 인해, 예기치 못한 상황에 대비한 예비비가 증가합니다. 이로 인해, 표적화된 정책 지원이 부족하고 자본이 부족한 지역에서는 압축 공기 에너지 저장(CAES) 산업의 매력이 떨어지고 있습니다.
부문별 분석
왕복 효율이 75%로 급상승했고, 연료가 필요 없는 운행 방식이 기업의 탄소중립 목표와 부합함에 따라 단열식 설계에 대한 투자자들의 관심이 높아지고 있습니다. 2025년, 압축 공기 에너지 저장(CAES) 시장에서 비단열식 플랜트 시장 점유율은 여전히 49.75%를 차지했지만, 단열식 부문은 2031년까지 연평균 성장률(CAGR) 22.10%로 성장할 것으로 전망됩니다. 미래를 내다보는 전력 회사들은 ‘제로 배출’이라는 실적을 근거로 단열식 설비를 선호하고 있지만, 가스 파이프라인이 잘 갖춰져 있고 용량 부족이 심각한 지역에서는 여전히 비단열식 설비의 도입이 진행되고 있습니다. 선진적인 등온식 프로토타입 압축 공기 에너지 저장(CAES) 시장 규모는 여전히 작지만, 심해에서의 계류 시험을 통해 이론상 90%의 효율이 입증된다면 시장이 확대될 가능성이 있습니다.
열 저장 매체의 비용은 2022년 이후 30% 가까이 하락했으며, 이것이 단열식 시스템의 성장 기반이 되고 있습니다. 대류식을 지지하는 주요 기업들은 효율을 소폭 향상시키는 하이브리드 증기 사이클을 도입하고 있지만, 경쟁력을 유지하기 위해서는 낮은 연료 열율에 의존하고 있습니다. 등온식 해저 시범 프로젝트는 해상 풍력 발전의 균형 조정을 목적으로 하고 있지만, kW당 1,500-3,000달러의 설비 투자(CAPEX)가 예상되기 때문에 단기적인 보급에는 한계가 있습니다. 한편, 상변화 복합재료 분야의 지속적인 혁신 덕분에 압축 공기 에너지 저장 업계는 급속한 학습 곡선을 유지하고 있습니다.
2025년 기준으로, 압축 공기 에너지 저장(CAES) 시장 규모의 52.40%를 염동이 차지했습니다. 이는 북미와 유럽에서의 지질학적 보급, 입증된 밀폐성, 그리고 성숙한 침출 기술 덕분입니다. 개발사에 따르면, 연간 유출률은 0.02% 미만이며, 이는 프로젝트의 자금 조달 가능성을 뒷받침하고 있습니다. 한편, 단단한 암반 동굴이나 폐광을 활용한 저장 시설의 경우, 호주, 독일, 중국에서 사업자들이 폐광을 개조하고 있으며, 기존 갱도를 활용함으로써 굴착 비용을 대폭 절감할 수 있어 연평균 성장률(CAGR) 24.80%로 성장하고 있습니다.
지상형 압력 용기는 외딴 지역의 마이크로그리드나 10MW 미만의 단기 프로젝트에는 적합하지만, 유틸리티 규모에서는 비용 면에서 현실적이지 않습니다. 대수층 저장은 불균일한 다공성으로 인해 압력 관리가 복잡해지기 때문에 여전히 시범 도입 단계에 머물러 있습니다. 수중 파이프 구상은 기술적으로는 실현 가능하지만, 계류 및 유지보수와 관련된 물류 측면의 과제에 여전히 직면해 있습니다. 그 결과, 향후 10년 동안 소금 돔과 경암 동굴이 압축 공기 에너지 저장(CAES) 시장 점유율을 주도할 가능성이 높을 것으로 보입니다.
지역별 분석
북미는 연방 정부의 대출 지원과 각 주의 야심 찬 조달 목표에 힘입어 2025년에는 매출의 34.40%를 차지했습니다. 캘리포니아주에 위치한 하이드로스토어사의 400 MW “'윌로우 록' 이 센터는 대규모 프로젝트의 추진력을 상징하는 사례인 반면, 캐나다의 퀸테 시설은 500MW 규모의 확장을 추진하기 위해 2억 달러의 성장 자금을 확보했습니다. 멕시코는 아직 검토 단계에 있지만, 정책적 인센티브가 구체화된다면 향후 건설 후보지가 될 수 있는 풍부한 염층을 보유하고 있습니다.
유럽의 연평균 성장률(CAGR) 27.10%라는 추세는 일관된 탈탄소화 의무화 조치에 힘입은 것입니다. 영국의 “'캡 앤 플로어' 이 계획은 베이스로드형 수익을 보장하며, 방전 지속 시간이 6시간을 초과하는 기술을 우선시하는 입찰 프로젝트의 파이프라인을 촉진하고 있습니다. 독일의 계통 균형 조정 수요를 계기로, 폐광이 된 소금 광산을 활용한 CAES 시스템 제안이 잇따르고 있으며, 네덜란드에서는 수소와 CAES를 결합한 하이브리드 허브로서 가스전의 용도 전환이 검토되고 있습니다. 동유럽의 광업 유산은 재생에너지의 보급이 확대됨에 따라, 저렴한 비용으로 동굴을 다른 용도로 활용하는 선택지를 제공합니다.
아시아태평양은 기가급 설비 도입을 위한 실증의 장으로 진화하고 있습니다. 중국 장쑤성에 위치한 300 MW 규모의 발전소에서는 40 bar, 600°C 조건에서의 운전 실적이 입증되었으며, 500 MW 규모의 프로젝트가 각 성에서 승인 절차를 진행 중입니다. 호주의 장주기 에너지 저장(LDES) 경매에서는 1GW를 초과하는 용량이 확보되었으며, 여기에는 8-15시간의 에너지 저장 능력을 갖춘 CAES의 입찰도 포함되어 있습니다. 일본의 연구 컨소시엄은 해저 파이프를 이용한 등온형 프로토타입의 평가를 진행 중이며, 한편 인도의 ‘ ‘재생에너지 저장 로드맵’ 이에 따라, 저장 시간이 10시간 이상인 설비에 대한 재정적 인센티브 도입 가능성이 제시되고 있습니다. 전반적으로 압축 공기 에너지 저장(CAES) 시장은 급속히 확대되고 있으며, 특히 재생에너지 보급률이 높고 지원적인 자금 조달 체계가 갖춰진 지역에서 이러한 추세가 두드러집니다.
기타 혜택 :
- 엑셀 형식 시장 예측(ME) 시트
- 3개월간의 애널리스트 지원
자주 묻는 질문
목차
제1장 서론
제2장 조사 방법
제3장 주요 요약
제4장 시장 구도
제5장 시장 규모 및 성장 예측
제6장 경쟁 구도
제7장 시장 기회 및 향후 전망
KTHAccording to Mordor Intelligence, compressed air energy storage market size in 2026 is estimated at USD 4.33 billion, growing from 2025 value of USD 3.65 billion with 2031 projections showing USD 10.17 billion, growing at 18.6% CAGR over 2026-2031.

This report is Segmented by Type (Diabatic, Adiabatic, and More), Storage Configuration (Salt-Domed Cavern, Hard-rock/Mined Cavern, and More), Power Capacity (Small-Scale and Medium-Scale), Application (Renewable-Integration Firming, Power-To-X Hydrogen Hybrids, and More), End-User (Electric Utility, Data Centres and Digital Infra, and More), and Geography (North America, Europe, and More)
Global Compressed Air Energy Storage (CAES) Market Trends and Insights
Renewable-Energy Penetration Mandates Drive Grid Stability Investments
Mandates in California, the EU, and select Australian states are compelling utilities to secure long-duration capacity that can bridge daily renewable gaps. California alone has earmarked USD 270 million for non-lithium storage and set a 4 GW target for assets with a six-hour duration, providing compressed air energy storage market projects with a clear policy runway. The UK's cap-and-floor scheme, finalized in 2025, offers a regulated revenue stream for assets with discharge windows exceeding 6 hours, making CAES a bankable proposition for investors. These frameworks directly address the "duck curve," a scenario in which solar output falls steeply as evening demand rises, creating a four- to six-hour deficit that favors CAES over batteries. Australia's New South Wales followed suit, contracting 1 GW/13 GWh of long-duration storage capacity, further expanding the compressed air energy storage market.
Declining $/kWh Costs for Adiabatic CAES Technology
Thermal-management advances and standardized turbomachinery have driven adiabatic CAPEX down to USD 1,100-1,400 per kW, lifting round-trip efficiencies to 70-75%, and closing much of the gap versus pumped-hydro assets. Packed-bed heat-storage modules using phase-change materials now reach 61.5% energy efficiency and recoup costs within 3.5 years, enabling fossil-free operation and recurring carbon-credit revenue. Emerging low-temperature adiabatic designs operating at 90-200 °C are snaring frequency-regulation contracts thanks to sub-90-second start-up times. These cost and performance gains are positioning the compressed air energy storage market as a mainstream choice for multi-service portfolios that include arbitrage, spinning reserve, and synthetic inertia.
High Up-Front Capital Expenditure Constrains Market Entry
Typical utility-scale CAES installations require USD 1,600-2,300 per kW for diabatic designs, with overall project budgets exceeding USD 100 million. The McIntosh plant's inflation-adjusted build-out cost illustrates the sizable balance-sheet exposure developers face. Four- to six-year payback horizons-even for 75%-efficient adiabatic systems-compare unfavorably with two- to three-year returns on front-of-the-meter battery arrays. Geological surveys, bespoke turbomachinery, and cavern-lining warranties increase contingency allowances, which dampens the appeal of the compressed air energy storage industry in capital-scarce regions that lack targeted policy support.
Other drivers and restraints analyzed in the detailed report include:
- Government Long-Duration Storage Tenders Accelerate Deployment
- Repurposing Depleted Gas Fields Reduces Infrastructure Costs
- Battery Price Deflation Creates Competitive Pressure
For complete list of drivers and restraints, kindly check the Table Of Contents.
Segment Analysis
Adiabatic designs captured rising investor attention as round-trip efficiencies surged toward 75% and fuel-free operation aligned with corporate net-zero targets. The adiabatic segment is forecast to grow at a 22.10% CAGR to 2031, despite diabatic plants still holding a 49.75% market share in the compressed air energy storage market as of 2025. Forward-looking utilities favor adiabatic assets for zero-emission credentials, while regions with abundant gas pipelines and urgent capacity shortages continue to commission diabatic units. The compressed air energy storage market size for advanced isothermal prototypes remains small, but could expand once deep-ocean tethering tests validate a 90% theoretical efficiency.
Thermal-storage media costs have fallen by almost 30% since 2022, underpinning the adiabatic runway. Diabatic stalwarts are responding with hybrid-steam cycles that marginally improve efficiency yet rely on lower fuel heat rates to stay relevant. Isothermal ocean-floor pilots target offshore wind balancing, but CAPEX estimates between USD 1,500 and USD 3,000 per kW constrain near-term uptake. Continual innovation in phase-change composites, meanwhile, keeps the compressed air energy storage industry on a rapid learning curve.
Salt caverns accounted for 52.40% of the compressed air energy storage market size in 2025, owing to their geological prevalence in North America and Europe, proven sealing integrity, and mature leaching techniques. Developers report leakage rates below 0.02% per year, reinforcing bankability. Hard-rock and mined caverns, however, are growing at a 24.80% CAGR as operators retrofit abandoned mines in Australia, Germany, and China, benefiting from pre-existing shafts that slash excavation costs.
Above-ground pressure vessels cater to remote microgrids and fast-track projects under 10 MW but become cost-prohibitive at utility scale. Aquifer storage remains limited to pilot deployments because heterogenous porosity complicates pressure management. Underwater pipe concepts, although technically viable, still wrestle with mooring and maintenance logistics. Consequently, salt-domed and hard-rock caverns are likely to dominate the compressed air energy storage market share throughout the decade.
Complete Report Scope:
- By Type
- Diabatic
- Adiabatic
- Isothermal
- Super-/Advanced Isothermal
- By Storage Configuration
- Salt-domed cavern
- Hard-rock/mined cavern
- Aquifer
- Abandoned mine/tunnel
- Above-ground pressure vessel
- Underwater/seabed pipe
- By Power Capacity
- Small-scale (Below 10 MW)
- Medium-scale (10 to 100 MW)
- By Application
- Renewable-integration firming
- Peak-shaving and load-shifting
- T&D deferral
- Backup and resilience/microgrids
- Industrial waste-heat recovery
- Power-to-X hydrogen hybrids
- By End-User
- Electric utilities
- Independent power producers
- Commercial and industrial
- Remote and off-grid communities
- Data centres and digital infra
- By Geography
- North America
- United States
- Canada
- Mexico
- Europe
- Germany
- United Kingdom
- Italy
- Spain
- France
- Netherlands
- Norway
- Russia
- Rest of Europe
- Asia-Pacific
- China
- Japan
- India
- South Korea
- ASEAN Countries
- Australia
- Rest of Asia-Pacific
- South America
- Brazil
- Argentina
- Rest of South America
- Middle East and Africa
- Saudi Arabia
- United Arab Emirates
- Israel
- South Africa
- Egypt
- Rest of Middle East and Africa
- North America
Geography Analysis
North America captured 34.40% of revenues in 2025, driven by federal lending support and ambitious state procurement targets. Hydrostor's 400 MW Willow Rock center in California exemplifies large-scale momentum, while Canada's Quinte facility secured USD 200 million in growth capital to advance a 500 MW build-out. Mexico, though still exploratory, boasts ample salt formations that could host future sites once policy incentives materialize.
Europe's 27.10% CAGR trajectory rests on cohesive decarbonization mandates. The UK's cap-and-floor plan ensures baseload-style earnings, encouraging tender pipelines that favor technologies with discharge thresholds exceeding six hours. Germany's grid-balancing needs have catalyzed proposals for CAES systems utilizing disused salt mines, and the Netherlands is studying repurposed gas fields for hybrid hydrogen-CAES hubs. Eastern Europe's mining legacies offer an optionality for low-cost cavern conversion as renewable energy penetration grows.
Asia-Pacific region is evolving into a test bed for giga-scale installations. China's 300 MW Jiangsu plant validated 40-bar, 600 °C operation, and additional 500 MW projects are moving through provincial approvals. Australia's Long Duration Storage auctions secured over 1 GW of capacity, which includes CAES bids with 8-15-hour capabilities. Japan's research consortia are evaluating seabed-pipe isothermal prototypes, while India's Renewable Energy Storage Roadmap indicates potential fiscal incentives for assets with a storage duration of >= 10 hours. Overall, the compressed air energy storage market is expanding rapidly, particularly where high renewable energy penetration is combined with supportive financing mechanisms.
- Siemens Energy AG
- Hydrostor Inc.
- General Compression Ltd.
- Apex CAES LLC
- Ridge Energy Storage LP
- Storelectric Ltd.
- Mitsubishi Power Americas
- Dresser-Rand (Siemens)
- ALACAES SA
- RWE Power AG
- Corre Energy BV
- Bright Energy Storage
- Stiesdal Storage Tech.
- NRStor Inc.
- Shell Energy Storage
- Huaibei A-CAES Co.
- PG&E (Diablo CAES proj.)
- Cavergy Solutions Ltd.
- Enel Green Power (EGP)
- E.ON SE (Huntorf owner)
Additional Benefits:
- The market estimate (ME) sheet in Excel format
- 3 months of analyst support
TABLE OF CONTENTS
1 Introduction
- 1.1 Study Assumptions & Market Definition
- 1.2 Scope of the Study
2 Research Methodology
3 Executive Summary
4 Market Landscape
- 4.1 Market Overview
- 4.2 Global Installed & Planned CAES Capacity Analysis (MW)
- 4.3 Market Drivers
- 4.3.1 Renewable-energy penetration mandates
- 4.3.2 Declining $/kWh for adiabatic CAES
- 4.3.3 Government long-duration storage tenders
- 4.3.4 Repurposing depleted gas fields for CAES
- 4.3.5 AI-optimised thermal management boosts round-trip efficiency
- 4.3.6 Corporate 24/7 clean-power PPAs driving over 8-hour storage
- 4.4 Market Restraints
- 4.4.1 High up-front capex & long payback
- 4.4.2 Geological site limitations
- 4.4.3 Battery price deflation pressure
- 4.4.4 Community opposition over cavern integrity & seismicity
- 4.5 Supply-Chain Analysis
- 4.6 Regulatory Landscape
- 4.7 Technological Outlook
- 4.8 Porter's Five Forces
- 4.8.1 Bargaining Power of Suppliers
- 4.8.2 Bargaining Power of Buyers
- 4.8.3 Threat of New Entrants
- 4.8.4 Threat of Substitutes
- 4.8.5 Intensity of Competitive Rivalry
5 Market Size & Growth Forecasts
- 5.1 By Type
- 5.1.1 Diabatic
- 5.1.2 Adiabatic
- 5.1.3 Isothermal
- 5.1.4 Super-/Advanced Isothermal
- 5.2 By Storage Configuration
- 5.2.1 Salt-domed cavern
- 5.2.2 Hard-rock/mined cavern
- 5.2.3 Aquifer
- 5.2.4 Abandoned mine/tunnel
- 5.2.5 Above-ground pressure vessel
- 5.2.6 Underwater/seabed pipe
- 5.3 By Power Capacity
- 5.3.1 Small-scale (Below 10 MW)
- 5.3.2 Medium-scale (10 to 100 MW)
- 5.4 By Application
- 5.4.1 Renewable-integration firming
- 5.4.2 Peak-shaving and load-shifting
- 5.4.3 T&D deferral
- 5.4.4 Backup and resilience/microgrids
- 5.4.5 Industrial waste-heat recovery
- 5.4.6 Power-to-X hydrogen hybrids
- 5.5 By End-User
- 5.5.1 Electric utilities
- 5.5.2 Independent power producers
- 5.5.3 Commercial and industrial
- 5.5.4 Remote and off-grid communities
- 5.5.5 Data centres and digital infra
- 5.6 By Geography
- 5.6.1 North America
- 5.6.1.1 United States
- 5.6.1.2 Canada
- 5.6.1.3 Mexico
- 5.6.2 Europe
- 5.6.2.1 Germany
- 5.6.2.2 United Kingdom
- 5.6.2.3 Italy
- 5.6.2.4 Spain
- 5.6.2.5 France
- 5.6.2.6 Netherlands
- 5.6.2.7 Norway
- 5.6.2.8 Russia
- 5.6.2.9 Rest of Europe
- 5.6.3 Asia-Pacific
- 5.6.3.1 China
- 5.6.3.2 Japan
- 5.6.3.3 India
- 5.6.3.4 South Korea
- 5.6.3.5 ASEAN Countries
- 5.6.3.6 Australia
- 5.6.3.7 Rest of Asia-Pacific
- 5.6.4 South America
- 5.6.4.1 Brazil
- 5.6.4.2 Argentina
- 5.6.4.3 Rest of South America
- 5.6.5 Middle East and Africa
- 5.6.5.1 Saudi Arabia
- 5.6.5.2 United Arab Emirates
- 5.6.5.3 Israel
- 5.6.5.4 South Africa
- 5.6.5.5 Egypt
- 5.6.5.6 Rest of Middle East and Africa
- 5.6.1 North America
6 Competitive Landscape
- 6.1 Market Concentration
- 6.2 Strategic Moves (M&A, Partnerships, PPAs)
- 6.3 Market Share Analysis (Market Rank/Share for key companies)
- 6.4 Company Profiles (includes Global level Overview, Market level overview, Core Segments, Financials as available, Strategic Information, Products & Services, and Recent Developments)
- 6.4.1 Siemens Energy AG
- 6.4.2 Hydrostor Inc.
- 6.4.3 General Compression Ltd.
- 6.4.4 Apex CAES LLC
- 6.4.5 Ridge Energy Storage LP
- 6.4.6 Storelectric Ltd.
- 6.4.7 Mitsubishi Power Americas
- 6.4.8 Dresser-Rand (Siemens)
- 6.4.9 ALACAES SA
- 6.4.10 RWE Power AG
- 6.4.11 Corre Energy BV
- 6.4.12 Bright Energy Storage
- 6.4.13 Stiesdal Storage Tech.
- 6.4.14 NRStor Inc.
- 6.4.15 Shell Energy Storage
- 6.4.16 Huaibei A-CAES Co.
- 6.4.17 PG&E (Diablo CAES proj.)
- 6.4.18 Cavergy Solutions Ltd.
- 6.4.19 Enel Green Power (EGP)
- 6.4.20 E.ON SE (Huntorf owner)
7 Market Opportunities & Future Outlook
- 7.1 White-space & Unmet-Need Assessment
