

|
시장보고서
상품코드
2072615
레독스 플로우 배터리 시장 : 시장 점유율 분석, 업계 동향 및 통계, 성장 예측(2026-2031년)Redox Flow Battery - Market Share Analysis, Industry Trends & Statistics, Growth Forecasts (2026 - 2031) |
||||||
 Mordor Intelligence
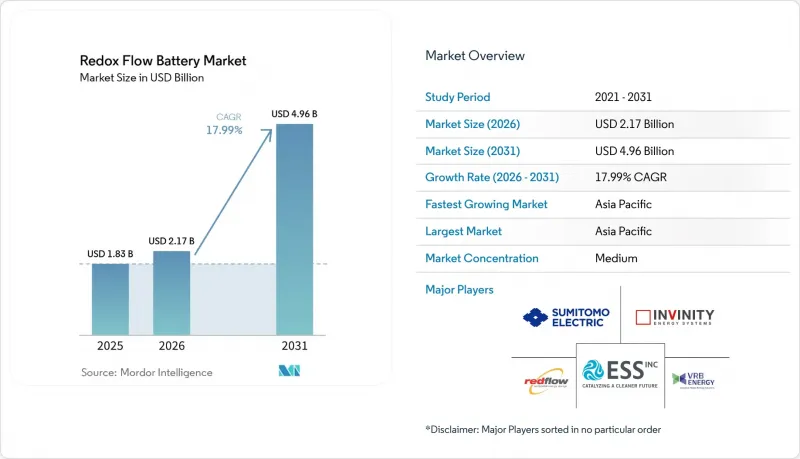
Mordor Intelligence에 의하면, 레독스 플로우 배터리 시장 규모는 2025년 18억 3,000만 달러로 평가되었고, 2026년 21억 7,000만 달러로 추정되고, 2031년까지 49억 6,000만 달러로 확대될 것응로 예측되며, 2026-2031년 연평균 복합 성장률(CAGR)은 17.99%를 나타낼 전망입니다.
본 보고서는 유형별(바나듐 레독스 플로우 배터리, 기타), 용도별(유틸리티 규모의 에너지 저장, 상업 및 산업 시설, 기타), 최종 사용자별(전력 회사/IPP, 상업 및 산업 시설 소유자, 정부 및 국방 기관, 기타), 지역별(북미, 유럽, 아시아태평양, 기타)로 분류되어 있습니다. 시장 전망은 금액(달러) 기준으로 제시되어 있습니다.
세계의 레독스 플로우 배터리 시장 동향 및 인사이트
계통 안정화 요건이 도매 시장으로의 통합을 촉진
연방에너지규제위원회(FERC)의 지침 제841호에 따라, 미국의 도매 시장은 기술적으로 가능한 모든 서비스에서 에너지 저장 설비를 수용해야 할 의무가 부과되었으며, 그동안 계량기 뒤편에서의 비용 절감에만 의존해 왔던 플로우 배터리에게는 새로운 수익원이 열렸습니다. 유럽의 '청정 에너지 포장'도 2026년까지 유사한 개혁을 의무화하고 있으며, 각 개발사는 이미 독일, 영국, 북유럽에서 총 1.2GW 규모의 플로우 배터리 프로젝트를 발표했습니다. 지령 제2222호는 분산형 자원의 집약을 더욱 촉진하고, 상업시설이 흐름형 배터리를 통합하여 용량과 부수적 수익을 얻을 수 있도록 함으로써, 태양광 발전 비중이 높은 주에서는 프로젝트의 투자 회수 기간을 12년에서 7년으로 단축하고 있습니다. 캘리포니아주와 텍사스주의 미국 전력 회사들은 현재 6시간 이상의 서비스에 대해 비리튬계 화학 물질을 명시적으로 우선하는 입찰을 실시했습니다. 이는 플로우 시스템이 전력 및 에너지를 분리함으로써, 시스템 전체를 교체하지 않고도 단계적인 용량 증강을 가능하게 하기 때문입니다. 따라서 이러한 의무화는 운영 일정의 유연성과 경제적 확실성을 뒷받침하며, 규제 시장과 자유화 시장 모두에서 조달 결정을 가속화하고 있습니다.
바나듐 임대 모델이 자본 비용 절감을 가속화
Storion Energy의 85달러/kWh 프로그램으로 대표되는 전해액 리스 계약은 초기 자본 요건을 최대 60%까지 절감하고, 상품 가격 변동 위험을 리스 제공업체에게 전가합니다. 바나듐은 99%의 재활용률을 유지하기 때문에 리스 회사는 전해액을 20년 주기로 여러 번 재사용할 수 있어, 리튬 이온 배터리에는 없는 순환형 경제의 이점을 창출하고 있습니다. 중국의 개발 사업자는 약 10년 후에 운영비를 자산 소유자에게 이전하는 '리스 투 오너(Lease-to-Own)' 구조의 유효성을 입증하고 있으며, 이를 통해 비용 구조를 기업의 재생에너지 PPA(전력구매계약)와 조화시키고 있습니다. 학술 연구에 따르면, 전해질을 임대할 경우 10시간의 가동 시간을 가정한 바나듐 시스템은 1kWh당 300달러 미만이 될 것으로 예측되며, 이는 동일한 가동 시간 기준의 인산철 리튬 배터리보다 비용이 저렴합니다. 금융 혁신이 전 세계적으로 확산됨에 따라, 자본 집약적인 장기 프로젝트의 자금 조달 가능성이 높아지면서 레독스 플로우 배터리의 잠재적 시장 규모가 확대되고 있습니다.
바나듐 가격 변동이 투자 불확실성을 야기합니다.
바나듐 오산화물의 가격은 2022년 파운드당 9.20달러에서 2026년 3월에는 5.60달러로 하락했습니다. 이는 중국의 철강 수요 부진에 따른 40% 하락입니다. 이러한 가격 하락으로 인해 신규 프로젝트의 설비 투자액은 억제되었으나, 불확실성으로 인해 장기 공급 계약이 복잡해지면서 금융 기관의 참여를 가로막고 있습니다. CRU 그룹은 중국의 12GWh 도입 목표에 따른 수요가 금세기 후반에 가격을 끌어올릴 것으로 예상하고 있지만, 브라질과 마다가스카르에서의 새로운 공급이 가격 상승세를 둔화시킬 가능성이 있습니다. 따라서 개발 사업자들은 전해액 리스를 통해 가격 변동을 헤지하고 있지만, 가격 변동은 여전히 부채 상환 배수에 영향을 미치고 있어 레독스 플로우 배터리 시장의 성장을 다소 둔화시키고 있습니다.
부문별 분석
바나듐계 시스템은 중국, 일본, 한국의 성숙한 생태계를 바탕으로 2025년 시점에서 레독스 플로우 배터리 시장 점유율 49.2%를 유지했습니다. 한편, 철계 플로우 배터리 시스템은 각 공급업체들이 중요 광물에 대한 의존도를 해소하고, 1세대 스택에 비해 에너지 밀도를 20% 향상시킴에 따라 2031년까지 연평균 성장률(CAGR) 22.2%를 기록하며 성장할 것으로 전망됩니다. 바나듐 계열이 우위를 유지하고 있는 이유는 전해액의 99%가 재활용 가능하여 수명 종료 시 잔존 가치를 보장하기 때문이지만, 원자재 가격 변동으로 인해 리스크 회피 성향이 강한 금융 관계자들은 철 계열 대체품으로 눈을 돌리고 있습니다. 아연·브롬계는 통신용 백업 및 Off-grid 분야의 틈새 시장을 차지하고 있지만, 유기계 및 하이브리드계의 개념은 여전히 상용화 전 단계에 머물러 있습니다. 예측 기간 동안 레독스 플로우 배터리 시장에서 단일 화학 체계가 압도적인 우위를 차지하기보다는 지역별 정책이 도입 추세를 좌우하여 기술의 다양성이 지속될 가능성이 높을 것으로 보입니다.
2세대 바나듐 스택은 현재 2만 사이클의 수명을 자랑하고 있으며, 이는 인산철 리튬의 2배에 해당합니다. 이를 통해 안정적인 현금 흐름을 추구하는 인프라 투자자들에게 매력적인 보증 조건이 제공되고 있습니다. 한편, 막 기술 분야의 혁신 기업들은 유럽의 규제보다 앞서 PFAS가 포함되지 않은 솔루션을 실현하는 것을 목표로 하고 있습니다. 전반적으로, 기술 혁신에 따라 시장 진입 장벽이 점차 낮아지고 있으며, 절대적인 출하량은 증가하겠지만 2031년까지 바나듐의 점유율이 40% 미만으로 떨어질 가능성이 있어, 레독스 플로우 배터리 시장 경쟁 구도가 더욱 확대될 것으로 예측됩니다.
지역별 분석
아시아태평양은 2025년 생산 능력의 45.9%를 차지했으며, 2031년까지 연평균 성장률(CAGR) 19.3%를 유지할 것으로 전망됩니다. 이는 주로 재생에너지의 변동성을 완화하는 바나듐 시스템에 대해 중국이 12 GWh의 도입 의무를 부과하고 있기 때문입니다. kWh당 0.04-0.07달러의 성(省) 차원 보조금이 발전 수익을 보장하는 한편, Rongke Power와 같은 국내 대형 기업들은 2026년 완공을 목표로 후베이성에 800 MWh 규모의 설비를 건설 중입니다. 일본과 호주는 중요 광물에 대한 의존 위험을 분산하기 위해 철계 플로우 배터리의 시험 운용을 진행하고 있으며, 이는 이 지역 전체에서 화학 계열의 다각화가 진행되고 있음을 보여줍니다.
2025년에는 북미가 용량의 상당 부분을 차지했으나, 2029년까지는 '섹션 45X' 세액 공제가 적용됨에 따라, 2031년까지 해당 지역의 레독스 플로우 배터리 시장 규모에서 차지하는 점유율이 3분의 1까지 상승할 가능성이 있습니다. 캘리포니아주만 해도 2024년에 1.8GW 규모의 장주기 에너지 저장(LDES) 시스템을 조달했으며, 그 중 40%는 6시간 이상의 서비스 제공을 위해 플로우 화학 기술을 채택하고 있습니다. 캐나다의 각 주에서는 수력 발전 수출을 안정화하기 위해 유량 시스템을 평가하고 있으며, 멕시코의 전력 회사 CFE는 산업 단지 인근의 8시간 축전 시스템에 대한 입찰 지침을 재검토하고 있습니다. 이는 북미 대륙 전체에서 수요가 확대되고 있음을 보여줍니다. 스미토모 전기공업이 2024년에 가동을 시작한 캘리포니아주의 51메가와트, 306메가와트시 규모의 설비는 북미 최대 규모의 도입 사례로, 일본 제조업체의 미국 시장 내 점유율 확대를 입증하고 있습니다. 2025년 생산량의 18%를 차지하는 유럽에서는 독일과 영국을 필두로 PFAS가 포함되지 않은 막 기술이 추진되고 있습니다. 유럽화학물질청(ECHA)의 PFAS 규제에 관한 최신 자료와 최종 견해를 바탕으로, IONOMR, 프라운호퍼 IAP, Cellfion 등 각사의 투자가 진행되고 있으며, 유럽공급업체들은 규제 주도형 수요에 대응할 준비를 갖추고 있습니다.
독일의 혁신 경매와 영국의 용량 시장에서는 모두 가동 기간에 따라 보너스가 지급되어, 플로우 배터리의 경제성이 크게 향상되고 있습니다. 그러나 PFAS 규제가 도입될 예정인 만큼, 기존 막 공급업체의 실행 위험은 높아지고 있으며, 각 OEM 업체들은 PFAS 무함유 제품의 도입을 가속화하고 있습니다. 풍력 발전과 수소를 결합한 하이브리드 시스템에 주력하고 있는 스칸디나비아 국가들과 발트 국가들에서는 계절적인 전력 부족을 완화하기 위해 프로젝트 계획 단계부터 플로우 배터리가 도입되고 있습니다.
칠레와 브라질은 송전의 대체 수단으로서 장주기 에너지 저장(LDES)을 중시하는 정책 체계를 수립 중이며, 한편 남아프리카공화국의 에스콤(Eskom)은 전력 제한을 줄이기 위해 12 MWh 규모의 바나듐 시스템을 도입하여 신흥 전력망에서의 적용 가능성을 입증했습니다. 태양광 발전의 LCOE 패리티가 확대됨에 따라, 이들 지역에서는 2031년까지 누적 8 GWh의 도입 규모에 도달할 가능성이 있습니다.
기타 혜택
- 엑셀 형식 시장 예측(ME) 시트
- 3개월간의 애널리스트 지원
자주 묻는 질문
목차
제1장 서론
제2장 조사 방법
제3장 주요 요약
제4장 시장 구도
제5장 시장 규모 및 성장 예측
제6장 경쟁 구도
제7장 시장 기회 및 향후 전망
AJY 26.07.07According to Mordor Intelligence, the redox flow battery market size is projected to expand from USD 1.83 billion in 2025 and USD 2.17 billion in 2026 to USD 4.96 billion by 2031, registering a CAGR of 17.99% between 2026 to 2031.
This report is Segmented by Type (Vanadium Redox Flow Battery, and More), Application (Utility-Scale Energy Storage, Commercial and Industrial Facilities, and More), End-User (Power Utilities/IPPs, Commercial and Industrial Owners, Government and Defense, and More), and Geography (North America, Europe, Asia-Pacific, and More). The Market Forecasts are Provided in Terms of Value (USD).
Global Redox Flow Battery Market Trends and Insights
Grid-Stability Mandates Drive Wholesale Market Integration
Federal Energy Regulatory Commission Order 841 obliges U.S. wholesale markets to accept storage assets for all services for which they are technically capable, unlocking new revenue streams for flow batteries that previously relied on behind-the-meter savings alone. Europe's Clean Energy Package imposes similar reforms by 2026, and developers have already announced 1.2 GW of flow projects in Germany, the United Kingdom, and the Nordic region. Order 2222 further aggregates distributed resources, allowing commercial sites to pool flow batteries and earn capacity and ancillary revenue, which shortens project payback from 12 years to 7 years in solar-heavy states. U.S. utilities in California and Texas now issue tenders that explicitly favor non-lithium chemistries for six-hour-plus services because flow systems decouple power and energy, enabling incremental capacity additions without full system replacement. Mandates, therefore, underpin scheduling flexibility and economic certainty, accelerating procurement decisions across both regulated and deregulated markets.
Vanadium Leasing Models Accelerate Capital Cost Reduction
Electrolyte leasing agreements, exemplified by Storion Energy's USD 85 kWh program, cut initial capital requirements by up to 60% and transfer commodity risk to the lessor. Because vanadium retains 99% recyclability, leasing firms can redeploy electrolyte over multiple 20-year cycles, creating a circular-economy advantage that lithium-ion lacks. Chinese developers have validated lease-to-own structures that convert operating expenses into asset ownership after roughly a decade, aligning cost profiles with corporate renewable PPAs. Academic studies project that ten-hour vanadium systems fall below USD 300 kWh when electrolyte is leased, undercutting lithium iron phosphate at equivalent durations. As financial innovations diffuse globally, capital-intensive long-duration projects gain bankability, widening the total addressable redox flow battery market.
Volatile Vanadium Pricing Creates Investment Uncertainty
Vanadium pentoxide fell from USD 9.20 lb in 2022 to USD 5.60 lb in March 2026, a 40% slide tied to weak Chinese steel demand. Although the slump lowered capex for new projects, uncertainty complicates long-term offtake agreements and deters lenders. CRU Group expects demand from China's 12 GWh mandate to lift prices later in the decade, but fresh supply from Brazil and Madagascar could mute any rally. Developers thus hedge price swings through electrolyte leasing, but fluctuations still sway debt-service coverage ratios, marginally slowing redox flow battery market growth.
Other drivers and restraints analyzed in the detailed report include:
- Solar and Wind LCOE Parity Creates Duration-Specific Storage Demand
- Corporate Net-Zero Procurement Drives 8-12-Hour Storage PPAs
- Lower Round-Trip Efficiency Versus Lithium-Ion
For complete list of drivers and restraints, kindly check the Table Of Contents.
Segment Analysis
Vanadium designs maintained 49.2% redox flow battery market share in 2025 on the back of a mature ecosystem in China, Japan, and South Korea. Iron flow systems, however, are projected to grow at 22.2% CAGR to 2031 as vendors eliminate reliance on critical minerals and boost energy density 20% over first-generation stacks. Vanadium's dominance persists because 99% electrolyte recyclability underwrites residual value at end-of-life, yet feedstock volatility nudges risk-averse financiers toward iron alternatives. Zinc-bromine occupies telecom backup and off-grid niches, while organic and hybrid concepts remain pre-commercial. Over the forecast period, technology pluralism is likely, with regional policies shaping deployment preferences rather than a single chemistry winning outright in the redox flow battery market.
Second-generation vanadium stacks now tout 20,000-cycle lifetimes, double that of lithium iron phosphate, supporting warranty terms that appeal to infrastructure investors seeking stable cash flows. Meanwhile, membrane innovators are striving for PFAS-free solutions to pre-empt European regulation. Altogether, technology shifts are starting to erode barriers to entry, suggesting that vanadium's share may slip below 40% by 2031 even as absolute shipments grow, broadening competitive dynamics within the redox flow battery market.
Complete Report Scope:
- By Type
- Vanadium Redox Flow Battery (VRFB)
- Zinc-Bromine Flow Battery
- Iron Flow Battery
- Organic/Hybrid Flow Battery
- Other Chemistries (e.g., Fe/Cr, H2-Br2)
- By Application
- Utility-Scale Energy Storage (Above 10 MWh)
- Micro-grids and Islands
- Commercial and Industrial Facilities
- Residential Nanogrids
- EV-Charging Plaza Buffering
- Other (Defense, Mining, Off-grid Telecom)
- By End-user
- Power Utilities/IPPs
- Renewable Project Developers
- Commercial and Industrial Owners
- Government and Defense
- Research and Academic
- By Geography
- North America
- United States
- Canada
- Mexico
- Europe
- Germany
- United Kingdom
- France
- Italy
- NORDIC Countries
- Russia
- Rest of Europe
- Asia Pacific
- China
- India
- Japan
- South Korea
- ASEAN Countries
- Rest of Asia Pacific
- South America
- Brazil
- Argentina
- Rest of South America
- Middle East and Africa
- Saudi Arabia
- United Arab Emirates
- South Africa
- Egypt
- Rest of Middle East and Africa
- North America
Geography Analysis
Asia-Pacific held 45.9% of capacity in 2025 and is forecast to maintain a 19.3% CAGR through 2031, chiefly due to China's 12 GWh mandate for vanadium systems that decouple renewable volatility. Provincial subsidies of USD 0.04 - 0.07 kWh guarantee dispatch revenues, while domestic giants like Rongke Power are erecting an 800 MWh array in Hubei slated for 2026 completion. Japan and Australia are piloting iron flow chemistries to hedge critical-mineral exposure, signaling chemistry diversification across the region.
North America contributed a significant share of capacity in 2025, but with Section 45X tax credits in force until 2029, the region's share of the redox flow battery market size could climb to one-third by 2031. California alone procured 1.8 GW of long-duration storage in 2024, 40% of which favored flow chemistry for six-hour-plus services. Canadian provinces are evaluating flow systems to firm hydropower exports, while Mexico's utility CFE is reviewing tender guidelines for eight-hour storage near industrial corridors, illustrating expanding continental demand. Sumitomo Electric's 51-megawatt, 306-megawatt-hour California installation, operational in 2024, is the largest North American deployment, showcasing Japanese manufacturers' U.S. market share gains. Europe, with 18% of 2025 capacity, led by Germany and the UK, is advancing PFAS-free membrane technologies. The European Chemicals Agency's updated PFAS restriction dossier and final opinions drive investments by IONOMR, Fraunhofer IAP, and Cellfion, positioning European suppliers to meet regulatory-driven demand.
Germany's innovation auctions and the United Kingdom's Capacity Market both award duration bonuses that materially improve flow economics. Yet pending PFAS restrictions raise execution risk for legacy membrane suppliers, prompting OEMs to accelerate PFAS-free rollouts. Scandinavia and the Baltic states, vested in wind-plus-hydrogen hybrids, now include flow batteries in project pipelines to mitigate seasonal deficits.
Chile and Brazil are mapping policy frameworks that value long-duration storage as a transmission alternative, while South Africa's Eskom deployed a 12 MWh vanadium system to cut load shedding, demonstrating applicability in emerging grids. These regions could collectively account for 8 GWh of cumulative deployments by 2031 as solar LCOE parity spreads.
- Sumitomo Electric Industries
- VRB Energy
- Invinity Energy Systems
- ESS Inc.
- Redflow Limited
- Primus Power
- Largo Clean Energy
- CellCube (Enerox GmbH)
- VoltStorage GmbH
- VFlow Tech
- Lockheed Martin (GridStar Flow)
- HydraRedox
- H2 Inc.
- Bushveld Energy
- Rongke Power
- Stryten Energy
- EnerVenue
- UniEnergy Tech (UET)
- Volterion GmbH
- StorEn Technologies
Additional Benefits:
- The market estimate (ME) sheet in Excel format
- 3 months of analyst support
TABLE OF CONTENTS
1 Introduction
- 1.1 Study Assumptions & Market Definition
- 1.2 Scope of the Study
2 Research Methodology
3 Executive Summary
4 Market Landscape
- 4.1 Market Overview
- 4.2 Market Drivers
- 4.2.1 Grid-stability mandates (FERC 841, EU-Clean-Energy Package)
- 4.2.2 Rapid cost decline of vanadium leasing models
- 4.2.3 Solar & Wind LCOE parity creating long-duration storage gaps
- 4.2.4 Corporate net-zero procurement of 8-12 h storage PPAs
- 4.2.5 "Made-in-USA" tax credits for non-Li chemistries (Inflation Reduction Act under Section 45X)
- 4.2.6 Data-center drive for 99.999 % uptime micro-grids (Over 10 h)
- 4.3 Market Restraints
- 4.3.1 Volatile vanadium price linked to steel demand
- 4.3.2 Lower round-trip efficiency vs Li-ion
- 4.3.3 PFAS-free membrane regulations raising cost of legacy stacks
- 4.3.4 Long permitting cycle for Above 50 MWh electrolyte trucking & Haz-mat storage
- 4.4 Supply-Chain Analysis
- 4.5 Regulatory Landscape
- 4.6 Technological Outlook
- 4.7 Porter's Five Forces Analysis
- 4.7.1 Threat of New Entrants
- 4.7.2 Bargaining Power of Buyers
- 4.7.3 Bargaining Power of Suppliers
- 4.7.4 Threat of Substitutes
- 4.7.5 Competitive Rivalry
5 Market Size & Growth Forecasts
- 5.1 By Type
- 5.1.1 Vanadium Redox Flow Battery (VRFB)
- 5.1.2 Zinc-Bromine Flow Battery
- 5.1.3 Iron Flow Battery
- 5.1.4 Organic/Hybrid Flow Battery
- 5.1.5 Other Chemistries (e.g., Fe/Cr, H2-Br2)
- 5.2 By Application
- 5.2.1 Utility-Scale Energy Storage (Above 10 MWh)
- 5.2.2 Micro-grids and Islands
- 5.2.3 Commercial and Industrial Facilities
- 5.2.4 Residential Nanogrids
- 5.2.5 EV-Charging Plaza Buffering
- 5.2.6 Other (Defense, Mining, Off-grid Telecom)
- 5.3 By End-user
- 5.3.1 Power Utilities/IPPs
- 5.3.2 Renewable Project Developers
- 5.3.3 Commercial and Industrial Owners
- 5.3.4 Government and Defense
- 5.3.5 Research and Academic
- 5.4 By Geography
- 5.4.1 North America
- 5.4.1.1 United States
- 5.4.1.2 Canada
- 5.4.1.3 Mexico
- 5.4.2 Europe
- 5.4.2.1 Germany
- 5.4.2.2 United Kingdom
- 5.4.2.3 France
- 5.4.2.4 Italy
- 5.4.2.5 NORDIC Countries
- 5.4.2.6 Russia
- 5.4.2.7 Rest of Europe
- 5.4.3 Asia Pacific
- 5.4.3.1 China
- 5.4.3.2 India
- 5.4.3.3 Japan
- 5.4.3.4 South Korea
- 5.4.3.5 ASEAN Countries
- 5.4.3.6 Rest of Asia Pacific
- 5.4.4 South America
- 5.4.4.1 Brazil
- 5.4.4.2 Argentina
- 5.4.4.3 Rest of South America
- 5.4.5 Middle East and Africa
- 5.4.5.1 Saudi Arabia
- 5.4.5.2 United Arab Emirates
- 5.4.5.3 South Africa
- 5.4.5.4 Egypt
- 5.4.5.5 Rest of Middle East and Africa
- 5.4.1 North America
6 Competitive Landscape
- 6.1 Market Concentration
- 6.2 Strategic Moves (M&A, Partnerships, PPAs)
- 6.3 Market Share Analysis (Market Rank/Share for key companies)
- 6.4 Company Profiles (includes Global level Overview, Market level overview, Core Segments, Financials as available, Strategic Information, Products & Services, and Recent Developments)
- 6.4.1 Sumitomo Electric Industries
- 6.4.2 VRB Energy
- 6.4.3 Invinity Energy Systems
- 6.4.4 ESS Inc.
- 6.4.5 Redflow Limited
- 6.4.6 Primus Power
- 6.4.7 Largo Clean Energy
- 6.4.8 CellCube (Enerox GmbH)
- 6.4.9 VoltStorage GmbH
- 6.4.10 VFlow Tech
- 6.4.11 Lockheed Martin (GridStar Flow)
- 6.4.12 HydraRedox
- 6.4.13 H2 Inc.
- 6.4.14 Bushveld Energy
- 6.4.15 Rongke Power
- 6.4.16 Stryten Energy
- 6.4.17 EnerVenue
- 6.4.18 UniEnergy Tech (UET)
- 6.4.19 Volterion GmbH
- 6.4.20 StorEn Technologies
7 Market Opportunities & Future Outlook
- 7.1 White-Space & Unmet-Need Assessment


