|
시장보고서
상품코드
2072667
서드파티 리스크 관리 시장 : 시장 점유율 분석, 업계 동향 및 통계, 성장 예측(2026-2031년)Third-Party Risk Management - Market Share Analysis, Industry Trends & Statistics, Growth Forecasts (2026 - 2031) |
||||||
 Mordor Intelligence
Mordor Intelligence에 의하면, 서드파티 리스크 관리 시장 규모는 2025년에 92억 7,000만 달러로 평가되었고, 2026년 106억 달러로 추정되고, 2031년까지 207억 1,000만 달러에 이를 것으로 예측되며, 예측 기간(2026-2031년) CAGR은 14.34%를 나타낼 전망입니다.
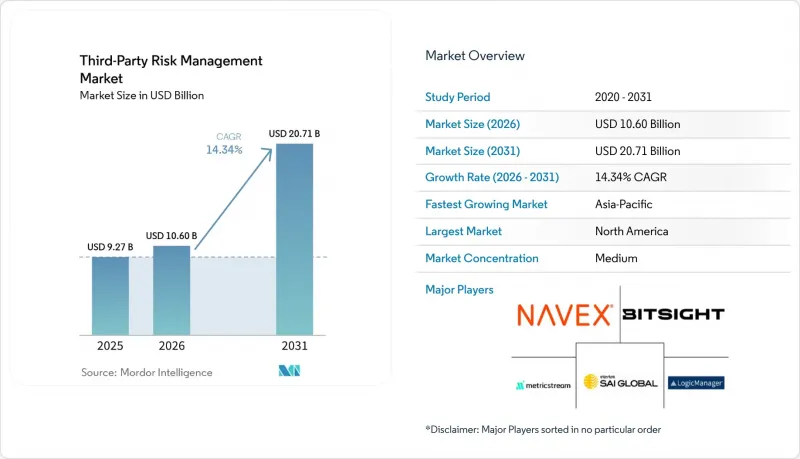
본 보고서는 구성 요소별(솔루션 및 서비스), 배포 모델별(클라우드 및 온프레미스), 조직 규모별(대기업 및 중소기업), 최종 사용자 산업별(은행, 금융서비스 및 보험(BFSI), IT 및 통신, 헬스케어 및 생명과학, 정부 및 국방, 소매 및 소비재 등) 및 지역별로 분류되어 있습니다. 시장 전망치는 금액(달러)으로 표시되어 있습니다.
세계의 서드파티 리스크 관리 시장 동향 및 인사이트
제3자에 의한 사이버 공격과 랜섬웨어 위협의 심화
현재 공격자들이 공급업체를 표적으로 삼는 사례가 늘고 있습니다. 이는 단 한 곳공급업체만 침해당해도 수많은 고객 환경에 대한 침입 경로가 열리게 되기 때문이며, 이로 인해 타사 리스크 관리 시장 전체에서 그 시급성이 더욱 커지고 있습니다. 버라이즌의 '2026년 데이터 침해 조사 보고서'에 따르면, 확인된 데이터 유출 사건의 30%에서 제3자의 개입이 확인되었으며, 이는 전년 대비 급증한 수치입니다. 또한, 최근 들어 대규모 공급망 및 제3자 침해 사례도 급증하고 있어, 공급업체와 관련된 위험이 기업의 사이버 위험에서 상시적인 요소로 자리 잡고 있음을 보여주고 있습니다. Black Kite사의 보고서에 따르면, 제3자에 의한 정보 유출 1건당 2차 피해자의 평균 수는 2024년 2.56건에서 2025년에는 5.28건으로 증가했습니다. 이는 현재 보안상의 문제가 상호 연결된 생태계 전체로 파급되고 있는 실태를 반영하고 있습니다. 또한 SecurityScorecard사의 조사에 따르면, 랜섬웨어 공격의 41.4%가 제3자를 통해 발생하는 것으로 밝혀졌으며, 이러한 추세에 따라 제3자 위험 관리 시장에서 더 많은 업계가 공식적인 공급업체 모니터링 프로그램 도입을 추진하고 있습니다.
디지털 회복탄력성 및 아웃소싱 규제 강화
제3자 감독이 검증 및 감사가 가능한 통제 수단으로 간주되게 되면서, 규제는 서드파티 리스크 관리 시장에서 가장 강력한 지출 요인 중 하나로 자리 잡고 있습니다. DORA는 2025년 1월 17일에 시행되며, EU 금융기관에 대해 정보 등록부 유지, 중요한 ICT 계약에 최소한의 보안 조항을 포함시키는 것, 그리고 집중 위험에 대한 지속적인 모니터링을 의무화하고 있습니다. 바젤 위원회는 2025년 12월에 ‘제3자 리스크의 건전한 관리에 관한 원칙’을 발표함으로써, 은행 부문 공급업체 거버넌스 및 지속적인 모니터링에 관한 세계 기준이 한 단계 높아졌습니다. 규제 움직임은 유럽 이외의 지역으로도 확산되고 있으며, 일본 금융청은 2026년 4월, 미국, 유럽연합, 영국에서 시행되고 있는 선진적인 TPCRM(서드파티 리스크 관리) 사례를 조사한 조사 보고서를 발표했습니다. 또한, 2025년 10월에는 뉴욕주 금융서비스국이 제3자 서비스 제공업체의 위험에 관한 지침을 발표하며, 제3자 위험 관리 시장에서 문서화되고 증거에 기반한 감독의 필요성을 재차 강조했습니다.
사일로화된 리스크 관리 시스템 전반에 걸친 높은 도입 및 통합 비용
많은 구매 기업들이 공통된 데이터 구조를 기반으로 구축되지 않은 조달, ERP, 계약 관리, GRC 시스템과 TPRM 플랫폼을 연동해야 하기 때문에 도입은 여전히 서드파티 리스크 관리 시장에서 현실적인 장벽으로 남아 있습니다. Whistic사의 보고서에 따르면, 2025년에 TPRM 팀은 평균적으로 정규직 직원 3명을 추가로 채용했으며, 1FTE당 10만 9,000달러의 비용이 소요되었음에도 불구하고, 94%의 기업이 여전히 심사를 원하는 모든 공급업체를 평가하지 못하고 있다고 응답했습니다. 이러한 격차는 인력 배치, 프로세스 설계, 데이터 정제가 불충분할 경우, 소프트웨어 투자만으로는 범위 문제를 해결할 수 없음을 보여줍니다. 소규모 구매 기업의 경우 부담이 더욱 커서, 첫해 플랫폼 비용, 구축 비용, 인건비가 4만-8만 달러에 달하는 경우도 있어, 서드파티 리스크 관리 시장에의 본격적인 진출이 지연되는 원인이 되고 있습니다. 그 결과, 많은 조직에서는 대응이 늦어지고 감사 증거의 신뢰성이 떨어지는데도 불구하고, 여전히 스프레드시트나 불완전한 업무 흐름에 의존하고 있습니다.
부문별 분석
2025년, 솔루션은 서드파티 리스크 관리 시장의 61.23%를 차지했으며, 이는 구매자들이 여전히 핵심 공급업체 거버넌스에서 플랫폼 주도형 모델을 선호하고 있음을 보여주었습니다. 기업들은 서로 연동되지 않은 여러 도구를 넘나들지 않고, 단일 운영 계층 내에서 위험 식별, 점수 산정, 워크플로우 관리 및 보고서 작성을 수행하고자 하기 때문에 이 솔루션은 여전히 핵심적인 위치를 차지하고 있습니다. 조직이 특정 시점의 평가에서 공급업체 상황에 대한 지속적인 모니터링으로 전환함에 따라, 솔루션 내에서 가장 큰 수요가 지속적인 모니터링 및 인텔리전스 기능으로 이동하고 있습니다. 위험 식별, 실사, 평가 및 점수 산정 도구는 제3자 위험 관리 시장의 감사 요구 사항, 온보딩 관리, 증거 수집 요건에 직접 부합하기 때문에 여전히 가장 널리 채택되고 있는 계층을 형성하고 있습니다.
서비스 부문은 가장 빠르게 성장하고 있는 분야이며, 서드파티 리스크 관리 시장 내 서비스 부문의 규모는 2026-2031년 연평균 성장률(CAGR) 14.67%로 확대될 것으로 전망됩니다. 많은 조직이 여전히 설문지 관리, 실사 수행, 시정 조치 추적 및 공급업체에 대한 후속 조치에 있어 외부 지원이 필요하기 때문에 전문 서비스 및 관리형 서비스에 대한 수요가 증가하고 있습니다. 이러한 수요는 기업이 정책의 소유권이나 에스컬레이션 권한을 사내에 유지하고자 하는 경우에도 증가하고 있으며, 이것이 서드파티 리스크 관리 업계 전반에 걸친 하이브리드 운영 모델을 뒷받침하고 있습니다. 또한, 구독 기반의 라이프사이클 관리 서비스를 판매하는 기술 주도형 신규 진출기업들로부터도 매니지드 서비스에 대한 관심이 높아지고 있으며, 이로 인해 타사 리스크 관리 시장에서 확장 속도가 느린 프로젝트 중심의 제공 모델에 압박이 가해지고 있습니다.
클라우드는 2025년 서드파티 리스크 관리 시장의 57.45% 점유율을 차지했고, 2031년까지 연평균 성장률(CAGR)이 14.89%에 달할 전망이며, 가장 빠르게 성장하고 있는 도입 모델이기도 합니다. 이러한 상황은 타사 리스크 관리 시장이 SaaS형 도입으로 서서히 전환되고 있는 것이 아니라, 이미 SaaS형 도입을 중심으로 통합이 진행되고 있음을 보여줍니다. 클라우드 도구는 인프라의 오버헤드를 줄이고, 도입을 신속하게 하며, 컨텐츠, 워크플로우, 통합 기능의 빈번한 업데이트를 지원하기 때문에 대기업 및 중견 기업 구매자들로부터 지지를 받고 있습니다. 이러한 구매자의 논리가, 공급업체가 서드파티 리스크 관리 시장에서 지역이나 고객 규모에 관계없이 서비스 범위를 확대하는 데 한몫하고 있습니다.
온프레미스도 여전히 중요한 위치를 차지하고 있습니다. 이는 일부 규제 대상 금융기관이나 국방 기관이 데이터 저장 장소나 로컬 처리에 대해 여전히 더 엄격한 관리를 요구하고 있기 때문입니다. 따라서 타사 리스크 관리 시장의 도입과 관련된 논의는 기존 시스템을 대체하는 것보다는 서로 다른 워크로드를 각 환경에 어떻게 할당할 것인가에 초점이 맞추어져 있습니다. 또한, 멀티클라우드 벤더 생태계는 타사에 대한 의존도를 높이기 때문에 플랫폼 제공을 가능하게 하는 클라우드 전환 자체가 고객이 모니터링해야 할 벤더 리스크의 양도 증가시키고 있습니다. 따라서 많은 구매 기업들은 모니터링 기능은 클라우드에 유지하면서 기밀성이 높은 공급업체 기록은 온프레미스에 저장하고 있으며, 이것이 서드파티 리스크 관리 업계 전반에 걸쳐 하이브리드 모델을 뒷받침하고 있습니다.
지역별 분석
2025년, 북미는 서드파티 리스크 관리 시장 점유율의 38.56%를 차지했습니다. 이는 엄격한 규제, 성숙한 보안 지출, 그리고 전문 공급업체의 집중에 기인한 것입니다. 특히 미국에서는 규제 대상 부문이 정기적인 체크리스트를 통한 심사에서 서비스 제공업체에 대한 지속적인 감시로 전환되고 있어, 지속적인 모니터링에 대한 수요가 특히 높아지고 있습니다. 2025년 10월에 발표된 NYDFS(뉴욕주 금융서비스국)의 개정 지침은 이러한 방향성을 한층 더 강화하여, 라이선스를 보유한 사업체들에게 제3자 거버넌스를 최우선 과제 중 하나로 규정했습니다. 또한, 국경을 초월한 공급망과 니어쇼어 운영 모델로 인해 모회사나 주요 서비스 제공업체에 대한 새로운 감독 요건이 발생함에 따라, 캐나다와 멕시코 역시 서드파티 리스크 관리 시장에서 그 중요성이 커지고 있습니다.
유럽은 서드파티 리스크 관리 시장에서 여전히 2위의 규모를 자랑하는 지역 블록이며, 단기적으로는 가장 급격한 규제 강화에 직면했습니다. 2025년 1월 17일, DORA가 유럽연합(EU) 전역에서 시행됨에 따라 ICT 제3자 등록부, 계약 조항, 집중 위험 모니터링 및 주요 공급자에 대한 감독과 관련된 상세한 요건이 도입되었습니다. 2025년 11월, 유럽의 감독 체계가 한 단계 더 발전하여 최초의 주요 제3자 제공업체 그룹이 공식적인 감독 대상이 되었습니다. 이로 인해 금융기관들이 서드파티 리스크 관리 시장에서 프로그램이나 문서를 구축하는 방식에 변화가 생기고 있습니다. 독일과 영국은 여전히 최대의 내수 시장이며, 한편 프랑스, 이탈리아, 네덜란드, 스페인에서는 금융 분야를 넘어 각 부문에서 규정 준수 중심의 도입이 지속적으로 진행되고 있습니다.
아시아태평양은 서드파티 리스크 관리 시장에서 가장 빠르게 성장하고 있는 지역으로, 2026-2031년 연평균 성장률(CAGR) 14.78%를 나타낼 것으로 전망됩니다. 디지털 공급망이 확대되고 규제 당국이 제3자의 사이버 위험에 대한 기대치를 공식적으로 정하기 시작함에 따라, 중국, 인도, 일본이 가장 큰 수요처로 부상하고 있습니다. 일본 금융청은 2026년 4월, 해외의 선진적인 TPCRM(서드파티 리스크 관리) 실천 사례를 조사한 조사 보고서를 발표했습니다. 한편, SecurityScorecard의 조사에 따르면, 2025년 분석 대상 국가 중 싱가포르가 71.4%라는 가장 높은 제3자 정보 유출률을 기록했습니다. 남미, 중동 및 아프리카에서는 현재 시장 규모가 여전히 작지만, 기업 구매자들 사이에서 개인정보 보호법 시행, 클라우드 거버넌스, 공급망 보안에 대한 기대가 더욱 구체화됨에 따라 서드파티 리스크 관리 시장이 확대되고 있습니다.
기타 혜택 :
- 엑셀 형식 시장 예측(ME) 시트
- 3개월간의 애널리스트 지원
자주 묻는 질문
목차
제1장 서론
제2장 조사 방법
제3장 주요 요약
제4장 시장 구도
제5장 시장 규모 및 성장 예측
제6장 경쟁 구도
제7장 시장 기회 및 향후 전망
AJY 26.07.03According to Mordor Intelligence, the third-party risk management market was valued at USD 9.27 billion in 2025 and is estimated to grow from USD 10.60 billion in 2026 to reach USD 20.71 billion by 2031, at a CAGR of 14.34% during the forecast period (2026-2031).
This report is Segmented by Component (Solutions, and Services), Deployment Model (Cloud, and On-Premises), Organization Size (Large Enterprises, and Small and Medium-Sized Enterprises), End User Industry (BFSI, IT and Telecom, Healthcare and Life Sciences, Government and Defense, Retail and Consumer Goods, and More), and Geography. The Market Forecasts are Provided in Terms of Value (USD).
Global Third-Party Risk Management Market Trends and Insights
Escalating Third-Party Cyberattacks and Ransomware Exposure
Attackers now target vendors more often because one compromised supplier can open paths into many customer environments, and that is raising urgency across the third-party risk management market. Third-party involvement appeared in 30% of confirmed breaches in the Verizon 2026 Data Breach Investigations Report, which marked a sharp increase from the prior year. Large supply-chain and third-party compromises also rose sharply in recent years, which shows that vendor-linked exposure is becoming a durable part of enterprise cyber risk. Black Kite reported that the average number of downstream victims per third-party breach increased to 5.28 in 2025 from 2.56 in 2024, which reflects how failures now spread across connected ecosystems. SecurityScorecard also found that 41.4% of ransomware attacks originated through third-party vectors, and that pattern is pulling more sectors into formal vendor oversight programs within the third-party risk management market.
Tightening Digital Resilience and Outsourcing Regulations
Regulation is becoming one of the strongest spending triggers in the third-party risk management market because third-party oversight is now treated as a control that can be tested and audited. DORA entered application on January 17, 2025, and it requires EU financial entities to maintain a Register of Information, include minimum security clauses in critical ICT contracts, and monitor concentration risk on an ongoing basis. The Basel Committee published its Principles for the Sound Management of Third-Party Risk in December 2025, which raised the global baseline for banking-sector vendor governance and ongoing monitoring. Regulatory momentum is also spreading beyond Europe, as Japan's Financial Services Agency published a research report in April 2026 to study advanced TPCRM practices in the United States, the European Union, and the United Kingdom. New York's Department of Financial Services added further pressure in October 2025 with guidance on third-party service provider risk, reinforcing the need for documented and evidence-based oversight in the third-party risk management market.
High Implementation and Integration Costs Across Siloed Risk Stacks
Implementation remains a real barrier in the third-party risk management market because many buyers must connect TPRM platforms with procurement, ERP, contract management, and GRC systems that were not built around a shared data structure. Whistic reported that TPRM teams added an average of 3 full-time employees in 2025 at USD 109,000 per FTE, while 94% still said they could not assess all the vendors they wanted to review. That gap shows that software spend alone does not solve coverage problems when staffing, process design, and data cleanup are weak. The burden is heavier for smaller buyers, where first-year platform, setup, and labor costs can reach USD 40,000 to USD 80,000 and delay formal adoption in the third-party risk management market. As a result, many organizations continue to rely on spreadsheets or partial workflows, even when those approaches create slower response times and weaker audit evidence.
Other drivers and restraints analyzed in the detailed report include:
- Expanding Vendor Ecosystems Across Cloud and SaaS Environments
- Shift From Periodic Reviews to Continuous Monitoring and Automation
For complete list of drivers and restraints, kindly check the Table Of Contents.
Segment Analysis
Solutions accounted for 61.23% of the third-party risk management market in 2025, which shows that buyers still prefer platform-led models for core vendor governance. Solutions remain central because enterprises want risk identification, scoring, workflow management, and reporting inside one operating layer rather than across disconnected tools. The strongest demand inside solutions is shifting toward continuous monitoring and intelligence features, as organizations move away from point-in-time assessments and toward persistent surveillance of vendor conditions. Risk identification and due diligence, along with assessment and scoring tools, still form the most widely adopted layers because they align directly with audit needs, onboarding controls, and evidence collection requirements in the third-party risk management market.
Services is the fastest-growing component, with the third-party risk management market size for services projected to expand at a CAGR of 14.67% from 2026 to 2031. Professional and managed services are gaining ground because many organizations still need outside support for questionnaire administration, due diligence execution, remediation tracking, and vendor follow-up. That demand is rising even where companies want to keep policy ownership and escalation authority in-house, which supports blended operating models across the third-party risk management industry. Managed offerings are also drawing interest from technology-led entrants that sell subscription-based lifecycle coverage, and that is putting pressure on project-heavy delivery models that scale more slowly in the third-party risk management market.
Cloud held 57.45% of the third-party risk management market share in 2025 and is also the fastest-growing deployment model, with a 14.89% CAGR through 2031. That combination shows that the third-party risk management market is consolidating around SaaS delivery rather than gradually shifting toward it. Cloud tools appeal to large enterprises and mid-sized buyers because they reduce infrastructure overhead, speed deployment, and support frequent updates to content, workflows, and integrations. The same buyer logic is helping vendors widen coverage across regions and customer sizes in the third-party risk management market.
On-premises remains relevant because some regulated financial institutions and defense organizations still require tighter control over data residency and local processing. That makes the deployment discussion less about replacement and more about how different workloads are split across environments in the third-party risk management market. Multi-cloud vendor ecosystems also create more third-party exposure, so the same cloud shift that enables platform delivery is also increasing the amount of vendor risk that customers must monitor. Many buyers are therefore keeping monitoring intelligence in the cloud while storing sensitive vendor records locally, which supports hybrid models across the third-party risk management industry.
Complete Report Scope:
- By Component
- Solutions
- Risk Identification and Due Diligence
- Risk Assessment and Scoring
- Continuous Monitoring and Intelligence
- Workflow, Remediation, and Reporting
- Services
- Professional Services
- Managed Services
- Solutions
- By Deployment Model
- Cloud
- On-premises
- By Organization Size
- Large Enterprises
- Small and Medium-Sized Enterprises
- By End User Industry
- BFSI
- IT and Telecom
- Healthcare and Life Sciences
- Government and Defense
- Retail and Consumer Goods
- Manufacturing
- Energy and Utilities
- Other End User Industries
- By Geography
- North America
- United States
- Canada
- Mexico
- South America
- Brazil
- Argentina
- Chile
- Rest of South America
- Europe
- Germany
- United Kingdom
- France
- Italy
- Spain
- Netherlands
- Russia
- Rest of Europe
- Asia-Pacific
- China
- Japan
- India
- South Korea
- Singapore
- Rest of Asia-Pacific
- Middle East
- Saudi Arabia
- United Arab Emirates
- Turkey
- Rest of Middle East
- Africa
- South Africa
- Nigeria
- Kenya
- Rest of Africa
- North America
Geography Analysis
North America accounted for 38.56% of the third-party risk management market share in 2025, supported by dense regulation, mature security spending, and a strong concentration of specialist vendors. The United States has shown especially strong demand for continuous monitoring because regulated sectors are moving beyond periodic checklist reviews and toward ongoing oversight of service providers. Updated NYDFS guidance issued in October 2025 reinforced that direction and kept third-party governance high on the agenda for licensed entities. Canada and Mexico are also becoming more relevant to the third-party risk management market as cross-border supply chains and nearshore operating models create new oversight requirements for parent companies and critical service providers.
Europe remained the second-largest regional block in the third-party risk management market and faced the sharpest near-term regulatory acceleration. DORA entered application across the European Union on January 17, 2025, and it introduced detailed requirements for ICT third-party registers, contractual provisions, concentration risk monitoring, and oversight of critical providers. In November 2025, the European supervisory framework moved further as the first cohort of critical third-party providers came under formal oversight, which is changing how financial entities structure programs and documentation in the third-party risk management market. Germany and the United Kingdom remain the largest national demand centers, while France, Italy, the Netherlands, and Spain continue to add compliance-led adoption across sectors beyond finance.
Asia-Pacific is the fastest-growing geography in the third-party risk management market, with a CAGR of 14.78% expected from 2026 to 2031. China, India, and Japan represent the largest demand pools, as digital supply chains broaden and regulators start to formalize expectations around third-party cyber risk. Japan's Financial Services Agency published a research report in April 2026 to study advanced TPCRM practices abroad, while SecurityScorecard found that Singapore recorded the highest third-party breach rate at 71.4% among the countries it analyzed in 2025. South America, the Middle East, and Africa remain smaller in current value, but the third-party risk management market is expanding there as privacy law enforcement, cloud governance, and supply-chain security expectations become more formal across enterprise buyers.
- Archer Technologies, LLC
- Aravo Solutions, Inc.
- BitSight Technologies, Inc.
- Diligent Corporation
- Genpact Limited
- International Business Machines Corporation
- KPMG LLP
- LogicManager, Inc.
- MetricStream, Inc.
- Mitratech Holdings, Inc.
- NAVEX Global, Inc.
- OneTrust, LLC
- Panorays Ltd.
- ProcessUnity, Inc.
- Resolver Inc.
- Intertek SAI Global Pty Limited
- SecurityScorecard, Inc.
- ServiceNow, Inc.
- UpGuard, Inc.
- Venminder, Inc.
Additional Benefits:
- The market estimate (ME) sheet in Excel format
- 3 months of analyst support
TABLE OF CONTENTS
1 INTRODUCTION
- 1.1 Study Assumptions and Market Definition
- 1.2 Scope of the Study
2 RESEARCH METHODOLOGY
3 EXECUTIVE SUMMARY
4 MARKET LANDSCAPE
- 4.1 Market Overview
- 4.2 Impact of Macroeconomic Factors on the Market
- 4.3 Market Drivers
- 4.3.1 Escalating Third-Party Cyberattacks and Ransomware Exposure
- 4.3.2 Tightening Digital Resilience and Outsourcing Regulations
- 4.3.3 Expanding Vendor Ecosystems Across Cloud and SaaS Environments
- 4.3.4 Shift From Periodic Reviews to Continuous Monitoring and Automation
- 4.3.5 Rising Need to Map Nth-Party and Concentration Risk
- 4.3.6 AI Governance Obligations for Model, Data, and Service Providers
- 4.4 Market Restraints
- 4.4.1 High Implementation and Integration Costs Across Siloed Risk Stacks
- 4.4.2 Data Quality, Privacy, and Cross-Border Information Sharing Constraints
- 4.4.3 Low Trust in Static Questionnaires and Inconsistent Evidence Quality
- 4.4.4 Fragmented Ownership Across Procurement, Security, Legal, and Compliance
- 4.5 Industry Value Chain Analysis
- 4.6 Regulatory Landscape
- 4.7 Technological Outlook
- 4.8 Porter's Five Forces Analysis
- 4.8.1 Threat of New Entrants
- 4.8.2 Bargaining Power of Buyers
- 4.8.3 Bargaining Power of Suppliers
- 4.8.4 Threat of Substitutes
- 4.8.5 Competitive Rivalry
5 MARKET SIZE AND GROWTH FORECASTS (VALUE)
- 5.1 By Component
- 5.1.1 Solutions
- 5.1.1.1 Risk Identification and Due Diligence
- 5.1.1.2 Risk Assessment and Scoring
- 5.1.1.3 Continuous Monitoring and Intelligence
- 5.1.1.4 Workflow, Remediation, and Reporting
- 5.1.2 Services
- 5.1.2.1 Professional Services
- 5.1.2.2 Managed Services
- 5.1.1 Solutions
- 5.2 By Deployment Model
- 5.2.1 Cloud
- 5.2.2 On-premises
- 5.3 By Organization Size
- 5.3.1 Large Enterprises
- 5.3.2 Small and Medium-Sized Enterprises
- 5.4 By End User Industry
- 5.4.1 BFSI
- 5.4.2 IT and Telecom
- 5.4.3 Healthcare and Life Sciences
- 5.4.4 Government and Defense
- 5.4.5 Retail and Consumer Goods
- 5.4.6 Manufacturing
- 5.4.7 Energy and Utilities
- 5.4.8 Other End User Industries
- 5.5 By Geography
- 5.5.1 North America
- 5.5.1.1 United States
- 5.5.1.2 Canada
- 5.5.1.3 Mexico
- 5.5.2 South America
- 5.5.2.1 Brazil
- 5.5.2.2 Argentina
- 5.5.2.3 Chile
- 5.5.2.4 Rest of South America
- 5.5.3 Europe
- 5.5.3.1 Germany
- 5.5.3.2 United Kingdom
- 5.5.3.3 France
- 5.5.3.4 Italy
- 5.5.3.5 Spain
- 5.5.3.6 Netherlands
- 5.5.3.7 Russia
- 5.5.3.8 Rest of Europe
- 5.5.4 Asia-Pacific
- 5.5.4.1 China
- 5.5.4.2 Japan
- 5.5.4.3 India
- 5.5.4.4 South Korea
- 5.5.4.5 Singapore
- 5.5.4.6 Rest of Asia-Pacific
- 5.5.5 Middle East
- 5.5.5.1 Saudi Arabia
- 5.5.5.2 United Arab Emirates
- 5.5.5.3 Turkey
- 5.5.5.4 Rest of Middle East
- 5.5.6 Africa
- 5.5.6.1 South Africa
- 5.5.6.2 Nigeria
- 5.5.6.3 Kenya
- 5.5.6.4 Rest of Africa
- 5.5.1 North America
6 COMPETITIVE LANDSCAPE
- 6.1 Market Concentration
- 6.2 Strategic Moves
- 6.3 Market Share Analysis
- 6.4 Company Profiles (includes Global Level Overview, Market Level Overview, Core Segments, Financials as available, Strategic Information, Market Rank/Share, Products and Services, Recent Developments)
- 6.4.1 Archer Technologies, LLC
- 6.4.2 Aravo Solutions, Inc.
- 6.4.3 BitSight Technologies, Inc.
- 6.4.4 Diligent Corporation
- 6.4.5 Genpact Limited
- 6.4.6 International Business Machines Corporation
- 6.4.7 KPMG LLP
- 6.4.8 LogicManager, Inc.
- 6.4.9 MetricStream, Inc.
- 6.4.10 Mitratech Holdings, Inc.
- 6.4.11 NAVEX Global, Inc.
- 6.4.12 OneTrust, LLC
- 6.4.13 Panorays Ltd.
- 6.4.14 ProcessUnity, Inc.
- 6.4.15 Resolver Inc.
- 6.4.16 Intertek SAI Global Pty Limited
- 6.4.17 SecurityScorecard, Inc.
- 6.4.18 ServiceNow, Inc.
- 6.4.19 UpGuard, Inc.
- 6.4.20 Venminder, Inc.
7 MARKET OPPORTUNITIES AND FUTURE OUTLOOK
- 7.1 White-space and Unmet-Need Assessment