

|
시장보고서
상품코드
2072764
클라우드 워크로드 효율 및 탄소인식 스케쥴링 소프트웨어 시장 : 시장 점유율 분석, 업계 동향 및 통계, 성장 예측(2026-2031년)Cloud Workload Efficiency and Carbon-Aware Scheduling Software - Market Share Analysis, Industry Trends & Statistics, Growth Forecasts (2026 - 2031) |
||||||
 Mordor Intelligence
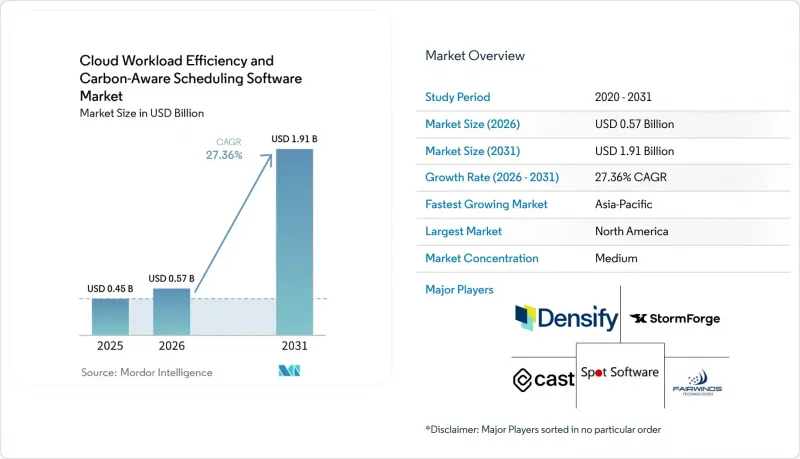
Mordor Intelligence에 의하면, 클라우드 워크로드 효율 및 탄소인식 스케쥴링 소프트웨어 시장 규모는 2025년에 4억 5,000만 달러로 평가되었고, 2026년에 5억 7,000만 달러로 추정되고, 2031년까지 19억 1,000만 달러에 이를 것으로 예측됩니다.
2026-2031년 연평균 성장률(CAGR) 27.36%로 성장할 것으로 전망됩니다.
본 보고서는 구성 요소별(플랫폼 및 서비스), 배포 방식별(클라우드 기반 등), 기업 규모별(대기업 및 중소기업), 용도별(탄소 저감형 워크로드 스케줄링 등), 최종 사용자 산업별(공업 제조 등) 및 지역별로 분류되어 있습니다. 시장 전망치는 금액(달러)으로 표시되어 있습니다.
세계의 클라우드 워크로드 효율 및 탄소인식 스케쥴링 소프트웨어 시장 동향과 인사이트
클라우드 비용과 탄소 배출량의 공동 최적화를 위한 FinOps 도입 확대
클라우드 워크로드 효율 및 탄소인식 스케쥴링 소프트웨어 시장은 탄소 추적이 이미 클라우드 비용 관리를 총괄하고 있는 것과 동일한 운영 모델로 전환되고 있다는 점에서 혜택을 보고 있습니다. 『The State of FinOps 2026』에 따르면, FinOps 실천 사례의 78%가 CTO 또는 CIO 산하 조직에 통합되어 있으며, 이는 최적화 관련 의사결정이 독립된 재무 부서보다는 엔지니어링 팀과 더 가까운 곳에서 처리되게 되었음을 보여줍니다. 같은 2026년 FinOps 데이터셋에 따르면, 응답자의 98%가 이미 FinOps 범위 내에서 AI 지출을 관리하고 있으며, 이는 2025년의 63%에서 증가한 수치입니다. 이는 변동이 심한 컴퓨팅 수요를 일관되게 관리할 수 있는 도구의 필요성을 강조하는 것입니다. 또한 FinOps Foundation은 2026년에 클라우드 지속가능성을 공식 프레임워크 기능으로 지정하고, 기업이 탄소 지표를 멀티클라우드 비용 관리 관행에 통합할 수 있도록 하는 공통된 틀을 제공했습니다. 이러한 변화는 클라우드 워크로드 효율 및 탄소인식 스케쥴링 소프트웨어 시장에 있어 중요합니다. 왜냐하면 구매자들은 더 이상 배출량 시각화 기능을 독립된 대시보드 형태로 구매하는 것이 아니라, 클라우드 운영의 제어 계층의 일부로 인식하고 있기 때문입니다. 조직들이 재무적 책임과 클라우드 배출량 보고를 통합함에 따라, 클라우드 워크로드 효율 및 탄소인식 스케쥴링 소프트웨어 시장은 선택적 도구에서 보다 표준화된 조달 요건으로 전환되고 있습니다.
실시간 워크로드 배치를 가능하게 하는 그리드 탄소 강도 API
클라우드 워크로드 효율 및 탄소인식 스케쥴링 소프트웨어 시장은 외부 그리드 데이터의 급속한 개선에 힘입어 성장하고 있습니다. 현재는 이러한 데이터를 스케줄러의 로직에 직접 반영할 수 있게 되었습니다. Electricity Maps사는 API 지원 범위를 200개 이상의 국가 및 지역으로 확대하고, 100개 이상의 구역에 걸쳐 72시간 후의 전력망 예측 기능을 도입했습니다. 이를 통해 플랫폼은 배치 처리 및 유연한 워크로드에 대해 더 긴 계획 기간을 확보할 수 있게 되었습니다. WattTime은 2025년에 북미 모델을 업데이트하여, 가스 및 석탄 발전에 관한 보다 상세한 지표를 추가했습니다. 이 회사는 이번 출시를 통해 이전 API 버전에 비해 탄소 감축 효과가 25% 향상되었다고 밝혔습니다. 프라운호퍼 ISST의 조사에 따르면, 워크로드를 지리적으로 독일에서 스웨덴, 노르웨이, 프랑스 등의 저탄소 전력망으로 이전함으로써 전력 탄소 강도를 최대 96%까지 줄일 수 있는 한편, 더 깨끗한 시간대로 시간대를 조정함으로써 배출량을 21% 감축할 수 있는 것으로 밝혀졌습니다. IBM의 조사 결과에 따르면, 이 회사의 Caspian 스케줄러는 워크로드의 98%를 예정대로 완료하면서 탄소 배출량을 33% 감축한 것으로 나타났으며, 이는 클라우드 워크로드 효율 및 탄소인식 스케쥴링 소프트웨어 시장에 있어 강력한 실증 사례가 되고 있습니다. 예측 정확도가 향상되고 지리적 커버리지가 확대됨에 따라, 수동 개입보다 자동 배정이 더 현실적인 대안이 될 것이므로, 클라우드 워크로드 효율 및 탄소인식 스케쥴링 소프트웨어 시장은 그 혜택을 누리게 될 것입니다.
서로 다른 클라우드 및 레거시 환경에 걸친 통합의 복잡성
클라우드 워크로드 효율성 및 탄소 인식 스케줄링 소프트웨어 시장은 기업들이 퍼블릭 클라우드, 프라이빗 클라우드, 온프레미스 가상 인프라 및 레거시 스케줄링 시스템을 단일 최적화 계층으로 통합하려는 과정에서 여전히 도입 주기의 지연을 겪고 있습니다. 많은 조직에서는 AWS, Azure, GCP를 VMware 환경, 베어메탈 시스템 및 구형 기업 소프트웨어 환경과 병행하여 운영하고 있으며, 스케줄링 로직을 시작하기도 전부터 실제 데이터 정규화 문제가 발생하고 있습니다. CNCF의 조사에 따르면, 쿠버네티스의 본격적인 운영은 널리 보급되어 있지만, 여전히 초기 단계에 머물러 있거나 클라우드 네이티브 전환이 진행되지 않은 조직도 존재하는 것으로 밝혀졌으며, 전체 도입 기반에서 인프라의 성숙도에 편차가 있다는 점이 부각되었습니다. 클라우드 워크로드 효율 및 탄소인식 스케쥴링 소프트웨어 시장에서 시장의 성숙도 차이로 인해 조달 주기가 길어지고 있습니다. 이는 구매자가 본격적인 최적화 단계로 넘어가기 전에 커넥터, 데이터 매핑, 거버넌스의 일관성을 확보해야 하는 경우가 많기 때문입니다. 이 문제는 구식 배치 처리 시스템이나 규정 준수 대응이 중시되는 인프라가 새로운 컨테이너화된 환경과 공존하고 있는 제조업, 의료계, 정부 기관에서 특히 두드러집니다. 이러한 상황에서도 수요가 사라지는 것은 아니지만, 도입 일정이 장기화되고 초기 소유 비용이 상승함에 따라 클라우드 워크로드 효율 및 탄소인식 스케쥴링 소프트웨어 시장의 단기적인 규모 확대가 둔화되고 있습니다.
부문별 분석
2025년, 플랫폼 솔루션은 클라우드 워크로드 효율 및 탄소인식 스케쥴링 소프트웨어 시장의 70.12%를 차지했으며, 이는 구매자들이 여전히 분산된 단일 기능 도구보다 통합된 오케스트레이션 환경을 선호하고 있음을 보여주었습니다. 클라우드 워크로드 효율 및 탄소인식 스케쥴링 소프트웨어 업계에서 플랫폼은 탄소 데이터 수집, 스케줄링 로직, 비용 가시화, 정책 제어를 단일 환경에 통합하고 있기 때문에 여전히 주요 의사 결정의 중심 역할을 하고 있습니다. 기업들이 지출 관리, 지속가능성 추적, 워크로드 배치를 위해 개별 제품을 사용하는 대신, 단일 운영 계층에서 측정 가능한 성과를 추구하기 때문에 이러한 위치는 중요합니다. 이 부문에서 벤더들이 여전히 가장 중점을 두고 있는 분야는 탄소 인식형 스케줄러, 워크로드 오케스트레이션 엔진, 그리고 AI 기반 배치 도구입니다. 이러한 기능들은 일상적인 인프라 관련 의사결정과 가장 직접적으로 연결되어 있기 때문입니다. 실제로 구성 요소의 조합을 살펴보면, 클라우드 워크로드 효율 및 탄소인식 스케쥴링 소프트웨어 시장에서는 배포 및 튜닝을 지원하기 위해 나중에 서비스가 추가되는 경우에도 여전히 소프트웨어 주도형 제어가 선호되고 있음을 알 수 있습니다.
이 서비스는 2031년까지 연평균 성장률(CAGR) 28.45%를 기록하며 성장할 것으로 예상되며, 클라우드 워크로드 효율 및 탄소인식 스케쥴링 소프트웨어 시장에서 가장 빠르게 성장하는 구성 요소로 자리매김하고 있습니다. 이러한 성장은 특히 사내에 고도의 플랫폼 엔지니어링 팀을 보유하지 않은 구매자층을 중심으로, 도입 컨설팅, 관리형 최적화 프로그램, 교육, 거버넌스 지원에 대한 수요가 증가하고 있음을 반영하고 있습니다. IBM은 Turbonomic을 확장하여 가상 머신의 에너지 소비량 및 탄소 발자국에 대한 보고 기능을 추가했습니다. 이러한 기능 강화는 서비스가 플랫폼 도입을 대체하는 것이 아니라, 대부분의 경우 플랫폼과 병행하여 제공되는 이유를 보여줍니다. 많은 기업 고객의 경우, 초기 컨설팅 계약이 지속적인 매니지드 서비스 계약으로 발전하며, 이를 통해 고객 유지율이 향상되고, 이미 도입한 고객 기반의 장기적인 가치가 높아집니다. 따라서 클라우드 워크로드 효율 및 탄소인식 스케쥴링 소프트웨어 시장에서는 플랫폼 제품이 고객 확보의 계기가 되고, 서비스가 도입을 심화시키며, 시간이 지남에 따라 이용을 안정화시키는 명확한 패턴이 나타납니다.
2025년에는 클라우드 기반 도입이 67.34%의 점유율을 차지했으며, 클라우드 워크로드 효율 및 탄소인식 스케쥴링 소프트웨어 시장 전체에서 기본 운영 모델로 자리 잡았습니다. 이러한 구조는 최신 그리드 데이터를 가져와 최적화 모델을 업데이트하고, 현지에서 별도의 소프트웨어 유지보수 없이도 정책 변경을 적용할 수 있는 SaaS 도구를 구매자들이 선호하는 경향을 반영하고 있습니다. 또한, 이는 이미 퍼블릭 클라우드에서 대규모 워크로드를 운영 중이며, 최적화 계층 자체에서 발생하는 인프라 오버헤드를 최소화하고자 하는 기업의 구매 경향과도 일치합니다. 도입 방식의 관점에서 볼 때, 클라우드 워크로드 효율 및 탄소인식 스케쥴링 소프트웨어 시장 규모는 데이터 수집부터 능동적 제어에 이르기까지의 최단 경로를 제공하는 클라우드 배포를 중심으로 변화했습니다. 클라우드 네이티브 구매자들은 사용량에 따라 확장 가능하고 스케줄러 로직과 함께 신속하게 발전할 수 있는 구독형 도구를 계속해서 선호할 것으로 보이기 때문에 이러한 선도적 지위는 앞으로도 견고하게 유지될 전망입니다.
하이브리드 방식은 2031년까지 연평균 성장률(CAGR) 27.89%를 나타낼 것으로 예측되며, 클라우드 워크로드 효율 및 탄소인식 스케쥴링 소프트웨어 시장에서 가장 빠르게 성장하는 방식이 될 전망입니다. 주요 수요는 기밀성이 높은 워크로드를 여전히 온프레미스에 유지하면서, 특정 기능을 퍼블릭 클라우드로 확장하고 있는 규제 대상 산업 및 공공 부문 환경에서 발생하고 있습니다. 이러한 구매자들은 양측 환경의 탄소 집약도, 비용 위험 및 배치상의 제약을 파악할 수 있는 단일 정책 계층을 필요로 합니다. 하이브리드 방식의 성장은 데이터 거주성에 대한 요구도 반영하고 있습니다. 왜냐하면 기업들은 제한이 있는 워크로드나 주권적인 인프라 요구 사항에 대한 현지 통제권을 포기하지 않으면서도 탄소 배출을 고려한 최적화를 원하는 경우가 많기 때문입니다. 온프레미스 도입 규모는 비교적 작은 편이지만, 외부 연결이 제한되어 있어 실시간 스케줄링 신호를 캐시된 데이터나 로컬 규칙 세트로 대체해야 하는 에어갭 환경이나 중요 인프라 환경에서 계속해서 활용될 것으로 보입니다.
지역별 분석
2025년, 북미는 클라우드 워크로드 효율 및 탄소인식 스케쥴링 소프트웨어 시장 점유율의 34.85%를 차지했으며, 지역별로는 가장 큰 기여를 한 지역이 되었습니다. 이러한 위상은 FinOps의 조기 성숙, 하이퍼스케일러가 제공하는 탄탄한 인프라, 그리고 이미 멀티클라우드와 쿠버네티스를 폭넓게 활용하는 환경을 운영하고 있는 기업들의 방대한 도입 기반을 반영한 것입니다. 캘리포니아주의 SB 253 법안은 해당 주에서 사업을 영위하는 대상 기업에 대해 스코프 1 및 스코프 2 보고 기한을 2026년 8월 10일로 정함으로써, 이 지역의 대응 조치의 시급성을 높였습니다. 또한, 비용 최적화, 쿠버네티스 자동화, 그리고 탄소 배출을 고려한 운영 분야에서 여러 경쟁 업체들이 여전히 미국을 주요 목표로 삼고 있기 때문에 해당 지역의 구매 환경은 활발하고 치열한 경쟁이 지속되고 있습니다. 캐나다와 멕시코 시장 규모는 여전히 작지만, 해당 지역의 자회사들이 전사적인 지속가능성 및 인프라 정책에 부합함에 따라 금융 서비스 및 제조업 분야에서 도입이 확대되고 있습니다.
아시아태평양은 2031년까지 연평균 성장률(CAGR) 28.67%를 기록하며 성장할 것으로 예상되며, 클라우드 워크로드 효율 및 탄소인식 스케쥴링 소프트웨어 시장에서 가장 두드러진 성장을 보일 것으로 전망됩니다. 이 지역의 성장세는 인도, 한국, 호주 및 뉴질랜드, 일본, 중국에서 하이퍼스케일 클라우드가 급속히 확대되고 있는 데 기인하며, 이들 지역에서는 기업의 클라우드 용량과 AI 워크로드가 모두 증가하고 있습니다. 아시아태평양에서는 비용, 용량, 데이터 위치에 대한 제약 조건을 동시에 충족할 수 있는 지역 중심의 워크로드 배치에 대한 수요가 증가함에 따라, 클라우드 워크로드 효율 및 탄소인식 스케쥴링 소프트웨어 시장이 급속히 성장하고 있습니다. 2026년 3월 Wirtschaftsrat이 발표한 데이터센터 관련 보고서에서는 AI를 활용한 워크로드 에너지 관리가 데이터센터 운영의 전략적 과제라고 지적하고 있으며, 이러한 논리는 아시아태평양 전체에서 볼 수 있는 대규모이며 지속적으로 확대되고 있는 디지털 자산에 직접적으로 적용됩니다. 또한, 디지털 정책의 발전과 로컬 클라우드 리전의 부상이 성장을 뒷받침하고 있으며, 이를 통해 성능 요구 사항과 지역별 스케줄링 규칙을 결합하기가 쉬워지고 있습니다.
유럽은 주요 지역 중 가장 성숙한 보고 체계 하에서 운영되고 있기 때문에 클라우드 워크로드 효율 및 탄소인식 스케쥴링 소프트웨어 시장에서 구조적으로 중요한 위치를 계속 차지하고 있습니다. 지침(EU) 2026/470은 대기업의 지속가능성 공시에 관한 규제 체계를 강화하고, 감사 가능한 상세한 클라우드 배출량 데이터에 대한 수요를 유지하고 있습니다. 또한, '기후 중립 데이터센터 협정'에 힘입어 재생에너지와의 연계 목표에 대한 관심도 지속되고 있으며, 이에 따라 유연한 컴퓨팅 리소스를 더 깨끗한 전력 공급 시간대로 전환할 수 있는 도구의 실용적 가치가 높아졌습니다. 브라질을 필두로 한 남미와 중동 및 아프리카는 여전히 초기 단계 시장이지만, 주권 클라우드에 대한 투자, 데이터 거주 규정, 하이퍼스케일러의 사업 확장에 힘입어 이들 지역 전체의 클라우드 워크로드 효율 및 탄소인식 스케쥴링 소프트웨어 시장 전망은 점차 개선되고 있습니다.
기타 혜택 :
- 엑셀 형식 시장 예측(ME) 시트
- 3개월간의 애널리스트 지원
자주 묻는 질문
목차
제1장 서론
제2장 조사 방법
제3장 주요 요약
제4장 시장 구도
제5장 시장 규모 및 성장 예측
제6장 경쟁 구도
제7장 시장 기회 및 향후 전망
AJY 26.07.07According to Mordor Intelligence, the cloud workload efficiency and carbon-aware scheduling software market size is projected to be USD 0.45 billion in 2025, USD 0.57 billion in 2026, and reach USD 1.91 billion by 2031, growing at a CAGR of 27.36% from 2026 to 2031.
This report is Segmented by Component (Platform, and Services), Deployment (Cloud-Based, and More), Enterprise Size (Large Enterprises, and Small and Medium Enterprises), Application (Carbon-Aware Workload Scheduling, and More), End-User Industry (Industrial Manufacturing, and More), and Geography. The Market Forecasts are Provided in Terms of Value (USD).
Global Cloud Workload Efficiency and Carbon-Aware Scheduling Software Market Trends and Insights
Rising FinOps Adoption for Cloud Cost and Carbon Co-Optimization
The cloud workload efficiency and carbon-aware scheduling software market is benefiting from the shift of carbon tracking into the same operating model that already governs cloud cost control. The State of FinOps 2026 showed that 78% of FinOps practices were embedded within CTO or CIO organizations, indicating that optimization decisions are now handled closer to engineering teams than to stand-alone finance groups. The same 2026 FinOps dataset showed that 98% of respondents already managed AI spend within the FinOps scope, up from 63% in 2025, underscoring the need for tools that can consistently govern volatile compute demand. The FinOps Foundation also formally designated cloud sustainability as an official framework capability in 2026, providing enterprises with a common structure for integrating carbon metrics into multi-cloud cost management practices. That shift matters for the cloud workload efficiency and carbon-aware scheduling software market because buyers no longer see emissions visibility as a separate dashboard purchase; they see it as part of the control layer for cloud operations. As organizations combine financial accountability with cloud emissions reporting, the cloud workload efficiency and carbon-aware scheduling software market is moving from discretionary tooling toward a more standard procurement requirement.
Grid Carbon Intensity APIs Enabling Real-Time Workload Placement
The cloud workload efficiency and carbon-aware scheduling software market is also supported by the rapid improvement in external grid data, which can now be fed directly into scheduler logic. Electricity Maps expanded its API coverage to more than 200 countries and territories and introduced 72-hour grid forecasts across more than 100 zones, giving platforms a longer planning window for batch and flexible workloads. WattTime updated its North American model in 2025 with more granular signals for gas and coal generation and said the release enabled 25% more carbon-reduction impact than earlier API versions. Fraunhofer ISST found that shifting workloads spatially from Germany to lower-carbon grids such as Sweden, Norway, or France could reduce electricity carbon intensity by up to 96%, while temporal shifting toward cleaner windows could cut emissions by 21%. IBM Research reported that its Caspian scheduler reduced carbon emissions by 33% while completing 98% of workloads on schedule, providing a strong proof point for the cloud workload efficiency and carbon-aware scheduling software market. As forecast quality improves and geographic coverage deepens, the cloud workload efficiency and carbon-aware scheduling software markets benefit, as automated placement becomes more practical than manual intervention.
Integration Complexity Across Heterogeneous Cloud and Legacy Environments
The cloud workload efficiency and carbon-aware scheduling software market still faces slower adoption cycles as enterprises try to integrate public cloud, private cloud, on-premises virtual infrastructure, and legacy scheduling systems into a single optimization layer. Many organizations run AWS, Azure, and GCP alongside VMware estates, bare-metal systems, and older enterprise software environments, creating real data normalization problems before scheduling logic can even begin. The CNCF survey showed that Kubernetes production use is broad, yet it also identified a group of organizations still in early or non-cloud-native stages, underscoring how uneven infrastructure maturity remains across the installed base. In the cloud workload efficiency and carbon-aware scheduling software market, the uneven maturity of the market lengthens procurement cycles because buyers often need connectors, data mapping, and governance alignment before they can move into active optimization. The issue is more visible in industrial manufacturing, healthcare, and government, where older batch systems and compliance-heavy infrastructure coexist with newer containerized environments. Demand does not disappear under these conditions, but deployment timelines stretch and initial ownership costs rise, which slows near-term scale-up in the cloud workload efficiency and carbon-aware scheduling software market.
Other drivers and restraints analyzed in the detailed report include:
- Kubernetes-Native Automation Demand Across Cloud-Native Enterprises
- Mandatory Sustainability Reporting Increasing Audit-Ready Emissions Controls
- Limited Carbon Data Standardization and Forecast Accuracy
For complete list of drivers and restraints, kindly check the Table Of Contents.
Segment Analysis
Platform solutions captured 70.12% of the cloud workload efficiency and carbon-aware scheduling software market in 2025, which showed that buyers still preferred integrated orchestration environments over fragmented point tools. Within the cloud workload efficiency and carbon-aware scheduling software industry, platforms remain the primary decision-making center because they combine carbon data ingestion, scheduling logic, cost visibility, and policy control in a single environment. That position is important because enterprises want measurable outcomes from a single operational layer rather than separate products for spend control, sustainability tracking, and workload placement. The largest vendor focus inside this category remains carbon-aware schedulers, workload orchestration engines, and AI-based placement tools, since those functions connect most directly with daily infrastructure decisions. In practice, the component mix shows that the cloud workload efficiency and carbon-aware scheduling software markets still favor software-led control, even when services are attached later to support rollout and tuning.
Services are projected to grow at a 28.45% CAGR through 2031, making them the fastest-growing component of the cloud workload efficiency and carbon-aware scheduling software market. That growth reflects demand for implementation consulting, managed optimization programs, training, and governance support, especially among buyers that lack deep internal platform engineering teams. IBM expanded Turbonomic to include energy consumption and carbon footprint reporting for virtual machines, and that kind of enhancement shows why services often sit alongside platform adoption rather than replace it. In many enterprise accounts, the initial consulting engagement becomes an ongoing managed service contract, which improves retention and increases the long-term value of the installed customer base. The cloud workload efficiency and carbon-aware scheduling software market, therefore, shows a clear pattern where platform products open the account, while services deepen adoption and stabilize usage over time.
Cloud-based deployment commanded a 67.34% share in 2025, making it the default operating model across the cloud workload efficiency and carbon-aware scheduling software market. This structure reflects buyer preference for SaaS tools that can ingest fresh grid data, update optimization models, and push policy changes without requiring local software maintenance. It also aligns with the purchasing profile of enterprises that already run significant workloads in the public cloud and want minimal infrastructure overhead from the optimization layer itself. In deployment terms, the cloud workload efficiency and carbon-aware scheduling software market size remained centered on cloud delivery because it offered the fastest route from data collection to active control. That lead position is likely to remain firm because cloud-native buyers continue to favor subscription-based tools that can scale with usage and evolve quickly with scheduler logic.
Hybrid deployment is projected to record a 27.89% CAGR through 2031, making it the fastest-growing mode in the cloud workload efficiency and carbon-aware scheduling software market. The main demand comes from regulated industries and public-sector environments that still keep sensitive workloads on-premises while expanding selected functions to the public cloud. These buyers need a single policy layer that can view carbon intensity, cost exposure, and placement constraints across both sides of the estate. Hybrid growth also reflects data residency needs, because enterprises often want carbon-aware optimization without giving up local control over restricted workloads or sovereign infrastructure requirements. On-premises deployment will remain smaller, but it will continue to serve air-gapped and critical infrastructure settings where external connectivity is limited and live scheduling signals must be replaced with cached data and local rule sets.
Complete Report Scope:
- By Component
- Platform
- Carbon-aware schedulers
- Workload orchestration engines
- Cloud optimization platforms
- Carbon-intensity analytics
- Multi-cloud optimization systems
- AI-based workload placement tools
- Sustainability automation engines
- Services
- Platform
- By Deployment
- Cloud-Based
- Hybrid
- On-Premises
- By Enterprise Size
- Large Enterprises
- Small and Medium Enterprises
- By Application
- Carbon-Aware Workload Scheduling
- Resource Utilization Optimization
- Multi-Cloud Workload Placement
- AI Infrastructure Optimization
- Sustainable DevOps and Testing
- Energy-Efficient Data Processing
- By End-user Industry
- Industrial Manufacturing
- Energy and Utilities
- BFSI
- Retail and Consumer Goods
- IT and Telecom
- Healthcare and Life Sciences
- Government and Public Sector
- Transportation and Logistics
- Other End-user Industries
- By Geography
- North America
- United States
- Canada
- Mexico
- South America
- Brazil
- Argentina
- Rest of South America
- Europe
- Germany
- United Kingdom
- France
- Italy
- Spain
- Russia
- Netherlands
- Rest of Europe
- Asia-Pacific
- China
- Japan
- India
- South Korea
- Australia and New Zealand
- Rest of Asia-Pacific
- Middle East
- Saudi Arabia
- United Arab Emirates
- Rest of Middle East
- Africa
- South Africa
- Nigeria
- Rest of Africa
- North America
Geography Analysis
North America held 34.85% of the cloud workload efficiency and carbon-aware scheduling software market share in 2025, which made it the leading regional contributor. That position reflected early FinOps maturity, deep hyperscaler infrastructure, and a large installed base of enterprises already running multi-cloud and Kubernetes-heavy environments. California SB 253 raised the region's urgency by setting an initial Scope 1 and Scope 2 reporting deadline of August 10, 2026, for qualifying companies that do business in the state. The United States also remains the main focus for several competing vendors in cost optimization, Kubernetes automation, and carbon-aware operations, keeping the regional buying environment active and competitive. Canada and Mexico remain smaller contributors, but adoption is widening in financial services and manufacturing as regional subsidiaries align with enterprise-wide sustainability and infrastructure policies.
Asia-Pacific is projected to grow at 28.67% CAGR through 2031, making it the fastest-growing geography in the cloud workload efficiency and carbon-aware scheduling software market. The region's momentum comes from rapid hyperscale cloud build-out across India, South Korea, Australia and New Zealand, Japan, and China, where enterprise cloud capacity and AI workloads are both increasing. The cloud workload efficiency and carbon-aware scheduling software market is growing rapidly in Asia-Pacific as buyers increasingly need region-aware workload placement that can respond to cost, capacity, and data location constraints simultaneously. The March 2026 Wirtschaftsrat report on data centers described AI-guided workload energy management as a strategic issue for data center operations, and that logic maps directly to the large and expanding digital estates seen across Asia-Pacific. Growth is also supported by digital policy developments and the rise of local cloud regions, which make it easier to combine performance requirements with region-specific scheduling rules.
Europe remains a structurally important part of the cloud workload efficiency and carbon-aware scheduling software market because it operates under the most mature reporting framework among major regions. Directive (EU) 2026/470 reinforced the regulatory framework for large-enterprise sustainability disclosures, keeping demand focused on auditable, granular cloud emissions data. The Climate Neutral Data Center Pact also kept attention on renewable matching targets, which strengthened the practical value of tools that can shift flexible compute toward cleaner power windows. South America, led by Brazil, and the Middle East and Africa remain earlier-stage opportunities, yet sovereign cloud investment, data residency rules, and expanding hyperscaler footprints are gradually improving the case for the cloud workload efficiency and carbon-aware scheduling software market across those regions.
- Cast AI
- Densify, Inc.
- GramLabs, Inc. d/b/a StormForge
- IBM Corporation
- Spot Software, Inc.
- Fairwinds, LLC
- Greenpixie Limited
- Electricity Maps SAS
- WattTime, Inc.
- EasyVirt SAS
- CloudBolt Software, Inc.
- Harness, Inc.
- Turbonomic, Inc.
- ProsperOps, Inc.
- Spot by NetApp (formerly Spot.io)
- Apptio (IBM)
- Kubecost, Inc.
- CloudZero, Inc.
- Replex GmbH
- SAP SE
Additional Benefits:
- The market estimate (ME) sheet in Excel format
- 3 months of analyst support
TABLE OF CONTENTS
1 INTRODUCTION
- 1.1 Study Assumptions and Market Definition
- 1.2 Scope of the Study
2 RESEARCH METHODOLOGY
3 EXECUTIVE SUMMARY
4 MARKET LANDSCAPE
- 4.1 Market Overview
- 4.2 Market Drivers
- 4.2.1 Rising FinOps Adoption for Cloud Cost and Carbon Co-Optimization
- 4.2.2 Grid Carbon Intensity APIs Enabling Real-Time Workload Placement
- 4.2.3 Kubernetes-Native Automation Demand Across Cloud-Native Enterprises
- 4.2.4 Mandatory Sustainability Reporting Increasing Audit-Ready Emissions Controls
- 4.2.5 Multi-Cloud Expansion Creating Region-Aware Scheduling Demand
- 4.2.6 AI and GPU Workloads Increasing Elasticity and Energy Efficiency Needs
- 4.3 Market Restraints
- 4.3.1 Integration Complexity Across Heterogeneous Cloud and Legacy Environments
- 4.3.2 Limited Carbon Data Standardization and Forecast Accuracy
- 4.3.3 Workload Performance Risk from Aggressive Carbon-Aware Deferral Policies
- 4.3.4 Data Residency and Compliance Constraints Restricting Cross-Region Scheduling
- 4.4 Industry Value-Chain Analysis
- 4.5 Impact of Macroeconomic Factors on the Market
- 4.6 Regulatory Landscape
- 4.7 Technological Outlook
- 4.8 Porter's Five Forces Analysis
- 4.8.1 Threat of New Entrants
- 4.8.2 Bargaining Power of Buyers
- 4.8.3 Bargaining Power of Suppliers
- 4.8.4 Threat of Substitutes
- 4.8.5 Intensity of Competitive Rivalry
5 MARKET SIZE AND GROWTH FORECASTS (VALUE)
- 5.1 By Component
- 5.1.1 Platform
- 5.1.1.1 Carbon-aware schedulers
- 5.1.1.2 Workload orchestration engines
- 5.1.1.3 Cloud optimization platforms
- 5.1.1.4 Carbon-intensity analytics
- 5.1.1.5 Multi-cloud optimization systems
- 5.1.1.6 AI-based workload placement tools
- 5.1.1.7 Sustainability automation engines
- 5.1.2 Services
- 5.1.1 Platform
- 5.2 By Deployment
- 5.2.1 Cloud-Based
- 5.2.2 Hybrid
- 5.2.3 On-Premises
- 5.3 By Enterprise Size
- 5.3.1 Large Enterprises
- 5.3.2 Small and Medium Enterprises
- 5.4 By Application
- 5.4.1 Carbon-Aware Workload Scheduling
- 5.4.2 Resource Utilization Optimization
- 5.4.3 Multi-Cloud Workload Placement
- 5.4.4 AI Infrastructure Optimization
- 5.4.5 Sustainable DevOps and Testing
- 5.4.6 Energy-Efficient Data Processing
- 5.5 By End-user Industry
- 5.5.1 Industrial Manufacturing
- 5.5.2 Energy and Utilities
- 5.5.3 BFSI
- 5.5.4 Retail and Consumer Goods
- 5.5.5 IT and Telecom
- 5.5.6 Healthcare and Life Sciences
- 5.5.7 Government and Public Sector
- 5.5.8 Transportation and Logistics
- 5.5.9 Other End-user Industries
- 5.6 By Geography
- 5.6.1 North America
- 5.6.1.1 United States
- 5.6.1.2 Canada
- 5.6.1.3 Mexico
- 5.6.2 South America
- 5.6.2.1 Brazil
- 5.6.2.2 Argentina
- 5.6.2.3 Rest of South America
- 5.6.3 Europe
- 5.6.3.1 Germany
- 5.6.3.2 United Kingdom
- 5.6.3.3 France
- 5.6.3.4 Italy
- 5.6.3.5 Spain
- 5.6.3.6 Russia
- 5.6.3.7 Netherlands
- 5.6.3.8 Rest of Europe
- 5.6.4 Asia-Pacific
- 5.6.4.1 China
- 5.6.4.2 Japan
- 5.6.4.3 India
- 5.6.4.4 South Korea
- 5.6.4.5 Australia and New Zealand
- 5.6.4.6 Rest of Asia-Pacific
- 5.6.5 Middle East
- 5.6.5.1 Saudi Arabia
- 5.6.5.2 United Arab Emirates
- 5.6.5.3 Rest of Middle East
- 5.6.6 Africa
- 5.6.6.1 South Africa
- 5.6.6.2 Nigeria
- 5.6.6.3 Rest of Africa
- 5.6.1 North America
6 COMPETITIVE LANDSCAPE
- 6.1 Market Concentration
- 6.2 Strategic Moves
- 6.3 Market Share Analysis
- 6.4 Company Profiles (includes Global Level Overview, Market Level Overview, Core Segments, Financials as available, Strategic Information, Market Rank/Share, Products and Services, Recent Developments)
- 6.4.1 Cast AI
- 6.4.2 Densify, Inc.
- 6.4.3 GramLabs, Inc. d/b/a StormForge
- 6.4.4 IBM Corporation
- 6.4.5 Spot Software, Inc.
- 6.4.6 Fairwinds, LLC
- 6.4.7 Greenpixie Limited
- 6.4.8 Electricity Maps SAS
- 6.4.9 WattTime, Inc.
- 6.4.10 EasyVirt SAS
- 6.4.11 CloudBolt Software, Inc.
- 6.4.12 Harness, Inc.
- 6.4.13 Turbonomic, Inc.
- 6.4.14 ProsperOps, Inc.
- 6.4.15 Spot by NetApp (formerly Spot.io)
- 6.4.16 Apptio (IBM)
- 6.4.17 Kubecost, Inc.
- 6.4.18 CloudZero, Inc.
- 6.4.19 Replex GmbH
- 6.4.20 SAP SE
7 MARKET OPPORTUNITIES AND FUTURE OUTLOOK
- 7.1 White-Space and Unmet-Need Assessment


