|
시장보고서
상품코드
2072765
서버리스 및 컨테이너 지속가능성 소프트웨어 시장 : 시장 점유율 분석, 업계 동향 및 통계, 성장 예측(2026-2031년)Serverless and Container Sustainability Software - Market Share Analysis, Industry Trends & Statistics, Growth Forecasts (2026 - 2031) |
||||||
 Mordor Intelligence
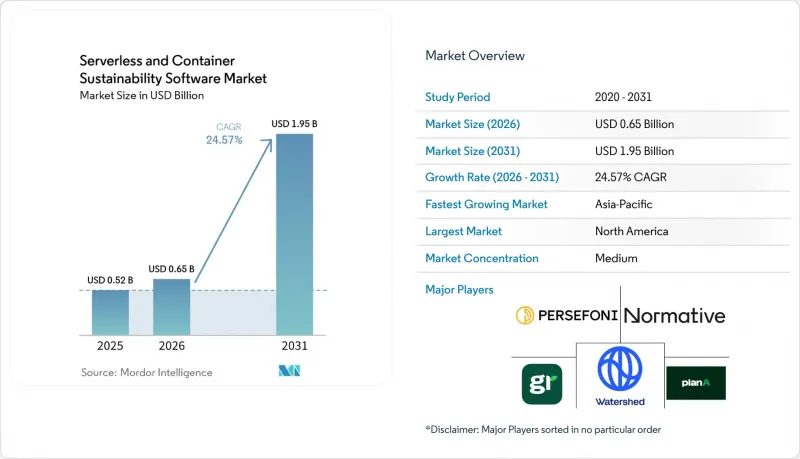
Mordor Intelligence에 의하면, 서버리스 및 컨테이너 지속가능성 소프트웨어 시장 규모는 2025년에 5억 2,000만 달러로 평가되었고, 2026년 6억 5,000만 달러로 추정되고, 2031년까지 19억 5,000만 달러에 이를 것으로 예측되며, 예측 기간(2026-2031년) CAGR은 24.57%를 나타낼 전망입니다.
본 보고서는 배포 방식별(클라우드 기반, 하이브리드, 온프레미스), 구성 요소별(소프트웨어 및 서비스), 기업 규모별(대기업, 중소기업), 최종 사용자 산업별(제조업, 에너지 및 유틸리티, 은행, 금융서비스 및 보험(BFSI), 소매 및 소비재 등) 및 지역별로 분류되어 있습니다. 시장 전망치는 금액(달러)으로 표시되어 있습니다.
세계의 서버리스 및 컨테이너 지속가능성 소프트웨어 시장 동향과 인사이트
클라우드 네이티브 워크로드에 대한 스코프 3 보고 압박이 커지고 있습니다.
대기업들의 경우, 공식 배출량 보고에서 클라우드 운영을 간과하기가 점점 더 어려워지고 있으며, 이것이 서버리스 및 컨테이너 기반 지속가능성 소프트웨어 시장 전체 수요를 견인하고 있습니다. 2026년 2월 유럽연합 이사회가 발표한 개정판 CSRD(기업 지속가능성 보고 지침) 프레임워크는 직원 수 1,000명 이상이고 매출액이 4억 5,000만 유로 이상인 기업에 적용됩니다(사용자 초안에서는 5억 850만 달러로 환산됨). 이로 인해 기업들은 디지털 지속가능성 공시의 질을 높여야 한다는 강력한 압력을 계속해서 받고 있습니다. 또한 AWS는 클라우드 고객을 대상으로 스코프 1, 스코프 2, 스코프 3 보고를 일원화한 통합형 '지속가능성 콘솔'을 도입함으로써 클라우드 배출량 데이터의 운영상 중요성을 높였습니다. 클라우드 제공업체가 이 데이터를 제공한다고 해도, 기업에는 여전히 쿠버네티스 네임스페이스나 서버리스 함수 수준에서 데이터를 할당하고 감사할 수 있는 소프트웨어가 필요하며, 이러한 측면에서 전문 플랫폼이 계속해서 예산을 확보하고 있습니다. 이로 인해 하이퍼스케일러의 보고 체계가 성숙해지더라도 타사 도구가 대체되는 것이 아니라, 엔지니어링 팀과 컴플라이언스 팀 전체가 데이터를 활용할 수 있게 해주는 소프트웨어에 대한 수요가 증가하는 파급 효과가 나타나고 있습니다. 또한, 탄소 가시성과 마찬가지로 감사 대응 체제가 중요시되는 규제 대상 부문에서도 수요가 더욱 증가하고 있습니다.
Kubernetes 운영에서의 FinOps와 GreenOps의 융합
서버리스 및 컨테이너 지속가능성 소프트웨어 시장은 클라우드 비용 거버넌스와 탄소 관리가 하나의 일상 업무로 통합되면서 형성되고 있습니다. FinOps Foundation은 2026년 업데이트에서 '클라우드 지속가능성'을 프레임워크의 기능으로 공식적으로 자리매김함으로써, GreenOps를 지속가능성 활동의 비공식적인 연장선이 아닌, 확립된 운영 영역으로 인식하게 되었습니다. Kubernetes 환경에서는 이미 리사이징에 활용되고 있는 포드 수준의 가동률 데이터를 탄소 배출량 귀속 분석에도 활용할 수 있으므로, 별도의 측정 스택이 필요하지 않아 엔지니어링 팀의 도입이 용이해집니다. 2025년에 발표된 조사에 따르면, 탄소 배출량을 고려한 시간축에 기반한 워크로드 전환을 통해, 설정된 서비스 제한 범위 내에서 기업의 처리 부하로 인한 배출량을 줄일 수 있는 것으로 나타났습니다. 이는 상업적으로도 중요한 의미를 지닙니다. 왜냐하면 FinOps 팀은 이미 플랫폼 구매에 영향력을 행사하고 있으며, 이들이 참여함으로써 비용 관리와 탄소 배출 관리를 결합한 소프트웨어의 판매 주기가 단축되기 때문입니다. 또한, 멀티 클러스터 환경 전체에 걸쳐 비용 효율성, 워크로드 배치, 출력 성능을 하나의 인터페이스를 통해 제시할 수 있는 벤더가 유리해집니다.
일시적인 서버리스 실행 시 배출량 귀속의 불완전성
서버리스 및 컨테이너 기반 지속가능성 소프트웨어 시장의 근본적인 제약은 서버리스 함수가 안정적이고 격리된 컴퓨팅 경계 내에서 실행되지 않는다는 점에 있습니다. BSR은 소프트웨어 기업에 대한 스코프 3 조사에서 사용 단계의 측정이 대부분의 경우 직접적인 워크로드 추적이 아닌 간접적인 가정에 의존하기 때문에 비교 가능하고 일관성 있는 클라우드 배출량 산정이 여전히 어렵다고 지적하고 있습니다. SoCC 2024에서 발표된 FaasMeter 프레임워크를 활용한 연구에 따르면, 병렬 함수 호출 전체에 걸친 샤플레 값 분해를 통해 배출량 할당 정확도가 향상되었으나, 이 기법은 계산상의 오버헤드를 유발하여 대규모 실시간 배포를 어렵게 만들고 있습니다. 이로 인해 공급업체는 곤란한 처지에 놓이게 되었습니다. 왜냐하면 배출량 귀속의 정확성에 대해 자신 있게 주장할 경우, 고객의 산출 결과가 하이퍼스케일러의 방법과 다를 때 감사 위험에 노출될 가능성이 있기 때문입니다. 이 문제는 규제 산업에서 더욱 심각합니다. 이러한 업계에서는 구매자들이 단순히 대략적인 추정치를 제시하는 데 그치지 않고, 보증 심사를 통과할 수 있는 도구를 원하고 있습니다. 함수 수준에서의 지침이 더욱 일관성을 갖추게 될 때까지, 조사 방법론상의 불확실성이 조달에 대한 신뢰를 계속해서 저해할 것입니다.
부문별 분석
2025년, 서버리스 및 컨테이너 지속가능성 소프트웨어 시장에서 클라우드 기반 도입이 67.12%의 점유율을 차지했습니다. 이는 측정 도구를 모니터링 대상 워크로드와 동일한 환경에 배치함으로써 얻게 되는 자연스러운 이점을 반영한 것입니다. 이 모델은 텔레메트리 지연을 줄이고 불필요한 데이터 유출을 방지하는 동시에, 배출 계수 및 이용 정보를 제공하는 클라우드 공급자의 API와 보다 직접적으로 연동됩니다. 또한, 클라우드 우선 아키텍처는 많은 기업이 이미 서버리스 함수나 컨테이너화된 용도를 운영하고 있는 방식과 부합하므로, 도입을 가속화하고 통합에 따른 마찰을 줄여줍니다. 규제 대상 기업들이 온프레미스 쿠버네티스 클러스터와 클라우드 기반 분석 레이어를 연동함에 따라, 서버리스 및 컨테이너 지속가능성 소프트웨어 시장의 하이브리드 배포는 2031년까지 연평균 성장률(CAGR) 25.34%로 확대될 것으로 전망됩니다. 이러한 경향은 데이터 상주 규정에 따라 완전한 클라우드 집중화가 현실적으로 어려운 의료 및 금융 서비스 등의 분야에서 특히 두드러집니다.
온프레미스 구축 규모는 여전히 작지만, 에어갭이 적용된 인프라로 인해 클라우드 기반 도구의 사용이 제한되는 정부 및 국방 분야에서는 여전히 전략적 중요성을 지니고 있습니다. 벤더의 입장에서 볼 때, 이는 하이브리드 환경에서 성공하기 위해서는 엣지에서 실행 가능하며, 안정적인 클라우드 접속이 없어도 데이터 수집을 계속하고, 동기화가 허용되는 시점에 기록을 업로드할 수 있는 텔레메트리 에이전트에 의존해야 함을 의미합니다. 경쟁 측면에서의 분화는 점점 더 뚜렷해지고 있습니다. 기존 하이퍼스케일러의 탄소 배출 데이터를 수집하는 API 주도형 플랫폼과, 보다 상세한 귀속 분석을 수행하기 위해 쿠버네티스 클러스터 내에 직접 수집기를 배치하는 측정 주도형 플랫폼입니다. 전자의 접근 방식은 속도 면에서 우위를 차지하는 경우가 많은 반면, 후자는 컨테이너와 서버리스 실행이 혼재된 멀티 클라우드 환경에서 더 중요하게 여겨지는 경향이 있습니다. 엔터프라이즈 환경의 분산화가 진행됨에 따라, 구매자들은 여러 클러스터와 운영 거점에 걸친 지속가능성 지표를 통합하여 관리할 수 있는 통합 제어 플레인을 더욱 중요하게 여기고 있습니다.
2025년에는 모니터링, 분석, 최적화, 대시보드, 배출량 보고 모듈에 대한 수요에 힘입어 소프트웨어가 서버리스 및 컨테이너 기반 지속가능성 소프트웨어 시장의 72.12%를 차지했습니다. 이러한 추세는 지출의 상당 부분이 여전히 제품 부문에 집중되어 있다는 사실을 반영하고 있으며, 기업들은 컨테이너의 효율성과 워크로드 수준의 탄소 배출량을 직접 파악할 수 있기를 원했습니다. 한편, 많은 고객이 여전히 텔레메트리 설정, 멀티클라우드 데이터 정규화, 그리고 출력 결과를 공식 보고 프로세스에 연동하는 데 대한 지원을 필요로 하고 있기 때문에 서비스 부문은 2031년까지 연평균 성장률(CAGR) 26.12%로 성장할 것으로 전망됩니다. 탄소 대응 스케줄링 도구는 여전히 소프트웨어 분야에서 가장 빠르게 성장하는 분야 중 하나이며, 2025년에 발표된 CarbonFlex의 조사에 따르면, 과거 클러스터 데이터에 대한 지속적인 학습을 통해 탄소 비대응 기준선과 비교해 배출량을 57% 감축할 수 있었던 것으로 나타났습니다. 또한, 기업들이 단순한 운영 대시보드에 그치지 않고 엔지니어링 텔레메트리 데이터를 공개 가능한 형식으로 변환할 수 있는 소프트웨어를 필요로 하고 있기 때문에 보고서 작성 도구에 대한 수요도 급속히 증가하고 있습니다.
오픈소스 도구는 벤더가 이익률을 유지할 수 있는 영역을 변화시키고 있습니다. CNCF의 Kepler 프로젝트는 기본 측정 계층을 지속적으로 개선하고 있으며, 2026년 2월에 출시된 버전 0.11.4에서는 기존의 컨테이너 및 포드 수준 모니터링 기능에 더해 GPU 전력 메트릭이 추가되었습니다. 이에 따라 상용 서비스 제공업체들은 최적화 로직, 멀티클라우드 표준화, 감사 대응 보고서 작성 등 부가가치가 더 높은 분야로 사업 영역을 전환하고 있습니다. 서비스 측면에서도 단순한 설정 작업에 그치지 않고, 관리형 GreenOps 지원으로 전환되고 있습니다. 여기에는 공급업체가 텔레메트리 유지 관리 및 업데이트 요인 관리를 수행하고, 장기적으로 공시 자료 작성을 지원하는 것이 포함됩니다. 운영 워크플로가 확립되면 고객이 기존 서비스 관계를 대체하기 어려워지므로, 이러한 변화는 공급업체의 수익 안정성을 높일 것으로 보입니다.
지역별 분석
2025년 북미는 서버리스 및 컨테이너 기반 지속가능성 소프트웨어 시장 점유율의 34.56%를 차지했습니다. 이는 클라우드의 성숙도가 빠르게 높아지고, 서버리스 워크로드의 집중도가 높으며, FinOps 관행이 널리 보급되고 있는 데 기인합니다. 또한, SB 253 및 SB 261과 같은 캘리포니아주의 규제로 인해 대규모 보고 의무를 지고 있는 기업들은 클라우드 환경 전반에 걸친 운영상 배출량의 가시성을 높일 필요성이 더욱 커졌으며, 이는 전문 소프트웨어에 대한 지출을 촉진했습니다. 게다가 FinOps Foundation이 2026년 프레임워크 업데이트를 통해 GreenOps를 공식적으로 포함시킴에 따라, 이 분야의 성장세는 더욱 가속화되었습니다. 이로써 클라우드의 탄소 최적화는 기업의 운영 모델 내에서 보다 명확한 위치를 차지하게 되었습니다. 캐나다와 멕시코는 미국이 주도하는 ESG 프로그램과 연계된 국경을 초월한 기업 조달을 통해 기여했으나, 현지 규제의 엄격성은 미국이나 유럽연합(EU)에 비해 여전히 낮은 수준에 머물러 있었습니다. 해당 지역은 상업적 우위를 유지했으나, 유럽의 소프트웨어 공급업체들은 CSRD 관련 구매 결정을 내리는 구매자 근처에 위치해 있었기 때문에 계속해서 압박을 가했습니다.
유럽은 서버리스 및 컨테이너 기반 지속가능성 소프트웨어 시장에서 여전히 가장 강력한 규제 수요의 중심지로 자리매김했습니다. 이는 공시 의무로 인해 구매자들이 클라우드 활동과 공식적인 지속가능성 보고서를 연계할 수 있는 시스템을 요구하게 되었기 때문입니다. 2026년 2월에 확정된 개정판 CSRD 프레임워크는 적용 대상인 대기업에 대한 이러한 압박을 유지하면서, 보다 체계적인 배출량 관리 워크플로우에 대한 수요를 뒷받침했습니다. 독일, 영국, 프랑스, 네덜란드는 보다 광범위한 지속가능성 플랫폼과 함께 클라우드 전용 모듈이 높이 평가되는 사례가 증가함에 따라, 기업들의 도입이 가장 활발한 시장으로 두각을 나타냈습니다. 2025년에 발표된 독일의 학술 연구 역시 서버리스 기술, 확장 가능한 마이크로서비스, 효율적인 데이터 관리를 측정 가능한 탄소 배출 감축과 연계함으로써, 보다 친환경적인 클라우드 운영의 기술적 근거를 뒷받침했습니다. 이로 인해 엔지니어링 텔레메트리 및 감사 대응이 가능한 보고서 출력을 결합한 소프트웨어에 대한 수요 측면에서 유럽이 계속해서 중심적인 위치를 차지하게 되었습니다.
아시아태평양은 2031년까지 연평균 성장률(CAGR) 27.45%를 나타낼 것으로 예측되며, 서버리스 및 컨테이너 기반 지속가능성 소프트웨어 시장에서 가장 빠르게 성장하는 지역이 될 전망입니다. 중국은 이러한 성장의 상당 부분을 차지하고 있으며, 상장 기업들이 2026년까지 강화될 지속가능성 보고 요건에 대응해 나가고 있는 반면, 싱가포르는 기후 변화 정보 공개 분야에서 계속해서 지역 내 강력한 기준을 제시하고 있습니다. 인도와 한국도 기술 집약적 부문에서 급속한 컨테이너화를 통해 기여하고 있으며, 이에 따라 향후 워크로드 수준의 모니터링 및 탄소 배출량 보고가 필요해질 도입 기반이 확대되고 있습니다. 일본에서는 2026년 3월, NTT 그룹, NEC, 히타치, 후지쯔가 국가가 인정한 체계에 따라 소프트웨어 제품을 위한 '제조부터 폐기까지'의 CO2 조사 방법을 공개하며, 표준화를 향한 중요한 신호를 보냈습니다. 남미, 중동 및 아프리카는 여전히 소규모 시장에 머물러 있으며, 도입의 복잡성과 Kubernetes 네이티브 도구의 배포 파트너가 부족한 점이 보급을 저해하고 있지만, 브라질과 사우디아라비아에서는 해당 지역 내에서 가장 강력한 성장세를 보였습니다.
기타 혜택 :
- 엑셀 형식 시장 예측(ME) 시트
- 3개월간의 애널리스트 지원
자주 묻는 질문
목차
제1장 서론
제2장 조사 방법
제3장 주요 요약
제4장 시장 구도
제5장 시장 규모 및 성장 예측
제6장 경쟁 구도
제7장 시장 기회 및 향후 전망
AJY 26.07.07According to Mordor Intelligence, the serverless and container sustainability software market size was valued at USD 0.52 billion in 2025 and estimated to grow from USD 0.65 billion in 2026 to reach USD 1.95 billion by 2031, at a CAGR of 24.57% during the forecast period (2026-2031).
This report is Segmented by Deployment (Cloud-Based, Hybrid, and On-Premises), Component (Software, and Services), Enterprise Size (Large Enterprises, and Small and Medium Enterprises), End-User Industry (Industrial Manufacturing, Energy and Utilities, BFSI, Retail and Consumer Goods, and More), and Geography. The Market Forecasts are Provided in Terms of Value (USD).
Global Serverless and Container Sustainability Software Market Trends and Insights
Rising Scope 3 Reporting Pressure on Cloud-Native Workloads
Cloud operations are becoming harder for large enterprises to avoid in formal emissions reporting, which is driving demand across the serverless and container sustainability software markets. The revised CSRD framework published by the Council of the European Union in February 2026 applies to companies with more than 1,000 employees and a turnover above EUR 450 million, which the user draft converted to USD 508.5 million, and this continues to put pressure on enterprises to improve the quality of their digital sustainability disclosures. AWS also expanded the operational relevance of cloud emissions data by introducing a unified Sustainability Console that consolidated Scope 1, Scope 2, and Scope 3 reporting into a single place for cloud customers. Once cloud providers make this data available, enterprises still need software that can allocate and audit it at the Kubernetes namespace or serverless function level, and that is where specialized platforms continue to win budget. This creates a pull-through effect, where hyperscaler reporting maturity does not replace third-party tools but instead increases the need for software that makes the data usable across engineering and compliance teams. It also strengthens demand in regulated sectors where audit readiness matters as much as carbon visibility.
FinOps and GreenOps Convergence In Kubernetes Operations
The serverless and container sustainability software market is also being shaped by the convergence of cloud cost governance and carbon management into a single day-to-day discipline. The FinOps Foundation formalized Cloud Sustainability as a framework capability in its 2026 update, thereby recognizing GreenOps as a recognized operating area rather than an informal extension of sustainability work. In Kubernetes environments, pod-level utilization data already used for rightsizing can also support carbon attribution, reducing the need for separate measurement stacks and making adoption easier for engineering teams. Research published in 2025 showed that carbon-aware temporal workload shifting could lower emissions for enterprise processing loads while remaining within configured service limits. This matters commercially because FinOps teams already influence platform purchases, and their involvement shortens sales cycles for software that combines cost and carbon controls. It also favors vendors that can present a single interface for cost efficiency, workload placement, and emissions performance across multi-cluster environments.
Incomplete Emissions Attribution For Ephemeral Serverless Execution
A core limitation for the serverless and container sustainability software market is that serverless functions do not run inside stable and isolated compute boundaries. BSR noted in its Scope 3 work on software companies that comparable and consistent cloud emissions accounting remains difficult because use-phase measurement often relies on indirect assumptions rather than direct workload tracing. Research presented at SoCC 2024 using the FaasMeter framework improved allocation accuracy via Shapley value decomposition across concurrent function invocations, but the method also introduced computational overhead, making real-time deployment at scale harder. This leaves vendors in a difficult position, as strong claims about attribution precision can expose them to audit risk when customer outputs differ from hyperscaler methods. The problem is even sharper in regulated industries where buyers want tools that can survive assurance reviews, not just produce directional estimates. Until guidance becomes more consistent at the function level, methodological uncertainty will continue to slow procurement confidence.
Other drivers and restraints analyzed in the detailed report include:
- EU CSRD and Digital Reporting Readiness For Cloud Operations
- Serverless Pricing Transparency Improving Sustainability Buy-In
- Limited Standardization of Workload-Level Carbon Methodologies
For complete list of drivers and restraints, kindly check the Table Of Contents.
Segment Analysis
Cloud-based deployments held 67.12% of the serverless and container sustainability software market share in 2025, which reflected the natural benefit of placing measurement tools in the same environment as the workloads they monitor. This model reduces telemetry delay, avoids unnecessary data egress, and works more directly with cloud-provider APIs that supply emissions factors and usage information. The cloud-first architecture also aligns with how many enterprises already run serverless functions and containerized applications, making deployment faster and reducing integration friction. Hybrid deployments are projected to expand at a 25.34% CAGR through 2031 in the serverless and container sustainability software market, as regulated enterprises connect on-premises Kubernetes clusters with cloud-based analytics layers. That pattern is strongest in sectors such as healthcare and financial services, where data residency rules make full cloud centralization less practical.
On-premises deployments remained smaller, but they still carried strategic weight in government and defense environments where air-gapped infrastructure limited the use of cloud-based tools. For vendors, this means hybrid success depends on telemetry agents that can run at the edge, keep collecting data without steady cloud access, and upload records later when synchronization is allowed. The competitive split is becoming clearer: API-led platforms that pull existing hyperscaler carbon data, and instrumentation-led platforms that place collectors directly into Kubernetes clusters for more granular attribution. The first approach often wins on speed, while the second tends to matter more in multi-cloud estates with mixed container and serverless execution. As enterprise environments become more distributed, buyers are placing greater value on unified control planes that can aggregate sustainability metrics across multiple clusters and operating locations.
Software captured 72.12% of the serverless and container sustainability software market in 2025, supported by demand for monitoring, analytics, optimization, dashboarding, and emissions reporting modules. This lead reflected the fact that most spending still centered on the product layer, where enterprises wanted direct visibility into container efficiency and workload-level carbon outputs. At the same time, services are projected to grow at a 26.12% CAGR through 2031 because many customers still need help configuring telemetry, normalizing multi-cloud data, and connecting outputs to formal reporting processes. Carbon-aware scheduling tools remain one of the strongest software growth areas, and CarbonFlex research published in 2025 showed a 57% reduction in emissions relative to a carbon-agnostic baseline through continuous learning over historical cluster data. Reporting tools are also rising quickly because enterprises need software that can turn engineering telemetry into disclosure-ready outputs rather than stopping at operational dashboards.
Open-source tooling is changing where vendors can defend margins. CNCF's Kepler project continued to improve the basic measurement layer, and version 0.11.4 added GPU power metrics in February 2026 alongside its existing container and pod-level monitoring capabilities. That is pushing commercial providers toward higher-value areas such as optimization logic, multi-cloud normalization, and audit-ready reporting. The services side is also moving beyond setup work and toward managed GreenOps support, where vendors maintain telemetry, update factors, and help prepare disclosures over time. This shift should improve revenue stability for vendors because embedded service relationships are harder for customers to replace once the operational workflow is in place.
Complete Report Scope:
- By Deployment
- Cloud-Based
- Hybrid
- On-Premises
- By Component
- Software
- Container sustainability analytics
- Kubernetes energy monitoring
- Carbon-aware scheduling
- Resource optimization engines
- Sustainability dashboards
- Emissions reporting tools
- Services
- Software
- By Enterprise Size
- Large Enterprises
- Small and Medium Enterprises
- By End-user Industry
- Industrial Manufacturing
- Energy and Utilities
- BFSI
- Retail and Consumer Goods
- IT and Telecom
- Healthcare and Life Sciences
- Government and Public Sector
- Transportation and Logistics
- Other End-user Industries
- By Geography
- North America
- United States
- Canada
- Mexico
- South America
- Brazil
- Argentina
- Rest of South America
- Europe
- Germany
- United Kingdom
- France
- Italy
- Spain
- Russia
- Netherlands
- Rest of Europe
- Asia-Pacific
- China
- Japan
- India
- South Korea
- Australia and New Zealand
- Rest of Asia-Pacific
- Middle East
- Saudi Arabia
- United Arab Emirates
- Rest of Middle East
- Africa
- South Africa
- Nigeria
- Rest of Africa
- North America
Geography Analysis
North America held 34.56% of the serverless and container sustainability software market share in 2025, supported by early cloud maturity, high concentrations of serverless workloads, and the broader adoption of FinOps practices. California rules, such as SB 253 and SB 261, also strengthened the need for large filers to improve operational emissions visibility across cloud environments, which helped support spending on specialized software. The FinOps Foundation further reinforced regional momentum when it formally positioned GreenOps within its 2026 framework update, which gave cloud carbon optimization a clearer home inside enterprise operating models. Canada and Mexico contributed through cross-border enterprise procurement tied to U.S.-led ESG programs, even though local regulatory intensity remained lower than in the United States and the European Union. The region maintained its commercial lead, but European software vendors continued to exert pressure, as they were positioned close to buyers making CSRD-related purchasing decisions.
Europe remained the strongest regulatory demand center for the serverless and container sustainability software market because disclosure obligations pushed buyers toward systems that could connect cloud activity with formal sustainability reporting. The revised CSRD framework, confirmed in February 2026, maintained this pressure on large in-scope enterprises and supported demand for more structured emissions workflows. Germany, the United Kingdom, France, and the Netherlands stood out as the most active markets for enterprise adoption, as cloud-specific modules were increasingly evaluated alongside broader sustainability platforms. Germany-based academic work published in 2025 also reinforced the technical case for greener cloud operations by linking serverless technologies, scalable microservices, and efficient data management with measurable carbon reductions. This helped keep Europe at the center of demand for software that combines engineering telemetry with audit-ready reporting output.
Asia-Pacific is projected to expand at a 27.45% CAGR through 2031, making it the fastest-growing region in the serverless and container sustainability software market. China is a major part of that growth because listed companies are moving under stronger sustainability reporting expectations by 2026, while Singapore continues to provide a strong regional baseline for climate disclosure. India and South Korea are also contributing through rapid containerization across technology-intensive sectors, which expands the installed base that eventually needs workload-level monitoring and carbon reporting. Japan sent an important signal of standardization in March 2026 when NTT Group, NEC, Hitachi, and Fujitsu published a cradle-to-grave CO2 calculation methodology for software products under a nationally recognized framework. South America, the Middle East, and Africa remained smaller markets, with adoption held back by implementation complexity and fewer deployment partners for Kubernetes-native tooling, although Brazil and Saudi Arabia showed the strongest regional momentum.
- Watershed Technology, Inc.
- Persefoni AI, Inc.
- Plan A Sustainable Technologies GmbH
- Normative AB
- Greenly SAS
- Emitwise Limited
- Sinai Technologies, Inc.
- Sweep SAS
- Greenomy S.A.
- Climatiq Ltd.
- Novisto Inc.
- Altruistiq Limited
- Sustainability Cloud AG
- Cority Software Inc.
- Benchmark Gensuite, LLC
- Datadog Inc
- Sphera Solutions, Inc.
- Enablon North America Corporation
- Intelex Technologies ULC
- Osapiens Holding GmbH
Additional Benefits:
- The market estimate (ME) sheet in Excel format
- 3 months of analyst support
TABLE OF CONTENTS
1 Introduction
- 1.1 Study Assumptions and Market Definition
- 1.2 Scope of the Study
2 Research Methodology
3 Executive Summary
4 Market Landscape
- 4.1 Market Overview
- 4.2 Market Drivers
- 4.2.1 Rising Scope 3 Reporting Pressure on Cloud-Native Workloads
- 4.2.2 FinOps and GreenOps Convergence in Kubernetes Operations
- 4.2.3 Serverless Pricing Transparency Improving Sustainability Buy-In
- 4.2.4 EU CSRD and Digital Reporting Readiness for Cloud Operations
- 4.2.5 Carbon-Aware Scheduling Demand Across Multi-Cloud Estates
- 4.2.6 Automated Telemetry Integration with Cloud Observability Stacks
- 4.3 Market Restraints
- 4.3.1 Incomplete Emissions Attribution for Ephemeral Serverless Execution
- 4.3.2 Limited Standardization of Workload-Level Carbon Methodologies
- 4.3.3 Low Budget Priority Outside Regulated Enterprise Accounts
- 4.3.4 Data Quality Gaps Across Multi-Cloud and Hybrid Telemetry Sources
- 4.4 Industry Value-Chain Analysis
- 4.5 Regulatory Landscape
- 4.6 Technological Outlook
- 4.7 Impact of Macroeconomic Factors on the Market
- 4.8 Porter's Five Forces Analysis
- 4.8.1 Threat of New Entrants
- 4.8.2 Bargaining Power of Buyers
- 4.8.3 Bargaining Power of Suppliers
- 4.8.4 Threat of Substitutes
- 4.8.5 Intensity of Competitive Rivalry
5 MARKET SIZE AND GROWTH FORECASTS (VALUE)
- 5.1 By Deployment
- 5.1.1 Cloud-Based
- 5.1.2 Hybrid
- 5.1.3 On-Premises
- 5.2 By Component
- 5.2.1 Software
- 5.2.1.1 Container sustainability analytics
- 5.2.1.2 Kubernetes energy monitoring
- 5.2.1.3 Carbon-aware scheduling
- 5.2.1.4 Resource optimization engines
- 5.2.1.5 Sustainability dashboards
- 5.2.1.6 Emissions reporting tools
- 5.2.2 Services
- 5.2.1 Software
- 5.3 By Enterprise Size
- 5.3.1 Large Enterprises
- 5.3.2 Small and Medium Enterprises
- 5.4 By End-user Industry
- 5.4.1 Industrial Manufacturing
- 5.4.2 Energy and Utilities
- 5.4.3 BFSI
- 5.4.4 Retail and Consumer Goods
- 5.4.5 IT and Telecom
- 5.4.6 Healthcare and Life Sciences
- 5.4.7 Government and Public Sector
- 5.4.8 Transportation and Logistics
- 5.4.9 Other End-user Industries
- 5.5 By Geography
- 5.5.1 North America
- 5.5.1.1 United States
- 5.5.1.2 Canada
- 5.5.1.3 Mexico
- 5.5.2 South America
- 5.5.2.1 Brazil
- 5.5.2.2 Argentina
- 5.5.2.3 Rest of South America
- 5.5.3 Europe
- 5.5.3.1 Germany
- 5.5.3.2 United Kingdom
- 5.5.3.3 France
- 5.5.3.4 Italy
- 5.5.3.5 Spain
- 5.5.3.6 Russia
- 5.5.3.7 Netherlands
- 5.5.3.8 Rest of Europe
- 5.5.4 Asia-Pacific
- 5.5.4.1 China
- 5.5.4.2 Japan
- 5.5.4.3 India
- 5.5.4.4 South Korea
- 5.5.4.5 Australia and New Zealand
- 5.5.4.6 Rest of Asia-Pacific
- 5.5.5 Middle East
- 5.5.5.1 Saudi Arabia
- 5.5.5.2 United Arab Emirates
- 5.5.5.3 Rest of Middle East
- 5.5.6 Africa
- 5.5.6.1 South Africa
- 5.5.6.2 Nigeria
- 5.5.6.3 Rest of Africa
- 5.5.1 North America
6 COMPETITIVE LANDSCAPE
- 6.1 Market Concentration
- 6.2 Strategic Moves
- 6.3 Market Share Analysis
- 6.4 Company Profiles (includes Global Level Overview, Market Level Overview, Core Segments, Financials as available, Strategic Information, Market Rank/Share, Products and Services, Recent Developments)
- 6.4.1 Watershed Technology, Inc.
- 6.4.2 Persefoni AI, Inc.
- 6.4.3 Plan A Sustainable Technologies GmbH
- 6.4.4 Normative AB
- 6.4.5 Greenly SAS
- 6.4.6 Emitwise Limited
- 6.4.7 Sinai Technologies, Inc.
- 6.4.8 Sweep SAS
- 6.4.9 Greenomy S.A.
- 6.4.10 Climatiq Ltd.
- 6.4.11 Novisto Inc.
- 6.4.12 Altruistiq Limited
- 6.4.13 Sustainability Cloud AG
- 6.4.14 Cority Software Inc.
- 6.4.15 Benchmark Gensuite, LLC
- 6.4.16 Datadog Inc
- 6.4.17 Sphera Solutions, Inc.
- 6.4.18 Enablon North America Corporation
- 6.4.19 Intelex Technologies ULC
- 6.4.20 Osapiens Holding GmbH
7 MARKET OPPORTUNITIES AND FUTURE OUTLOOK
- 7.1 White-Space and Unmet-Need Assessment