

|
시장보고서
상품코드
2073000
탄소 내재화 IT 자산 수명주기 소프트웨어 시장 : 시장 점유율 분석, 업계 동향 및 통계, 성장 예측(2026-2031년)Embodied Carbon IT Asset Lifecycle Software - Market Share Analysis, Industry Trends & Statistics, Growth Forecasts (2026 - 2031) |
||||||
 Mordor Intelligence
Mordor Intelligence에 의하면, 탄소 내재화 IT 자산 수명주기 소프트웨어 시장 규모는 2025년에 6억 5,000만 달러로 평가되었고, 2031년까지 23억 3,000만 달러에 이를 것으로 예측되며, 2026-2031년 CAGR 24.15%로 성장할 전망입니다.
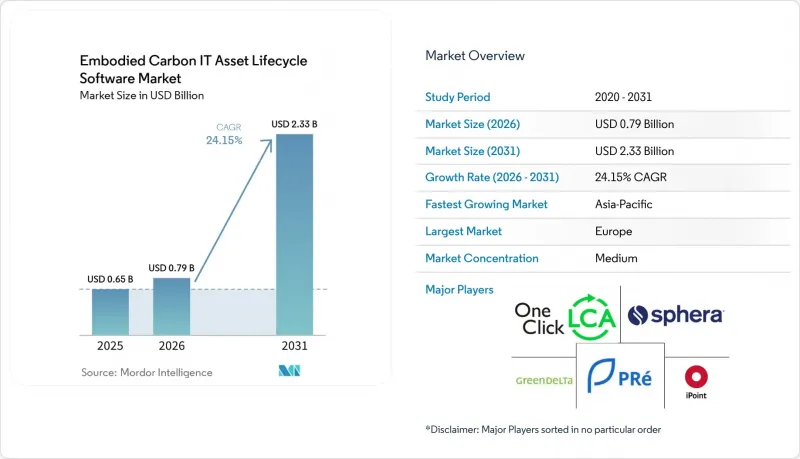
본 보고서는 구성 요소별(소프트웨어 및 서비스), 배포 방식별(클라우드 기반 및 온프레미스형), 기업 규모별(대기업 및 중소기업), 용도별(내재 탄소 산정 등), 최종 사용자별(IT 및 통신, 은행, 금융서비스 및 보험(BFSI), 산업 제조 등) 및 지역별로 분류되어 있습니다. 시장 전망치는 금액(달러)으로 표시되어 있습니다.
세계의 탄소 내재화 IT 자산 수명주기 소프트웨어 시장 동향 및 인사이트
엄격한 Scope 3 및 IT 지속가능성 공시 요건이 플랫폼 수요를 견인하고 있습니다.
규제상의 압력으로 인해 IT 하드웨어의 탄소 데이터가 공식 보고 주기에 점차 반영되고 있습니다. ESRS E1은 구매한 상품 및 서비스를 구조화된 기후 공시 프레임워크에 통합하고 있으며, 이에 따라 기기 관련 배출량은 광범위한 요약 정보 내에서 부수적인 추정치로 취급할 수 없게 되었습니다. 독일의 CSRD 도입 과정 역시 대기업들이 2025 회계연도와 관련된 보고에 대비해야 할 필요성을 더욱 강조함으로써, 규정 준수 업무를 적극적인 예산 및 시스템 계획 단계로 전환시켰습니다. 이러한 변화가 중요한 이유는 IT 자산의 수명 주기 내 내재 탄소량과 관련된 소프트웨어 시장이 단순한 브랜딩 목표가 아니라 감사에 대한 기대에 의해 주도되고 있기 때문입니다. 공시 검토에 재무, 지속가능성, 내부통제 각 팀이 동시에 참여하는 경우, 조달 기록, 자산 데이터, 배출량 산정 논리를 연계하는 소프트웨어 도입의 정당성이 더욱 명확해지고 있습니다. 이와 유사한 규정 준수 압박은 공급업체 네트워크로도 확대되고 있으며, 직접적인 하드웨어 조달 방식에 변화가 없더라도 보고 주체는 업스트림 공정에서 보다 강력한 데이터 수집을 요구하는 경우가 많아지고 있습니다.
IT 조달 분야에서 감사에 대응할 수 있는 내재 탄소 데이터에 대한 수요가 증가함에 따라, 데이터 출처 추적에 대한 필요성도 더욱 커지고 있습니다.
조달 팀은 IT 구매를 평가할 때 대략적인 대체값이 아닌 제품 수준의 탄소 데이터를 사용해야 한다는 압박을 점점 더 강하게 받고 있습니다. 레노버가 Makersite를 활용해 2025년에 도입한 ThinkPad의 구성 단위별 제품 탄소 발자국은 OEM의 투명성이 기업의 구매 협상에서 실질적인 차별화 요소로 자리 잡고 있음을 보여주었습니다. 이러한 변화가 중요한 이유는 구매자가 단순히 수치만 필요로 하는 것이 아니라, 특정 제품 구성까지 거슬러 올라갈 수 있으며, 공급업체들 간에 공통적으로 이해할 수 있는 수치를 필요로 하기 때문입니다. 그 결과, IT 자산의 수명 주기 전반에 걸친 내재 탄소량을 관리하는 소프트웨어 시장은 단순한 보고용 대시보드에서 벗어나, 여러 OEM 출처의 1차 정보를 수집하여 정규화하고 비교할 수 있는 플랫폼으로 전환되고 있습니다. 이에 따라 구매 주기, 기기 교체, 공개 기간 전반에 걸쳐 일관된 기록을 유지할 수 있는 소프트웨어의 가치도 높아지고 있습니다. 보고서의 품질을 저해하지 않으면서 공급업체 데이터의 편차를 잘 처리할 수 있는 벤더는 기업들로부터 더 많은 주목을 받게 될 것입니다.
OEM 및 기기 범주별로 차이가 있는 내재 탄소 계수가 데이터의 신뢰성을 제한하고 있습니다.
모든 하드웨어 제조업체와 기기 범주에서 제품의 탄소 정보가 동일한 수준의 상세도로 공개되는 것은 아니기 때문에 데이터의 질에는 여전히 편차가 있습니다. 레노보의 구성 단계별 탄소 발자국 관리 노력은 투명성 향상을 보여주는 한 예이지만, 그 수준의 세부 사항은 아직 공급망 전반에 걸쳐 표준화되지 않았습니다. Ecoinvent는 이용 가능한 수명주기 인벤토리 데이터베이스 중에서도 최대 규모의 것을 제공하고 있지만, 기업의 IT 자산에 도입되는 모든 신규 및 특수 하드웨어 프로파일을 완벽하게 포괄하는 데이터셋 라이브러리는 존재하지 않습니다. 즉, 많은 플랫폼에서는 여전히 공급업체별 값과 모델링된 가정 및 2차 계수를 조합하여 계산해야 합니다. 이로 인해 기업이 브랜드, 폼 팩터, 업데이트 주기를 넘나들며 IT 자산을 비교할 때 일관성이 떨어질 수 있습니다. IT 자산의 수명 주기 전반에 걸친 내재 탄소를 산출하는 소프트웨어 시장에는 여전히 강력한 수요가 있지만, 업스트림 데이터의 불균일성은 신뢰성과 도입 속도에 있어 실질적인 걸림돌이 되고 있습니다.
부문별 분석
2025년, 소프트웨어는 탄소 내재화 IT 자산 수명주기 소프트웨어 시장의 69.74%를 차지했으며, 이 전체 부문에서 핵심 제공 계층으로서의 입지를 확고히 했습니다. 이러한 위치는 대부분의 구매자가 우선 단일 구성 가능한 시스템 내에서 장치 정보를 수집하고, 배출량 산출 논리를 적용하여 일관된 결과를 도출해야 한다는 사실을 반영하고 있습니다. 기업이 처음에 갖는 의문은 대개 데이터 수집과 보고서 작성의 재현성과 관련된 것이며, 서비스에 대한 지출이 확대되기 전 단계에서는 당연히 소프트웨어가 우선시됩니다. 또한, 자동화를 통해 많은 사내 팀이 여러 보고 기간에 걸쳐 유지하기 어려운 수작업 방식의 탄소 회계 업무가 줄어들기 때문에 IT 자산 수명 주기 기반 내재 탄소 소프트웨어 시장은 여전히 소프트웨어 주도적인 추세를 보이고 있습니다. 확립된 라이프사이클 및 카본 플랫폼은 검증된 데이터 구조를 바탕으로 이 분야에 진출한 반면, 신규 벤더들은 이러한 프로세스를 더욱 신속하게 만들고 확장하기 쉽게 만드는 데 주력했습니다.
이 문장은 서비스가 중요성 면에서 부차적인 것임을 의미하는 것은 아닙니다. 서비스 시장은 2031년까지 연평균 성장률(CAGR) 24.65%로 확대될 것으로 예상되기 때문입니다. 많은 구매자들은 여전히 데이터 준비, 조사 방법 선정, 시스템 매핑, 그리고 지속가능성 팀과 IT 운영 부서 간의 업무 인계에 대한 지원이 필요합니다. 조직이 실용적인 성과물을 얻기 위한 지름길을 원하면서도, 아직 사내에 충분한 LCA(생명주기 평가)나 탄소 회계 역량을 갖추지 못한 경우, 해당 서비스에 대한 수요는 더욱 높아집니다. Sphera가 제공하는 관리형 LCA 컨텐츠는 연간 2만 건 이상의 데이터 세트(매년 갱신되며 제3자 기관의 검증을 거친)를 기반으로 하고 있으며, 이는 복잡한 도입 프로젝트에서 컨텐츠와 구현 지원이 종종 세트로 판매되는 이유를 여실히 보여줍니다. 장기적으로 볼 때, IT 자산의 수명 주기 전반에 걸친 내재 탄소를 산출하는 소프트웨어 업계는 계속해서 소프트웨어 매출을 주축으로 삼으면서도, 서비스 부문은 통합, 품질 관리 및 지속적인 모델 거버넌스 분야에서 더 큰 가치를 창출해 나갈 것으로 보입니다.
2025년에는 탄소 내재화 IT 자산 수명주기 소프트웨어 시장에서 클라우드 도입이 66.12%를 차지했으며, 제공 모델 중 압도적인 선두를 차지했습니다. 이러한 경향에는 실용적인 이유가 있습니다. 클라우드 서비스는 일반적으로 대규모 사내 소프트웨어 환경을 관리하지 않는 지속가능성 팀에게 신속한 도입, 손쉬운 업데이트, 인프라 부담 경감을 실현해 주기 때문입니다. 또한, 팩터 라이브러리, 공급업체 기록, 기업 시스템에서 빈번한 데이터 갱신이 필요한 플랫폼에도 적합합니다. 여기서는 정기적으로 업데이트되는 라이프사이클 인벤토리 컨텐츠에 대한 접근이 중요하며, ecoinvent와 같은 광범위한 데이터베이스는 고립된 로컬 사본이 아닌, 중앙에서 관리되는 업데이트의 가치를 입증하고 있습니다. IT 자산 수명 주기 내 내재 탄소량 관리 소프트웨어 시장은 도입 초기 단계에서 속도, 유연성 및 유지보수 간소화를 원하는 구매자의 요구로 인해 여전히 클라우드 지향적인 양상을 보이고 있습니다.
하이브리드 방식은 2031년까지 연평균 성장률(CAGR) 25.02%를 나타낼 것으로 예측되며, 가장 빠르게 성장하는 사업 모델이 될 것입니다. 이러한 경향은 클라우드 기반 모델링 기능을 필요로 하면서도, 텔레메트리, 자산 목록 세부 정보 또는 내부 기록에 대한 보다 엄격한 관리를 여전히 선호하는 규제 대상 조직의 요구를 반영하고 있습니다. 또한, 하이브리드 구성은 이미 온프레미스에서 확립된 거버넌스 시스템을 운영하고 있어, 관련 데이터를 한꺼번에 공유 환경으로 이전하고 싶지 않은 기업에게도 매력적입니다. ISO/IEC TS 19770-13:2026은 획일적인 아키텍처가 아닌, 기존 ITAM 시스템에 지속가능성 정보를 구조화된 방식으로 통합할 것을 권장함으로써 이러한 방향성을 뒷받침하고 있습니다. 소프트웨어 교체 주기가 긴 조직에서는 온프레미스 배포가 여전히 중요하지만, 탄소 내재화 IT 자산 수명주기 소프트웨어 시장은 클라우드의 유연성과 기밀 데이터에 대한 보다 강력한 관리를 결합한 모델로 분명히 전환되고 있습니다.
지역별 분석
2025년, 유럽은 탄소 내재화 IT 자산 수명주기 소프트웨어 시장 점유율의 34.56%를 차지하며 1위를 유지했습니다. 독일, 영국, 프랑스는 대규모 기업 기반은 물론, 더 엄격한 보고 요건과 성숙한 지속가능성 프로세스를 갖추고 있어 계속해서 주요 수요 거점으로 자리 잡고 있습니다. 특히 독일은 중요한 시장입니다. CSRD(기업 지속가능성 보고 지침)의 이행 계획과 기업의 준비가 진행됨에 따라, 구매하는 상품 및 서비스에 관한 체계적인 보고 워크플로우의 필요성이 높아지고 있기 때문입니다. BITKOM의 2025년 지침 역시 해당 지역의 기술 및 소프트웨어 기업들이 이미 자원 효율성과 조달 및 수명 주기 계획을 어느 정도 연계하고 있는지를 반영하고 있습니다.
아시아태평양은 2031년까지 연평균 성장률(CAGR) 25.45%를 나타낼 것으로 예측되며, 탄소 내재화 IT 자산 수명주기 소프트웨어 시장에서 가장 빠르게 성장하는 지역이 될 것입니다. 주요 경제권에서 정보 공개 관행이 확대되고, 기업의 구매 담당자들이 해당 지역의 하드웨어 공급업체에 더 높은 품질의 데이터를 요구하게 됨에 따라, 이 지역은 도입이 더욱 가속화되는 단계에 접어들고 있습니다. 일본, 호주, 인도, 싱가포르, 중국, 한국은 모두 이러한 추세에 기여하고 있으며, 상장 기업 및 대기업을 중심으로 보고 활동과 기후 관련 거버넌스가 점차 제도화되고 있습니다. 또 다른 요인은 해당 지역이 하드웨어 제조에서 차지하는 비중이 크다는 점입니다. 이로 인해 공급업체 측과 구매자 측 양쪽으로부터의 압박이 동시에 커지는 경우가 종종 있습니다. 그 결과, 보고 주체뿐만 아니라 전 세계 고객 관계를 뒷받침하기 위해 보다 정확한 제품 탄소 데이터가 필요한 OEM 및 부품 공급업체로부터도 수요가 발생하고 있습니다.
2025년, 북미는 탄소 내재화 IT 자산 수명주기 소프트웨어 시장에서 지역별 점유율 2위를 차지했습니다. 미국은 자금력이 풍부한 공급업체가 여러 곳 존재하고, 이미 체계적인 지속가능성 프로그램을 시행하고 있는 기업 기반이 넓기 때문에 여전히 중심적인 위치를 차지하고 있습니다. 이 지역 수요는 공개된 결과에 따라 조달 단계에서의 점수 산정, 공급업체에 대한 데이터 요청, 하드웨어 교체 결정 등 업스트림 단계로 점차 이동하고 있습니다. 남미에서는 도입이 아직 초기 단계에 있는 반면, 중동 및 아프리카에서는 아랍에미리트, 사우디아라비아, 남아프리카공화국 등에서 해당 지역의 다른 국가들보다 활발한 움직임이 보이는 등, 지역에 따라 상황이 제각각입니다.
기타 혜택 :
- 엑셀 형식 시장 예측(ME) 시트
- 3개월간의 애널리스트 지원
자주 묻는 질문
목차
제1장 서론
제2장 조사 방법
제3장 주요 요약
제4장 시장 구도
제5장 시장 규모 및 성장 예측
제6장 경쟁 구도
제7장 시장 기회 및 향후 전망
AJY 26.07.07According to Mordor Intelligence, the embodied carbon IT asset lifecycle software market size was valued at USD 0.65 billion in 2025 and is forecast to reach USD 2.33 billion by 2031, expanding at a CAGR of 24.15% during 2026-2031.
This report is Segmented by Component (Software, and Services), Deployment Mode (Cloud-Based, and On-Premises), Enterprise Size (Large Enterprises, and Small and Medium Enterprises), Application (Embodied Carbon Accounting, and More), End User (IT and Telecom, BFSI, Industrial Manufacturing, and More), and Geography. The Market Forecasts are Provided in Terms of Value (USD).
Global Embodied Carbon IT Asset Lifecycle Software Market Trends and Insights
Stringent Scope 3 and IT Sustainability Disclosure Requirements Drive Platform Demand
Regulatory pressure is pushing carbon data for IT hardware into formal reporting cycles. ESRS E1 places purchased goods and services inside a structured climate disclosure framework, which means device-related emissions can no longer be handled as a side estimate inside broad sustainability summaries. Germany's CSRD implementation process also reinforced the need for large enterprises to prepare for reporting tied to fiscal year 2025, which moved compliance work into active budget and systems planning. This change matters because the embodied carbon IT asset lifecycle software market is being pulled by audit expectations rather than by branding goals alone. Software that connects procurement records, asset data, and emissions logic is becoming easier to justify when disclosure reviews involve finance, sustainability, and internal controls teams simultaneously. The same compliance pressure also extends to supplier networks, meaning reporting entities often need stronger upstream data collection even when their direct hardware purchasing patterns have not changed.
Rising Demand for Audit-Ready Embodied Carbon Data in IT Procurement Deepens Data Provenance Needs
Procurement teams are under growing pressure to use product-level carbon data instead of broad proxy values when they assess IT purchases. Lenovo's 2025 rollout of configuration-level product carbon footprints for ThinkPad, built with Makersite, showed that OEM transparency is becoming a practical differentiator in enterprise buying conversations. That shift matters because buyers do not just need a number; they need one that can be traced back to a specific product setup and understood across suppliers. As a result, the embodied carbon IT asset lifecycle software market is moving away from simple reporting dashboards and toward platforms that can ingest, normalize, and compare primary data from several OEM sources. This also increases the value of software that can maintain consistent records across purchasing cycles, device refreshes, and disclosure periods. Vendors that can handle supplier data variation without breaking reporting quality are likely to gain more enterprise attention.
Fragmented Embodied Carbon Factors Across OEMs And Device Classes Limit Data Fidelity
Data quality remains uneven because product carbon information is still not published with the same depth across all hardware makers and device categories. Lenovo's configuration-level footprint work is one example of stronger transparency, but that level of detail is not yet standard across the full supply base. Ecoinvent offers one of the largest lifecycle inventory bases available, yet no dataset library fully covers every new and specialized hardware profile entering enterprise fleets. This means many platforms still need to blend supplier-specific values with modeled assumptions and secondary factors. That can weaken consistency when enterprises compare fleets across brands, form factors, and refresh cycles. The embodied carbon IT asset lifecycle software market still has strong demand, but uneven upstream data remains a real brake on confidence and implementation speed.
Other drivers and restraints analyzed in the detailed report include:
- Expansion of Circular IT Practices, Reuse, and Lifecycle Extension Programs Extends Software's Role
- Convergence of IT Asset Management, ESG Reporting, and FinOps Workflows Creates A Broader Buying Center
- Integration Complexity Across ITAM, ERP, ESG, and Procurement Systems Raises Deployment Friction
For complete list of drivers and restraints, kindly check the Table Of Contents.
Segment Analysis
Software held 69.74% of the embodied carbon IT asset lifecycle software market in 2025, establishing it as the core delivery layer across the category. That position reflects how most buyers start by needing to collect device information, apply emissions logic, and produce consistent outputs within a single configurable system. The first enterprise question is usually about data capture and reporting repeatability, which naturally favors software before services spending expands. The embodied carbon IT asset lifecycle software market also remains software-led, as automation reduces manual carbon accounting work that many internal teams cannot sustain across multiple reporting periods. Established lifecycle and carbon platforms entered this space with proven data structures, while newer vendors focused on making those processes faster and easier to scale.
This lead does not imply that services are secondary in importance, as services are projected to expand at a 24.65% CAGR through 2031. Many buyers still need help with data preparation, methodology choices, system mapping, and the handoff between sustainability teams and IT operations. Service demand rises further when organizations want a faster route to usable outputs but do not yet have enough internal LCA or carbon accounting capacity. Sphera's managed LCA content offering, supported by more than 20,000 datasets annually updated and third-party verified, demonstrates why content and implementation support are often sold together in complex deployments. Over time, the embodied carbon IT asset lifecycle software industry is likely to remain anchored by software revenue, while services capture more value in integration, quality control, and ongoing model governance.
Cloud deployment accounted for 66.12% of the embodied carbon IT asset lifecycle software market in 2025, giving it a clear lead among delivery models. The preference is practical because cloud delivery supports faster onboarding, easier updates, and less infrastructure burden for sustainability teams that usually do not manage large internal software environments. It also works well for platforms that need frequent data refreshes from factor libraries, supplier records, and enterprise systems. Access to regularly updated lifecycle inventory content matters here, and broad databases such as ecoinvent reinforce the value of centrally managed updates rather than isolated local copies. The embodied carbon IT asset lifecycle software market still leans toward cloud because buyers want speed, flexibility, and simpler maintenance during early rollout phases.
Hybrid deployment is projected to grow at a 25.02% CAGR through 2031, which makes it the fastest-growing mode. This pattern reflects the needs of regulated organizations that want cloud-based modeling power but still prefer tighter control over telemetry, inventory detail, or internal records. Hybrid setups also appeal to enterprises that already run established governance systems on-site and do not want to move all connected data into a shared environment at once. ISO/IEC TS 19770-13:2026 supports this direction by encouraging the structured incorporation of sustainability information into existing ITAM systems rather than a one-size-fits-all architecture. On-premises deployment remains relevant in organizations with longer software replacement cycles, but the embodied carbon IT asset lifecycle software market is clearly shifting toward models that combine cloud flexibility with stronger control over sensitive data.
Complete Report Scope:
- By Component
- Software
- Services
- By Deployment Mode
- Cloud-Based
- On-Premises
- By Enterprise Size
- Large Enterprises
- Small and Medium Enterprises
- By Application
- Embodied Carbon Accounting
- IT Asset Lifecycle Optimization
- Circularity and Reuse Planning
- Compliance and Reporting
- By End User
- IT and Telecom
- BFSI
- Industrial Manufacturing
- Energy and Utilities
- Oil and Gas
- Retail and E-Commerce
- Construction and Infrastructure
- Government and Public Sector
- Other End Users
- By Geography
- North America
- United States
- Canada
- Mexico
- South America
- Brazil
- Argentina
- Rest of South America
- Europe
- Germany
- United Kingdom
- France
- Italy
- Spain
- Russia
- Rest of Europe
- Asia-Pacific
- China
- India
- Japan
- South Korea
- Australia
- Rest of Asia-Pacific
- Middle East and Africa
- Middle East
- Saudi Arabia
- United Arab Emirates
- Turkey
- Rest of Middle East
- Africa
- South Africa
- Egypt
- Rest of Africa
- Middle East
- North America
Geography Analysis
Europe held 34.56% of the embodied carbon IT asset lifecycle software market share in 2025, maintaining its leading position. Germany, the United Kingdom, and France remain the main demand centers because they combine large enterprise bases with stronger reporting expectations and more mature sustainability processes. Germany is especially important because CSRD implementation planning and corporate preparation have accelerated the need for structured reporting workflows for purchased goods and services. BITKOM's 2025 guidance also reflects the degree to which technology and software organizations in the region are already linking resource efficiency with procurement and lifecycle planning.
Asia-Pacific is projected to grow at a 25.45% CAGR through 2031, which makes it the fastest-growing region in the embodied carbon IT asset lifecycle software market. The region is entering a stronger adoption phase as disclosure practices expand across major economies and enterprise buyers demand better data from regional hardware suppliers. Japan, Australia, India, Singapore, China, and South Korea all contribute to this trend, as reporting activities and climate-related governance are becoming more formal across listed companies and large enterprises. Another factor is the region's weight in hardware manufacturing, which means supplier-side and buyer-side pressures often rise at the same time. This creates demand not only from reporting entities, but also from OEMs and component suppliers that need cleaner product carbon data to support global customer relationships.
North America held the second-largest regional share in the embodied carbon IT asset lifecycle software market in 2025. The United States remains central because it houses several well-funded vendors and a large base of enterprises that already run structured sustainability programs. Demand in this region is moving upstream from disclosure output into procurement-stage scoring, supplier data requests, and hardware refresh decisions. South America remains earlier in adoption, while the Middle East and Africa show a split pattern with stronger activity in the UAE, Saudi Arabia, and South Africa than in the rest of the region.
- One Click LCA Ltd
- PRe Sustainability B.V.
- Sphera Solutions, Inc.
- GreenDelta GmbH
- iPoint-systems GmbH
- Makersite GmbH
- Ecochain Technologies B.V.
- Plan A Technologies GmbH
- Greenly SAS
- Normative AB
- Persefoni AI, Inc.
- Watershed Technology, Inc.
- Sweep SAS
- Dcycle, S.L.
- Sinai Technologies, Inc.
- Emitwise Limited
- Measurabl, Inc.
- Deepki SAS
- OpenLCA GmbH
- FigBytes Inc.
Additional Benefits:
- The market estimate (ME) sheet in Excel format
- 3 months of analyst support
TABLE OF CONTENTS
1 INTRODUCTION
- 1.1 Study Assumptions and Market Definition
- 1.2 Scope of the Study
2 RESEARCH METHODOLOGY
3 EXECUTIVE SUMMARY
4 MARKET LANDSCAPE
- 4.1 Market Overview
- 4.2 Market Drivers
- 4.2.1 Stringent Scope 3 and IT Sustainability Disclosure Requirements
- 4.2.2 Rising Demand for Audit-Ready Embodied Carbon Data in IT Procurement
- 4.2.3 Expansion of Circular IT Practices, Reuse, and Lifecycle Extension Programs
- 4.2.4 Convergence of IT Asset Management, ESG Reporting, and FinOps Workflows
- 4.2.5 Wider Availability of Device-Level LCA Data Through APIs and Databases
- 4.2.6 Growing Enterprise Focus on Product-Level Carbon Hotspots Across IT Fleets
- 4.3 Market Restraints
- 4.3.1 Fragmented Embodied Carbon Factors Across OEMs and Device Classes
- 4.3.2 Integration Complexity Across ITAM, ERP, ESG, and Procurement Systems
- 4.3.3 Security, Privacy, and Data Governance Concerns Around Asset Telemetry
- 4.3.4 Limited Standardization of IT Asset Carbon Accounting Methodologies
- 4.4 Industry Value-Chain Analysis
- 4.5 Regulatory Landscape
- 4.6 Technological Outlook
- 4.7 Porter's Five Forces Analysis
- 4.7.1 Bargaining Power of Buyers
- 4.7.2 Bargaining Power of Suppliers
- 4.7.3 Threat of New Entrants
- 4.7.4 Threat of Substitutes
- 4.7.5 Intensity of Competitive Rivalry
5 MARKET SIZE AND GROWTH FORECASTS (VALUE)
- 5.1 By Component
- 5.1.1 Software
- 5.1.2 Services
- 5.2 By Deployment Mode
- 5.2.1 Cloud-Based
- 5.2.2 On-Premises
- 5.3 By Enterprise Size
- 5.3.1 Large Enterprises
- 5.3.2 Small and Medium Enterprises
- 5.4 By Application
- 5.4.1 Embodied Carbon Accounting
- 5.4.2 IT Asset Lifecycle Optimization
- 5.4.3 Circularity and Reuse Planning
- 5.4.4 Compliance and Reporting
- 5.5 By End User
- 5.5.1 IT and Telecom
- 5.5.2 BFSI
- 5.5.3 Industrial Manufacturing
- 5.5.4 Energy and Utilities
- 5.5.5 Oil and Gas
- 5.5.6 Retail and E-Commerce
- 5.5.7 Construction and Infrastructure
- 5.5.8 Government and Public Sector
- 5.5.9 Other End Users
- 5.6 By Geography
- 5.6.1 North America
- 5.6.1.1 United States
- 5.6.1.2 Canada
- 5.6.1.3 Mexico
- 5.6.2 South America
- 5.6.2.1 Brazil
- 5.6.2.2 Argentina
- 5.6.2.3 Rest of South America
- 5.6.3 Europe
- 5.6.3.1 Germany
- 5.6.3.2 United Kingdom
- 5.6.3.3 France
- 5.6.3.4 Italy
- 5.6.3.5 Spain
- 5.6.3.6 Russia
- 5.6.3.7 Rest of Europe
- 5.6.4 Asia-Pacific
- 5.6.4.1 China
- 5.6.4.2 India
- 5.6.4.3 Japan
- 5.6.4.4 South Korea
- 5.6.4.5 Australia
- 5.6.4.6 Rest of Asia-Pacific
- 5.6.5 Middle East and Africa
- 5.6.5.1 Middle East
- 5.6.5.1.1 Saudi Arabia
- 5.6.5.1.2 United Arab Emirates
- 5.6.5.1.3 Turkey
- 5.6.5.1.4 Rest of Middle East
- 5.6.5.2 Africa
- 5.6.5.2.1 South Africa
- 5.6.5.2.2 Egypt
- 5.6.5.2.3 Rest of Africa
- 5.6.5.1 Middle East
- 5.6.1 North America
6 COMPETITIVE LANDSCAPE
- 6.1 Market Concentration
- 6.2 Strategic Moves
- 6.3 Market Share Analysis
- 6.4 Company Profiles (includes Global Level Overview, Market Level Overview, Core Segments, Financials as available, Strategic Information, Market Rank/Share, Products and Services, Recent Developments)
- 6.4.1 One Click LCA Ltd
- 6.4.2 PRe Sustainability B.V.
- 6.4.3 Sphera Solutions, Inc.
- 6.4.4 GreenDelta GmbH
- 6.4.5 iPoint-systems GmbH
- 6.4.6 Makersite GmbH
- 6.4.7 Ecochain Technologies B.V.
- 6.4.8 Plan A Technologies GmbH
- 6.4.9 Greenly SAS
- 6.4.10 Normative AB
- 6.4.11 Persefoni AI, Inc.
- 6.4.12 Watershed Technology, Inc.
- 6.4.13 Sweep SAS
- 6.4.14 Dcycle, S.L.
- 6.4.15 Sinai Technologies, Inc.
- 6.4.16 Emitwise Limited
- 6.4.17 Measurabl, Inc.
- 6.4.18 Deepki SAS
- 6.4.19 OpenLCA GmbH
- 6.4.20 FigBytes Inc.
7 MARKET OPPORTUNITIES AND FUTURE OUTLOOK
- 7.1 White-Space and Unmet-Need Assessment


