
|
시장보고서
상품코드
2073004
병원 캐파시티 관리 솔루션 시장 : 시장 점유율 분석, 업계 동향 및 통계, 성장 예측(2026-2031년)Hospital Capacity Management Solutions - Market Share Analysis, Industry Trends & Statistics, Growth Forecasts (2026 - 2031) |
||||||
 Mordor Intelligence
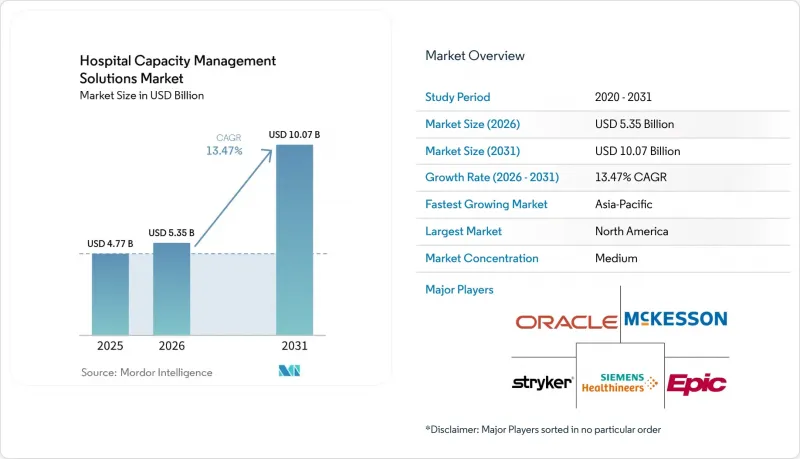
Mordor Intelligence에 의하면, 병원 캐파시티 관리 솔루션 시장 규모는 2025년 47억 7,000만 달러로 평가되었고, 2026년에는 53억 5,000만 달러로 추정되고, 2026-2031년 CAGR 13.47%로 성장을 지속할 전망이며, 2031년에는 100억 7,000만 달러에 이를 것으로 예측됩니다.
본 보고서는 솔루션 유형별(용량 관리, 환자 흐름 관리, 자원 관리 등), 도입 형태별(클라우드 기반, 온프레미스형), 구성 요소별(소프트웨어, 서비스), 최종 사용자별(병원 등), 워크플로우별(입원 전 등), 지역별(북미, 유럽 등)로 분류되어 있습니다. 시장 전망은 금액(달러) 기준으로 제시되어 있습니다.
세계의 병원 캐파시티 관리 솔루션 시장 동향 및 인사이트
입원 환자 처리량 증가로 인한 압박과 병상 회전율의 제약
병원 캐파시티 관리 솔루션 시장은 급성기 의료 현장에서 발생하는 기본적인 운영상의 문제, 즉 환자 유입 속도가 퇴원 조정의 대응 속도를 앞지르는 상황에서 혜택을 보고 있습니다. 영국 국민보건서비스(NHS England)의 데이터에 따르면, 2024/25 회계연도 4분기 일반 병상 및 급성기 병상의 가동률은 92.5%였으며, 이는 NICE가 권장하는 90% 상한선과 일반적인 NHS 운영 지침을 모두 상회하는 수치였습니다. 또한 Vizient사는 2026년 5월, 현재의 조정 추세가 지속될 경우 2032년까지 전 세계 병원 가동률이 85.0%라는 안전 임계치를 넘어설 것으로 예측한다고 보고했습니다. 이 분석에 따르면, 입원 환자의 2%가 전체 장기 입원 일수의 15%를 차지할 전망이며, 이러한 초과 일수로 인해 하루당 2,093달러의 피할 수 있는 비용이 발생하고 있는 것으로 밝혀졌습니다. 조사 대상 병원 중, 대부분의 입원 병동에서 표준화된 퇴원 단계별 대응 절차를 마련해 둔 곳은 불과 36%에 불과했으며, 케이스 매니저 주도의 완전한 다학제 회진을 실시하고 있다고 보고한 대학병원은 33%에 그쳤습니다. 이는 많은 지연이 단순히 병상 부족 때문이 아니라, 단편적인 조정에 기인하고 있음을 보여줍니다. 이러한 추세에 따라, 병원 캐파시티 관리 솔루션 시장은 단순히 독립적인 대시보드를 추가하는 것이 아니라, 에스컬레이션 로직, 사회적 요구 평가, 퇴원 워크플로우 자동화를 단일 운영 계층에 통합한 플랫폼으로 전환되고 있습니다.
가치 기반 의료 및 입원 기간 단축 프로그램
병원 캐파시티 관리 솔루션 시장은 보험 급여를 효율성 및 환자의 경과와 보다 직접적으로 연계하는 지급 체계에 의해서도 뒷받침되고 있습니다. CMS는 2025 회계연도 IPPS 최종 규정을 통해 병원의 성과가 결과, 안전성, 효율성 및 환자 경험의 관점에서 평가되도록 했습니다. 이로 인해 입원 일수 관리는 병원 운영의 재무적 핵심과 밀접하게 연결되어 있습니다. 2024년 8월부터 2025년 7월까지 7개 의료기관·28만 3,517건의 퇴원 데이터를 대상으로 실시된 품질 개선 이니셔티브를 통해, 실측 입원 일수와 예상 입원 일수의 비율이 1.07에서 0.99로 감소했으며, 퇴원 건수는 3,863건 증가했고, 응급실 대기 시간은 14.1시간에서 10.4시간으로 단축되었습니다. 이러한 결과는 퇴원 계획 및 경과 관리가 재무팀이 인식할 수 있는 수준에서 업무상의 이익을 창출할 수 있음을 보여줍니다. 따라서 병원들이 상환율 개선과 인건비 및 처리 능력의 성과를 통해 소프트웨어의 투자 대비 효과를 평가함에 따라, 병원 캐파시티 관리 솔루션 시장에서는 수용 능력 관리 도구와 진료 조정 소프트웨어를 함께 구매하는 사례가 증가하고 있습니다. 이로 인해 업무용 소프트웨어는 독립된 IT 지출 항목이 아니라, 가치 기반 의료 실천의 일부로 자리 잡고 있습니다.
기존 병원 IT 환경과의 통합에 수반되는 높은 복잡성
병원 캐파시티 관리 솔루션 시장은 다양한 병원 IT 환경을 아우르며 운영해야 하는 기술적 어려움으로 인해 여전히 큰 성장 둔화에 직면해 있습니다. 많은 급성기 의료 기관은 EHR, ADT, RTLS, 직원 배치, 병상 관리 용도 등 4-6개의 별도 임상·운영 시스템을 운영하고 있으며, 이러한 시스템은 대개 수년 간격을 두고 도입되었습니다. 용량 관리 플랫폼이 이러한 시스템군 전체에 걸친 심층적인 양방향 통합을 필요로 하는 경우, 대규모 의료 시스템에 이를 도입하는 데 12-24개월이 소요될 수 있습니다. ONC는 정보 블록 규제를 통해 이러한 장벽을 완화하려고 시도해 왔으나, 2025년 12월에 제안된 HTI-5 규정안에서는 인증 및 데이터 교환 요건에 여전히 재검토가 필요하다는 점이 드러나, 상호 운용성 문제가 완전히 해결되지 않았음을 알 수 있습니다. 따라서 전문 도구가 시범 운영에서 뛰어난 성과를 거두고 있더라도, 임베디드형 EHR 모듈 공급업체는 병원 캐파시티 관리 솔루션 시장에서 실질적인 우위를 유지하고 있습니다. 따라서, 미리 구축된 FHIR 커넥터, 모듈식 도입 및 관리형 통합 지원을 제공하는 벤더들은 병원 커패시티 관리 솔루션 시장에서 입지를 점차 강화하고 있습니다.
부문별 분석
2025년, 병상 관리 소프트웨어는 병원 캐파시티 관리 솔루션 시장 점유율의 37.82%를 차지하고 있으며, 이는 병상 추적, 환자 수 모니터링 및 전원 조정 도구에 대한 병원의 오랜 기간에 걸친 지출을 반영한 것입니다. 현재 병원 캐파시티 관리 솔루션 시장에서는 구매자의 선호도에 뚜렷한 변화가 나타나고 있습니다. 이는 환자 흐름 관리 소프트웨어 시장이 2031년까지 연평균 성장률(CAGR) 13.89%로 성장할 것으로 전망되기 때문입니다. 이러한 차이는 병원이 단순히 현재의 병상 현황을 보여주는 데 그치지 않고, 환자의 이동 전반을 관리할 수 있는 시스템을 원하고 있음을 보여줍니다. 이러한 변화는 소프트웨어 수요를 사후적인 가시화에서 환자의 전체 입원 기간에 걸친 조정된 행동으로 전환시킨다는 점에서 중요합니다.
퇴원 계획, 치료 조정 분석 및 다단계 경과 관리가 병원 캐파시티 관리 솔루션 시장 전반에서 더욱 시급한 업무 과제로 대두됨에 따라, 환자 흐름 관리 소프트웨어의 성장세가 가속화되고 있습니다. LeanTaaS는 2025년 6월, 외과 클리닉의 업무와 수술실 일정 관리를 연계하는 엔드투엔드 플랫폼으로서 'iQueue for Surgical Clinics'를 출시했습니다. 조기 도입 기관에 따르면, 사례 수가 10% 증가했으며, 외과 의사 1인당 연간 30만 달러의 추가 수익을 올렸다는 보고가 있습니다. 이 사례는 병원 캐파시티 관리 솔루션 업계에서 워크플로우 도구가 단순한 업무 지원 도구가 아니라 수익 지원 도구로 자리매김하고 있음을 보여줍니다. 수용 능력 계획 소프트웨어는 장기적인 병상 및 자산 계획에서 여전히 중요한 역할을 하고 있으며, 자원 관리 소프트웨어는 인력 배치의 효율화를 지원하고 있습니다. 또한, 간호사 및 수술실 이용률에 대한 압박이 커지는 가운데, 스케줄링 소프트웨어에 대한 수요도 확대되고 있습니다. 따라서 병원 캐파시티 관리 솔루션 시장은 이러한 업무들을 별개의 범주로 다루기보다는 환자의 동선과 직원 및 병실의 가용 현황을 연계하는 플랫폼으로 전환되고 있습니다.
2026년에는 클라우드 솔루션이 매출의 53.41%를 차지했는데, 이는 병원 캐파시티 관리 솔루션 시장에서 이전 조달 주기에서 이어져 온 대규모 도입 기반이 여전히 존재하고 있음을 보여줍니다. 많은 의료 시스템이 엔터프라이즈 SaaS의 가격 책정 방식이나 클라우드 규정 준수 모델이 정착되기 전에 이러한 플랫폼을 도입했기 때문에 현재 가장 큰 시장 점유율을 차지하고 있습니다. 한편, 병원 캐파시티 관리 솔루션 시장 전체에서 클라우드 기반 솔루션의 도입은 2031년까지 연평균 성장률(CAGR) 14.19%로 확대될 것으로 전망됩니다. 이러한 성장은 보다 신속한 도입과 인프라 운영 비용 절감을 원하는 신규 병원 및 외래 진료 시설에 기인한 것입니다.
병원 캐파시티 관리 솔루션 시장에서 클라우드 수요가 증가하고 있는 배경에는 클라우드 호스팅이 허용되는 경우 의료 기관이 온프레미스 하드웨어 비용을 절감하고 도입 기간을 단축할 수 있다는 장점이 있습니다. 반면, 엄격한 데이터 상주 요건을 부과하는 국가들, 특히 독일과 프랑스에서는 온프레미스 도입이 여전히 중요하게 여겨지고 있습니다. 이러한 국가에서는 주권 문제나 GDPR(EU 개인정보보호규정) 요건 때문에 공공 의료 기관이 온프레미스 호스팅을 선호하는 경향이 있습니다. 이러한 상황으로 인해, 임상 데이터를 온프레미스 시스템에 보관하면서 오케스트레이션 및 분석은 클라우드에서 수행하는 하이브리드 모델에 대한 수요가 생겨나고 있습니다. LeanTaaS의 보고서에 따르면, 이 회사의 고객 기반 중 60%는 Epic을, 30%는 Oracle Cerner를 이용하고 있으며, 이러한 집중화가 병원 캐파시티 관리 솔루션 시장의 통합 로드맵과 벤더 의존 패턴을 형성하고 있습니다. 그 결과, 단순히 한 도입 모델에서 다른 모델로 넘어가는 것이 아니라, 규정 준수, 기존 시스템, 그리고 배포 속도를 고려한 보다 선택적인 전환이 이루어지고 있습니다.
지역별 분석
2025년, 북미는 병원 캐파시티 관리 솔루션 시장 점유율의 48.41%를 차지했으며, 상업적으로 가장 성숙한 지역 시장이 되었습니다. 이러한 수요의 대부분은 미국이 주도하고 있으며, 이는 가치 기반 지불 모델, 상호 운용성 의무화, 그리고 AI에 중점을 둔 운영 업체들의 탄탄한 기반이 활발한 구매 환경을 뒷받침하고 있기 때문입니다. 캐나다와 멕시코는 여전히 소규모 수요 시장이지만, 디지털 헬스 분야에 대한 투자와 공공 자금을 통한 의료 네트워크에 대한 압박이 커짐에 따라 처리 능력 부족으로 인한 비용이 부각되면서 양국 모두 이 분야에 대한 관심이 높아지고 있습니다. 또한, 북미의 병원 캐파시티 관리 솔루션 시장은 다수의 시설에 걸쳐 플랫폼 표준화를 동시에 추진할 수 있는 근거를 제공하는 밀집된 기업형 의료 시스템의 존재로부터도 혜택을 받고 있습니다.
유럽은 병원 캐파시티 관리 솔루션 시장에서 여전히 2위의 규모를 자랑하며, 영국, 독일, 프랑스가 도입이 가장 활발한 지역입니다. 영국에서는 2024/25 회계연도 4분기에 일반 병상 및 급성기 병상의 가동률이 92.5%에 달함에 따라, 환자 흐름 및 퇴원 관리 소프트웨어가 운영상의 최우선 과제로 지정되었습니다. 독일에서는 병원 개혁과 통합을 통해 새로운 기회가 생겨나고 있습니다. 이로 인해 네트워크 수준의 조달이 일원화됨에 따라, 통합 시스템 내에서 효율성을 높이는 수단으로 수용 능력 관리를 제안하는 벤더가 유리한 입장에 설 가능성이 있습니다. 프랑스에서는 2025년 7월, CHRU 낭시가 Dedalus사와 제휴하여 국내 최초의 병원 지휘 센터 도입을 공식적으로 결정함으로써 중요한 도입 사례가 추가되었습니다. 이는 공립병원 그룹 전체에서 더 광범위한 관심이 쏠리고 있음을 시사합니다. GDPR(EU 개인정보보호규정) 및 각국의 호스팅 규제는 병원 캐파시티 관리 솔루션 시장의 아키텍처 선택을 계속해서 좌우하고 있으며, 이러한 규제로 인해 공공 기관에서는 하이브리드형이나 온프레미스형 설계를 선호하는 경향이 있습니다.
아시아태평양은 2031년까지 연평균 성장률(CAGR) 15.94%를 나타낼 것으로 예측되며, 병원 캐파시티 관리 솔루션 시장에서 가장 두드러진 성장세를 보이는 지역입니다. 일본에서는 커맨드 센터 도입 및 병원 관리의 디지털화 진전을 통해 활발한 수요가 나타나고 있으며, 2026년 5월 NEC의 병원 관리 DX 서비스 개시나 2025년 나가사키현에서 후지쯔가 '겐큐카이'에 도입한 사례 등을 들 수 있습니다. 중국과 인도에서는 성숙한 서유럽 병원 시스템에 비해 기존 전자건강기록(EHR)에 대한 종속성이 비교적 약하기 때문에 대규모 신규 도입 기회가 기대되며, 이를 통해 초기 도입 시 통합 과정에서 발생할 수 있는 마찰을 줄일 수 있을 것으로 보입니다. 호주는 멜버른의 각 병원에서 진행 중인 커맨드 센터 프로젝트를 통해 계속해서 초기 시범 시장으로서의 역할을 수행하고 있는 반면, 중동 및 아프리카에서는 GCC 국가들과 사우디아라비아의 '비전 2030' 아젠다가 주도하는 공공 부문 현대화 프로그램의 혜택을 받고 있습니다. 남미에서는 보다 완만한 확대세가 나타나고 있으며, 브라질과 아르헨티나의 민간 병원들이 대도시권 네트워크 내에서 환자 흐름 관리 및 예약 관리 도구의 선택적 도입을 뒷받침하고 있습니다. 따라서 병원 캐파시티 관리 솔루션 시장은 디지털화, 신규 시설 건설, 현대화에 대한 수요가 레거시 시스템의 제약이 적은 지역과 맞물리면서 가장 빠르게 성장하고 있습니다.
기타 혜택 :
- 엑셀 형식 시장 예측(ME) 시트
- 3개월간의 애널리스트 지원
자주 묻는 질문
목차
제1장 서론
제2장 조사 방법
제3장 주요 요약
제4장 시장 구도
제5장 시장 규모 및 성장 예측
제6장 경쟁 구도
제7장 시장 기회 및 향후 전망
AJY 26.07.07According to Mordor Intelligence, the hospital capacity management solutions market size is expected to grow from USD 4.77 billion in 2025 to USD 5.35 billion in 2026 and is forecast to reach USD 10.07 billion by 2031 at 13.47% CAGR over 2026-2031.
This report is Segmented by Solution Type (Capacity Management, Patient Flow Management, Resource Management, and More), Deployment Mode (Cloud-Based, On-Premises), Component (Software, Services), End User (Hospitals, and More), Workflow (Pre-Admission, and More), Geography (North America, Europe, and More). The Market Forecasts are Provided in Terms of Value (USD).
Global Hospital Capacity Management Solutions Market Trends and Insights
Rising Inpatient Throughput Pressure And Bed Turnover Constraints
The hospital capacity management solutions market is benefiting from a basic operating problem inside acute care settings, which is that patient inflow is rising faster than discharge coordination can respond. NHS England data showed general and acute bed occupancy at 92.5% in Q4 2024/25, which was above both the 90% ceiling recommended by NICE and normal NHS operating guidance. Vizient also reported in May 2026 that global hospital occupancy is projected to move above the 85.0% safety threshold by 2032 if current coordination patterns continue. The same analysis found that 2% of admissions account for 15% of prolonged inpatient days, and those excess days add USD 2,093 per day in avoidable costs. Only 36% of surveyed hospitals had standardized discharge escalation protocols across most inpatient units, and only 33% of academic medical centers reported full case manager-led interdisciplinary rounding, which shows that many delays still come from fragmented coordination rather than pure bed shortage. That pattern is pushing the hospital capacity management solutions market toward platforms that combine escalation logic, social needs review, and discharge workflow automation in one operating layer instead of adding another isolated dashboard.
Value-Based Care And Length-Of-Stay Reduction Programs
The hospital capacity management solutions market is also being supported by payment frameworks that connect reimbursement more directly to efficiency and patient progression. CMS confirmed through the FY2025 IPPS final rule that hospital performance is assessed across outcomes, safety, efficiency, and patient experience, which keeps length of stay management close to the financial core of hospital operations. A quality initiative conducted across 7 facilities and 283,517 discharges between August 2024 and July 2025 reduced the observed-to-expected length of stay ratio from 1.07 to 0.99, increased discharges by 3,863, and lowered emergency department boarding hours from 14.1 to 10.4. Those results show that discharge planning and progression management can produce operational gains at a scale that finance teams can recognize. The hospital capacity management solutions market is therefore seeing more combined buying of capacity tools and care coordination software as hospitals evaluate software return through reimbursement improvement, as well as labor and throughput performance. This is making operational software part of value-based care execution rather than a separate IT spending line.
High Integration Complexity With Legacy Hospital IT Stacks
The hospital capacity management solutions market still faces a major slowdown from the technical difficulty of working across mixed hospital IT environments. Many acute care providers operate with 4 to 6 separate clinical and operational systems, including EHR, ADT, RTLS, staffing, and bed management applications, and those systems were often purchased years apart. When a capacity platform needs deep bidirectional integration across that stack, implementation in a large health system can take 12 to 24 months. ONC has tried to reduce this friction through information blocking rules, yet the December 2025 HTI-5 proposed rule showed that certification and exchange requirements still need revision, which suggests that interoperability challenges have not been fully resolved. This gives embedded EHR module vendors a practical advantage in the hospital capacity management solutions market, even when specialist tools show strong pilot outcomes. Vendors that provide pre-built FHIR connectors, modular rollouts, and managed integration support are therefore improving their position in the hospital capacity management solutions market.
Other drivers and restraints analyzed in the detailed report include:
- AI-Driven Predictive Capacity Orchestration
- Interoperability Mandates Across EHR, ADT, RTLS, And Staffing Systems
- Upfront Implementation Cost And Long ROI Payback Cycles
For complete list of drivers and restraints, kindly check the Table Of Contents.
Segment Analysis
Capacity management software held 37.82% of the hospital capacity management solutions market share in 2025, which reflects long-standing hospital spending on bed tracking, census monitoring, and transfer coordination tools. The hospital capacity management solutions market is now showing a clear shift in buyer preference because Patient Flow Management Software is projected to expand at 13.89% CAGR through 2031. That gap shows that hospitals want systems that manage the full movement of a patient rather than only showing the current bed status. The change is important because it moves software demand from reactive visibility toward coordinated action across the patient stay.
Patient flow management software is gaining momentum because discharge planning, care coordination analytics, and multi-step progression management have become more urgent operating tasks across the hospital capacity management solutions market. LeanTaaS launched iQueue for Surgical Clinics in June 2025 as an end-to-end platform that connects surgical clinic activity with operating room scheduling, and early adopters reported 10% case growth and USD 300,000 in added revenue per surgeon each year. That example shows how workflow tools in the hospital capacity management solutions industry are increasingly framed as revenue support tools instead of simple operating aids. Capacity planning software remains relevant for long-range bed and asset planning, while resource management software supports staffing efficiency, and scheduling software is gaining ground as nurse and operating room utilization comes under more pressure. The hospital capacity management solutions market is therefore moving toward platforms that connect patient movement with staff and room availability rather than treating those tasks as separate categories.
Cloud solutions accounted for 53.41% of revenue in 2026, which shows that the hospital capacity management solutions market still carries a large installed base from earlier procurement cycles. The largest current share belongs to these platforms because many health systems adopted them before enterprise SaaS pricing and cloud compliance models became more established. At the same time, cloud-based deployment is forecast to grow at 14.19% CAGR through 2031 across the hospital capacity management solutions market. This growth is coming from greenfield hospitals and ambulatory settings that want faster deployment and lower infrastructure overhead.
The hospital capacity management solutions market is seeing cloud demand rise because providers can reduce local hardware spending and shorten implementation timelines when cloud hosting is acceptable. On-premises deployment still matters in countries that have strict data residency rules, especially Germany and France, where public providers often favor local hosting because of sovereignty and GDPR requirements. This has created room for hybrid models that keep clinical data on local systems but run orchestration and analytics in the cloud. LeanTaaS reported that 60% of its customer base uses Epic and 30% uses Oracle Cerner, and that concentration shapes integration roadmaps and vendor dependency patterns inside the hospital capacity management solutions market. The result is not a simple move from one deployment model to another, but a more selective migration based on compliance, installed base, and speed of rollout.
Complete Report Scope:
- By Solution Type
- Capacity Management Software
- Capacity Planning Software
- Patient Flow Management Software
- Resource Management Software
- Scheduling Software
- By Deployment Mode
- Cloud-Based
- On-Premises
- By Component
- Software
- Services
- By End User
- Hospitals
- Public Hospitals
- Private Hospitals
- Specialty Hospitals
- Teaching Hospitals
- Children's Hospitals
- Ambulatory Surgical Centers/Outpatient Centers
- Specialty Clinics and Other Care Facilities
- Hospitals
- By Workflow
- Pre-Admission
- During Admission
- Post-Discharge
- By Geography
- North America
- United States
- Canada
- Mexico
- Europe
- Germany
- United Kingdom
- France
- Italy
- Spain
- Rest of Europe
- Asia-Pacific
- China
- Japan
- India
- Australia
- South Korea
- Rest of Asia-Pacific
- Middle East & Africa
- GCC
- South Africa
- Rest of Middle East & Africa
- South America
- Brazil
- Argentina
- Rest of South America
- North America
Geography Analysis
North America accounted for 48.41% of the hospital capacity management solutions market share in 2025, which made it the most commercially mature regional market. The United States drives most of that demand because value-based payment models, interoperability mandates, and a strong base of AI-focused operational vendors support active buying conditions. Canada and Mexico remain smaller demand centers, but both are seeing interest rise as digital health investment and pressure on publicly funded care networks expose the cost of poor throughput. The hospital capacity management solutions market in North America also benefits from dense enterprise health systems that can justify platform standardization across many facilities at once.
Europe remains the second-largest region in the hospital capacity management solutions market, with the United Kingdom, Germany, and France forming the deepest adoption base. In the United Kingdom, general and acute bed occupancy reached 92.5% in Q4 2024/25, which kept patient flow and discharge software high on the operational agenda. Germany is creating opportunities through hospital reform and consolidation, which can concentrate purchasing at the network level and favor vendors that present capacity management as an efficiency layer for merged systems. France added an important reference case in July 2025 when CHRU Nancy formalized the first hospital command centre deployment in the country with Dedalus, which points to wider enterprise interest across public hospital groupings. GDPR and national hosting rules continue to shape architecture choices in the hospital capacity management solutions market, and those rules often favor hybrid or on-premises designs in public settings.
Asia-Pacific is forecast to grow at 15.94% CAGR through 2031, which makes it the fastest-growing regional part of the hospital capacity management solutions market. Japan is showing active demand through command center adoption and broader hospital management digitization, including NEC's hospital management DX service launch in May 2026 and Fujitsu's 2025 deployment for Genkyukai in Nagasaki Prefecture. China and India present large greenfield opportunities because legacy EHR lock-in is lighter than in mature Western hospital systems, which can reduce integration friction during first deployments. Australia continues to serve as an early reference market through command center projects across Melbourne hospitals, while the Middle East and Africa are benefiting from public modernization programs led by GCC states and Saudi Arabia's Vision 2030 agenda. South America is expanding more gradually, with private hospital investment in Brazil and Argentina supporting selective procurement of patient flow and scheduling tools in larger urban networks. The hospital capacity management solutions market is therefore growing fastest where digitization, new facility buildout, and modernization needs combine with fewer legacy constraints.
- Alcidion Group Limited
- Awarepoint Corporation
- Central Logic, Inc.
- Change Healthcare, Inc.
- Cognizant
- Dedalus S.p.A.
- Epic Systems
- GE HealthCare Technologies Inc.
- Infor, Inc.
- Infosys
- Intersystems
- Koninklijke Philips
- LeanTaaS, Inc.
- Mckesson
- Oracle
- Qventus, Inc.
- Securitas Healthcare LLC
- Siemens Healthineers
- Sonitor Technologies, Inc.
- Stryker
- TeleTracking Technologies, Inc.
- WellSky Corporation
Additional Benefits:
- The market estimate (ME) sheet in Excel format
- 3 months of analyst support
TABLE OF CONTENTS
1 Introduction
- 1.1 Study Assumptions & Market Definition
- 1.2 Scope of the Study
2 Research Methodology
3 Executive Summary
4 Market Landscape
- 4.1 Market Overview
- 4.2 Market Drivers
- 4.2.1 Rising Inpatient Throughput Pressure and Bed Turnover Constraints
- 4.2.2 Value-Based Care and Length-Of-Stay Reduction Programs
- 4.2.3 AI-Driven Predictive Capacity Orchestration
- 4.2.4 Interoperability Mandates Across EHR, ADT, RTLS, and Staffing Systems
- 4.2.5 Workforce Scarcity and Nurse Scheduling Optimization Needs
- 4.2.6 Real-Time Command Center Adoption Across Multi-Site Health Systems
- 4.3 Market Restraints
- 4.3.1 High Integration Complexity With Legacy Hospital IT Stacks
- 4.3.2 Upfront Implementation Cost and Long ROI Payback Cycles
- 4.3.3 Data Governance, Cybersecurity, and Consent Management Burden
- 4.3.4 Change Resistance From Clinicians and Operations Teams
- 4.4 Value / Supply-Chain Analysis
- 4.5 Regulatory Landscape
- 4.6 Technological Outlook
- 4.7 Porter's Five Forces Analysis
- 4.7.1 Threat of New Entrants
- 4.7.2 Bargaining Power of Suppliers
- 4.7.3 Bargaining Power of Buyers
- 4.7.4 Threat of Substitutes
- 4.7.5 Industry Rivalry
5 Market Size & Growth Forecasts
- 5.1 By Solution Type
- 5.1.1 Capacity Management Software
- 5.1.2 Capacity Planning Software
- 5.1.3 Patient Flow Management Software
- 5.1.4 Resource Management Software
- 5.1.5 Scheduling Software
- 5.2 By Deployment Mode
- 5.2.1 Cloud-Based
- 5.2.2 On-Premises
- 5.3 By Component
- 5.3.1 Software
- 5.3.2 Services
- 5.4 By End User
- 5.4.1 Hospitals
- 5.4.1.1 Public Hospitals
- 5.4.1.2 Private Hospitals
- 5.4.1.3 Specialty Hospitals
- 5.4.1.4 Teaching Hospitals
- 5.4.1.5 Children's Hospitals
- 5.4.2 Ambulatory Surgical Centers/Outpatient Centers
- 5.4.3 Specialty Clinics and Other Care Facilities
- 5.4.1 Hospitals
- 5.5 By Workflow
- 5.5.1 Pre-Admission
- 5.5.2 During Admission
- 5.5.3 Post-Discharge
- 5.6 By Geography
- 5.6.1 North America
- 5.6.1.1 United States
- 5.6.1.2 Canada
- 5.6.1.3 Mexico
- 5.6.2 Europe
- 5.6.2.1 Germany
- 5.6.2.2 United Kingdom
- 5.6.2.3 France
- 5.6.2.4 Italy
- 5.6.2.5 Spain
- 5.6.2.6 Rest of Europe
- 5.6.3 Asia-Pacific
- 5.6.3.1 China
- 5.6.3.2 Japan
- 5.6.3.3 India
- 5.6.3.4 Australia
- 5.6.3.5 South Korea
- 5.6.3.6 Rest of Asia-Pacific
- 5.6.4 Middle East & Africa
- 5.6.4.1 GCC
- 5.6.4.2 South Africa
- 5.6.4.3 Rest of Middle East & Africa
- 5.6.5 South America
- 5.6.5.1 Brazil
- 5.6.5.2 Argentina
- 5.6.5.3 Rest of South America
- 5.6.1 North America
6 Competitive Landscape
- 6.1 Market Concentration
- 6.2 Market Share Analysis
- 6.3 Company Profiles (includes Global level Overview, Market-level Overview, Core Segments, Financials, Strategic Information, Market Rank/Share, Products & Services, Recent Developments)
- 6.3.1 Alcidion Group Limited
- 6.3.2 Awarepoint Corporation
- 6.3.3 Central Logic, Inc.
- 6.3.4 Change Healthcare, Inc.
- 6.3.5 Cognizant Technology Solutions Corporation
- 6.3.6 Dedalus S.p.A.
- 6.3.7 Epic Systems Corporation
- 6.3.8 GE HealthCare Technologies Inc.
- 6.3.9 Infor, Inc.
- 6.3.10 Infosys Limited
- 6.3.11 InterSystems Corporation
- 6.3.12 Koninklijke Philips N.V.
- 6.3.13 LeanTaaS, Inc.
- 6.3.14 McKesson Corporation
- 6.3.15 Oracle
- 6.3.16 Qventus, Inc.
- 6.3.17 Securitas Healthcare LLC
- 6.3.18 Siemens Healthineers AG
- 6.3.19 Sonitor Technologies, Inc.
- 6.3.20 Stryker Corporation
- 6.3.21 TeleTracking Technologies, Inc.
- 6.3.22 WellSky Corporation
7 Market Opportunities & Future Outlook
- 7.1 White-space & Unmet-need Assessment