

|
시장보고서
상품코드
2073073
회의실용 하드웨어 시장 : 점유율 분석, 업계 동향과 통계, 성장 예측(2026-2031년)Conference Room Hardware - Market Share Analysis, Industry Trends & Statistics, Growth Forecasts (2026 - 2031) |
||||||
 Mordor Intelligence
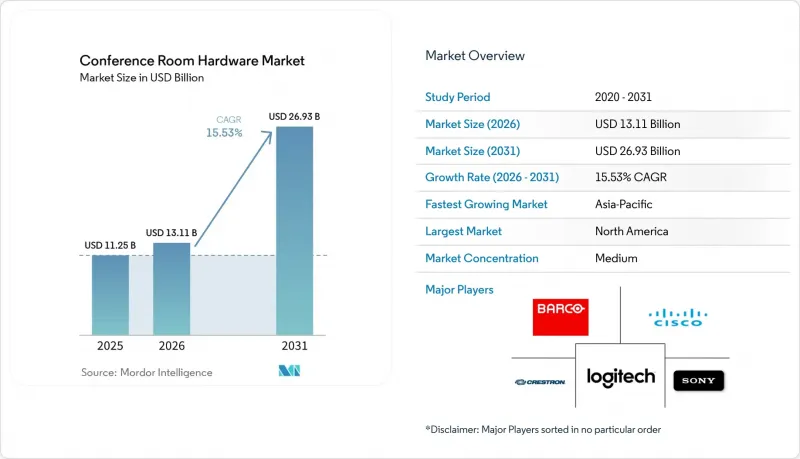
Mordor Intelligence에 의하면, 회의실용 하드웨어 시장 규모는 2025년에 112억 5,000만 달러로 평가되었고 2026년 131억 1,000만 달러에서 2031년까지 269억 3,000만 달러에 이를 것으로 예측되며, 예측 기간(2026-2031년) CAGR은 15.53%를 나타낼 전망입니다.
본 보고서는 하드웨어 유형(화상 회의용 하드웨어, 디스플레이 및 프레젠테이션용 하드웨어, 음성 회의용 하드웨어, 기타), 회의실 규모(허들룸/소규모 회의실, 중규모 회의실, 기타), 최종 사용자 산업(상업시설, 교육 기관, 기타), 연결 방식(유선, 기타), 지역별로 분류되어 있습니다. 시장 전망은 금액(달러) 기준으로 제시되어 있습니다.
전 세계 회의실용 하드웨어 시장 동향 및 인사이트
하이브리드 근무 모델의 확산이 소규모 회의실용 하드웨어 업그레이드를 촉진하고 있습니다.
하이브리드 근무가 표준 업무 형태로 자리 잡으면서, 기업들은 미사용 공간을 2-6명을 수용할 수 있는 화상 회의가 가능한 소규모 회의실로 전환하고 있습니다. 허들룸과 소규모 회의실은 2025년에 이미 47.11%의 점유율을 차지하고 있으며, 2031년까지 연평균 성장률(CAGR) 16.53%로 성장할 전망입니다. 이는 대규모 임원 회의실에서 자금이 이동하고 있음을 반영하고 있습니다. 360도 비디오, AI 기반 스피커 추적, USB-C 도킹 기능을 갖춘 새로운 올인원 바는 설치를 간소화하고 핫데스크 사용을 가능하게 합니다. 그 결과, 조직의 모든 수준에서 고품질의 협업이 확산되어 출장 예산 절감과 민첩한 업무 흐름의 가속화로 이어지고 있습니다.
AI가 탑재된 오디오·비디오 기능이 교체 수요를 끌어올렸습니다.
회의실용 하드웨어 분야에서 인공지능은 차별화 요소에서 표준 요건으로 전환되고 있으며, 레거시 시스템은 실시간 처리에 필요한 연산 능력이 부족하기 때문에 업데이트 주기가 빨라지고 있습니다. 2025년에 출시된 로지텍의 “Rally Bar”와 “Rally Bar Mini”는 AI 기반의 자동 프레임 조정, 화자 추적, 노이즈 억제 기능을 통합하여, 수동으로 카메라를 조정할 필요 없이 방송 품질의 영상을 촬영합니다. 자브라의 “PanaCast 50”는 3대의 13메가픽셀 카메라와 엣지 기반 AI를 채택하여, 지능형 줌 기능을 갖춘 180도 파노라마 시야를 구현함으로써, 원격 참가자들이 신체 언어나 화이트보드 내용을 확실하게 파악할 수 있도록 합니다.
통합형 회의실 시스템의 총 소유 비용(TCO)이 높다는 점
총 소유 비용은 카메라나 디스플레이의 구매 비용뿐만 아니라 소프트웨어 라이선스, 네트워크 업그레이드, 지원 비용 등도 포함되기 때문에 5년 동안의 지출이 3배로 늘어날 가능성이 있습니다. Teams Rooms 프리미엄 구독은 표준 라이프사이클 기준 1실당 2,400달러의 추가 비용이 발생하며, 복잡한 회의실 설치에 드는 인건비는 4만 5,000달러에 달할 수도 있습니다. 무선 프레젠테이션 및 자동 설정 기능이 탑재된 오디오 장비를 제공하는 업체들은 이러한 비용 절감을 목표로 하고 있지만, 자금 면에서의 장벽이 여전히 존재하기 때문에 소규모 조직에서는 본격적인 도입을 주저하고 있습니다.
부문별 분석
2025년, 화상 회의용 하드웨어는 시장 점유율의 39.28%를 차지하며 모든 협업 공간의 기반이 되는 요소로서의 역할을 반영하고 있지만, 도입 기반이 성숙 단계에 접어들고 중급 시스템의 교체 주기가 5-7년에 달함에 따라 성장세는 둔화되고 있습니다. 2025년에 도입된 Crestron의 ‘AutoMeasure”기술은 AI를 활용해 실내의 음향 특성을 분석하고 오디오 처리 매개변수를 자동으로 설정함으로써, 시운전 시간을 몇 시간에서 몇 분으로 단축하고 총 소유 비용(TCO)을 절감합니다.
제어 및 ·자동화 시스템 시장은 2026년부터 2031년까지 연평균 성장률(CAGR) 17.11%로 확대되고 있으며, 기업들이 IT 지원 문의를 줄이고 설정의 번거로움을 덜어주는 원터치 회의 경험을 우선시함에 따라 시장 전체 성장률인 15.53%를 상회하고 있습니다. 디스플레이 및 프레젠테이션용 하드웨어는 원격 참가자의 가시성을 높여주는 4K 및 8K 해상도 패널로의 전환을 배경으로 안정적인 수요가 예상됩니다. 한편, 음성 회의용 하드웨어는 시끄러운 오픈 플랜 환경에서도 개별 목소리를 선명하게 포착하는 빔포밍 마이크 어레이의 보급으로 인해 수요가 확대되고 있습니다. 또한, 무선 프레젠테이션 시스템이나 USB 주변기기 등 기타 하드웨어의 경우, 직원들이 전용 동글이나 소프트웨어를 설치하지 않고도 개인 노트북을 연결할 수 있기를 기대하는 ‘BYOD(Bring Your Own Device)”의 시나리오에서 주목을 받고 있습니다.
허들룸과 소규모 회의실은 2025년에 47.11%의 시장 점유율을 차지할 것으로 예상되며, 2031년까지 연평균 성장률(CAGR) 16.53%로 확대될 전망인데, 이는 모든 회의실 규모 중 가장 빠른 성장률입니다. 설비 투자 절감, 인테리어 공사의 신속화, 애자일 팀 운영 방식과의 적합성 덕분에 이러한 소형 공간은 팬데믹 이후 사무실 재설계의 핵심으로 떠오르고 있습니다. 중규모 회의실은 조직이 부서별 회의 공간의 필요성과, 더 소규모의 회의실을 다수 설치하는 것을 선호하는 예산상의 제약 사이에서 균형을 맞추는 과정에서 완만한 성장세를 보이고 있습니다.
대형 회의실은 몰입감 있는 음향과 멀티 카메라 촬영이 필요한 이사회 수준의 논의나 고객 대상 프레젠테이션에서 여전히 필수적이지만, 회의실용 하드웨어 시장에서 차지하는 비중은 극히 미미합니다. 대학에서는 캠퍼스 내 학습용 포드를 화상 회의가 가능한 공간으로 재활용하는 추세가 나타나고 있으며, 소규모 회의실에 대한 투자가 교육 및 의료 현장으로도 확산되고 있음을 보여주고 있습니다. 예를 들어, 텍사스 대학교 알링턴 캠퍼스는 하이브리드 학습을 지원하기 위해 2025년에 150개의 허들룸을 도입했습니다. 이 학교는 플러그 앤 플레이 방식의 USB 연결과 AI 기반 스피커 추적 기능을 갖춘 로지텍의 ‘Rally Bar Mini” 시스템을 도입했습니다.
지역별 분석
북미는 하이브리드 근무 방식으로의 조기 전환과 Microsoft Teams Rooms의 광범위한 도입 실적을 바탕으로, 2025년 회의실용 하드웨어 시장 매출의 35.84%를 차지했습니다. 많은 기업들이 반도체 가격의 안정화와 지속가능성 지표의 개선을 기다리는 동안 신규 도입을 일시 중단하고 있기 때문에 이 지역의 성장은 눈부시다기보다는 꾸준한 임베디드니다. 이러한 성숙도는 대규모 신규 도입보다는 기존 설비의 업그레이드로 초점이 이동하고 있음을 반영하고 있습니다.
아시아태평양은 2026년부터 2031년까지 연평균 성장률(CAGR) 17.63%를 나타낼 것으로 예측되며, 이는 명백한 성장 동력이 되고 있습니다. 중국과 인도에서 기업들의 디지털화 물결은 일본과 한국의 정부 주도의 스마트시티 프로젝트와 시기를 같이하고 있으며, 이로 인해 모든 기능을 갖춘 회의실 키트에 대한 대량 주문이 이어지고 있습니다. 현지 조립 공장 및 판매 파트너들이 리드타임을 단축함으로써, 지역 제조업체들은 미국 및 유럽의 기존 기업들에 비해 우위를 점하고 있습니다. 이러한 추세는 신흥 경제국 전반에 걸쳐 중소기업에서의 도입 확대와 공공 부문의 디지털화 이니셔티브에 힘입어 더욱 가속화되고 있습니다.
유럽에서는 에너지 효율이 높은 엔드포인트와 순환형 경제 프로그램을 뒷받침하는 엄격한 ESG 정책에 힘입어 균형 잡힌 성장세를 보이고 있습니다. 라틴아메리카와 중동 및 아프리카는 절대 수치상으로는 규모가 작지만, 은행, 석유 및 가스, 고등교육 부문에서 프로젝트 수가 증가하는 추세입니다. 환율 변동과 수입 관세는 여전히 제약 요인으로 작용하고 있지만, 설치 번거로움을 최소화하는 무선 솔루션이 비용 측면의 장벽을 일부 완화하고 있습니다. 또한, 데이터 개인정보 보호 및 친환경 조달에 관한 규제의 일관성이 공급업체 선정 및 도입 전략을 지속적으로 형성하고 있습니다.
기타 혜택
- 엑셀 형식 시장 예측(ME) 시트
- 3개월간의 애널리스트 지원
자주 묻는 질문
목차
제1장 서론
제2장 조사 방법
제3장 주요 요약
제4장 시장 구도
제5장 시장 규모와 성장 예측
제6장 경쟁 구도
제7장 시장 기회와 향후 전망
JHS 26.07.07According to Mordor Intelligence, the conference room hardware market size was valued at USD 11.25 billion in 2025 and estimated to grow from USD 13.11 billion in 2026 to reach USD 26.93 billion by 2031, at a CAGR of 15.53% during the forecast period (2026-2031).
This report is Segmented by Hardware Type (Video Conferencing Hardware, Display and Presentation Hardware, Audio Conferencing Hardware, and More), Room Size (Huddle Rooms/Small Meeting Rooms, Medium Rooms, and More), End-User Industry (Commercial Spaces, Education Institutions, and More), Connectivity (Wired, and More), and Geography. The Market Forecasts are Provided in Terms of Value (USD).
Global Conference Room Hardware Market Trends and Insights
Accelerated Hybrid Work Models Driving Small-Room Hardware Upgrades
Hybrid work has become the default operating framework, prompting enterprises to convert unused areas into video-enabled huddle rooms seating 2 to 6 people. Huddle and small rooms already held 47.11% share in 2025 and are on pace for a 16.53% CAGR through 2031, reflecting a capital shift away from large boardrooms. New all-in-one bars featuring 360-degree video, AI speaker tracking, and USB-C docking simplify installation and support hot-desking. The result is a democratization of high-quality collaboration that reaches every level of the organization, trimming travel budgets and accelerating agile workflows.
AI-Enabled Audio and Video Features Raising Refresh Demand
Artificial intelligence has migrated from differentiator to baseline expectation in conference room hardware, accelerating replacement cycles as legacy systems lack computational headroom for real-time processing. Logitech's Rally Bar and Rally Bar Mini, launched in 2025, integrate AI-driven auto-framing, speaker tracking, and noise suppression, delivering broadcast-quality video without manual camera adjustments. Jabra's PanaCast 50 employs three 13-megapixel cameras and edge-based AI to generate a 180-degree panoramic field of view with intelligent zoom, ensuring remote participants can read body language and whiteboard content.
High Total Cost of Ownership for Integrated Room Systems
The total cost extends beyond the invoice for cameras and displays to include software licenses, network upgrades, and support, which can triple the five-year expenditure. Premium subscriptions for Teams Rooms add USD 2,400 per room over a standard lifecycle, while labor for complex boardrooms can reach USD 45,000. Vendors offering wireless presentation and self-configuring audio aim to trim these costs, yet capital hurdles still deter smaller organizations from full-scale rollouts.
Other drivers and restraints analyzed in the detailed report include:
- Declining USB Peripheral Costs Enabling SME Adoption
- Vendor-Neutral Certification by UCaaS Platforms Boosting Hardware Replacement Cycles
- Semiconductor Supply Chain Volatility and Tariff Uncertainty
For complete list of drivers and restraints, kindly check the Table Of Contents.
Segment Analysis
Video conferencing hardware held 39.28% market share in 2025, reflecting its role as the foundational element of any collaboration space, yet growth is moderating as the installed base matures and replacement cycles extend to 5-7 years for mid-range systems. Crestron's AutoMeasure technology, introduced in 2025, uses AI to analyze room acoustics and automatically configure audio processing parameters, reducing commissioning time from hours to minutes and lowering the total cost of ownership.
Control and automation systems are expanding at 17.11% CAGR during 2026-2031, outpacing the 15.53% overall market growth as enterprises prioritize one-touch meeting experiences that eliminate IT support calls and reduce setup friction. Display and presentation hardware is experiencing steady demand driven by the shift toward 4K and 8K resolution panels that enhance visual clarity for remote participants, while audio conferencing hardware benefits from the proliferation of beamforming microphone arrays that isolate voices in noisy open-plan environments. Other hardware types, including wireless presentation systems and USB peripherals, are gaining traction in bring-your-own-device scenarios where employees expect to connect personal laptops without proprietary dongles or software installations.
Huddle rooms and small meeting rooms commanded 47.11% market share in 2025 and are advancing at 16.53% CAGR through 2031, the fastest among all room sizes. Lower capital outlay, faster fit-outs, and alignment with agile team styles make these compact spaces the focal point of post-pandemic office redesigns. Medium rooms are experiencing moderate growth as organizations balance the need for departmental meeting spaces with budget constraints that favor smaller, more numerous installations.
Large rooms remain vital for board-level discussions and client presentations that demand immersive audio and multi-camera coverage, yet they account for only a small share of the conference room hardware market. Universities illustrate the trend as campuses repurpose study pods into video-enabled niches, proving that small-room investment carries over to education and healthcare settings. For instance, the University of Texas at Arlington deployed 150 huddle rooms in 2025 to support hybrid learning, selecting Logitech Rally Bar Mini systems for their plug-and-play USB connectivity and AI-driven speaker tracking.
Complete Report Scope:
- By Hardware Type
- Video Conferencing Hardware
- Display and Presentation Hardware
- Audio Conferencing Hardware
- Control and Automation Systems
- Other Hardware Type
- By Room Size
- Huddle Rooms/Small Meeting Rooms
- Medium Rooms
- Large Rooms
- Other Room Sizes
- By End-user Industry
- Commercial Spaces
- Education Institutions
- Government and Public Sector
- Healthcare Facilities
- Other End-user Industries
- By Connectivity
- Wired
- Wireless
- Hybrid
- By Geography
- North America
- United States
- Canada
- Mexico
- South America
- Brazil
- Argentina
- Rest of South America
- Europe
- Germany
- United Kingdom
- France
- Italy
- Spain
- Russia
- Rest of Europe
- Asia-Pacific
- China
- Japan
- South Korea
- India
- Australia and New Zealand
- Rest of Asia-Pacific
- Middle East
- Saudi Arabia
- United Arab Emirates
- Turkey
- Rest of Middle East
- Africa
- South Africa
- Egypt
- Rest of Africa
- North America
Geography Analysis
North America accounted for 35.84% of 2025 revenue in the conference room hardware market due to its early pivot to hybrid work and its broad installed base of Microsoft Teams Rooms. Growth in the region is steady rather than spectacular, as many enterprises pause new rollouts until semiconductor pricing stabilizes and sustainability metrics improve. This maturity also reflects a shift toward upgrading existing deployments rather than large-scale net-new installations.
Asia-Pacific is the clear growth engine with a projected 17.63% CAGR over 2026-2031. Enterprise digitalization waves in China and India coincide with government smart-city projects in Japan and South Korea, bringing bulk orders for full-featured room kits. Local assembly plants and channel partners shorten lead times, giving regional manufacturers an edge against U.S. and European incumbents. This is further reinforced by strong SME adoption and public-sector digitization initiatives across emerging economies.
Europe shows balanced momentum, helped by strict ESG policies that favor energy-efficient endpoints and circular-economy programs. Latin America, the Middle East, and Africa are smaller in absolute terms yet exhibit rising project counts in banking, oil and gas, and higher education. Currency volatility and import duties remain constraints, but wireless solutions that minimize installation effort are mitigating some cost hurdles. Additionally, regulatory alignment around data privacy and green procurement continues to shape vendor selection and deployment strategies.
- Logitech International S.A.
- Cisco Systems, Inc.
- Sony Group Corporation
- Crestron Electronics, Inc.
- Barco NV
- DTEN Inc.
- Panasonic Holdings Corporation
- Shure Incorporated
- Sennheiser electronic GmbH & Co. KG
- Yamaha Corporation
- Biamp Systems, LLC
- ClearOne, Inc.
- Aver Information Inc.
- GN Audio A/S (Jabra)
- Huddly AS
- Yealink Network Technology Co., Ltd.
- Huawei Technologies Co., Ltd.
- ZTE Corporation
- Lifesize, Inc.
- Owl Labs, Inc.
Additional Benefits:
- The market estimate (ME) sheet in Excel format
- 3 months of analyst support
TABLE OF CONTENTS
1 INTRODUCTION
- 1.1 Study Assumptions and Market Definition
- 1.2 Scope of the Study
2 RESEARCH METHODOLOGY
3 EXECUTIVE SUMMARY
4 MARKET LANDSCAPE
- 4.1 Market Overview
- 4.2 Market Drivers
- 4.2.1 Accelerated Hybrid Work Models Driving Small-Room Hardware Upgrades
- 4.2.2 AI-Enabled Audio and Video Features Raising Refresh Demand
- 4.2.3 Declining USB Peripheral Costs Enabling SME Adoption
- 4.2.4 Vendor-Neutral Certification by UCaaS Platforms Boosting Hardware Replacement Cycles
- 4.2.5 ESG and Energy-Efficient Room Devices Influencing Procurement Decisions
- 4.2.6 4K/8K Camera and Ultra-Wide Display Adoption Enhancing Meeting Equity
- 4.3 Market Restraints
- 4.3.1 High Total Cost of Ownership for Integrated Room Systems
- 4.3.2 Semiconductor Supply Chain Volatility and Tariff Uncertainty
- 4.3.3 Interoperability Challenges Between Legacy AV and Modern UC Platforms
- 4.3.4 Growing Security and Privacy Compliance Burden in Meeting Spaces
- 4.4 Industry Value Chain Analysis
- 4.5 Regulatory Landscape
- 4.6 Technological Outlook
- 4.7 Impact of Macroeconomic Factors on the Market
- 4.8 Industry Attractiveness - Porter's Five Forces Analysis
- 4.8.1 Threat of New Entrants
- 4.8.2 Bargaining Power of Buyers
- 4.8.3 Bargaining Power of Suppliers
- 4.8.4 Threat of Substitutes
- 4.8.5 Intensity of Competitive Rivalry
- 4.9 Pricing Analysis
5 MARKET SIZE AND GROWTH FORECASTS (VALUE)
- 5.1 By Hardware Type
- 5.1.1 Video Conferencing Hardware
- 5.1.2 Display and Presentation Hardware
- 5.1.3 Audio Conferencing Hardware
- 5.1.4 Control and Automation Systems
- 5.1.5 Other Hardware Type
- 5.2 By Room Size
- 5.2.1 Huddle Rooms/Small Meeting Rooms
- 5.2.2 Medium Rooms
- 5.2.3 Large Rooms
- 5.2.4 Other Room Sizes
- 5.3 By End-user Industry
- 5.3.1 Commercial Spaces
- 5.3.2 Education Institutions
- 5.3.3 Government and Public Sector
- 5.3.4 Healthcare Facilities
- 5.3.5 Other End-user Industries
- 5.4 By Connectivity
- 5.4.1 Wired
- 5.4.2 Wireless
- 5.4.3 Hybrid
- 5.5 By Geography
- 5.5.1 North America
- 5.5.1.1 United States
- 5.5.1.2 Canada
- 5.5.1.3 Mexico
- 5.5.2 South America
- 5.5.2.1 Brazil
- 5.5.2.2 Argentina
- 5.5.2.3 Rest of South America
- 5.5.3 Europe
- 5.5.3.1 Germany
- 5.5.3.2 United Kingdom
- 5.5.3.3 France
- 5.5.3.4 Italy
- 5.5.3.5 Spain
- 5.5.3.6 Russia
- 5.5.3.7 Rest of Europe
- 5.5.4 Asia-Pacific
- 5.5.4.1 China
- 5.5.4.2 Japan
- 5.5.4.3 South Korea
- 5.5.4.4 India
- 5.5.4.5 Australia and New Zealand
- 5.5.4.6 Rest of Asia-Pacific
- 5.5.5 Middle East
- 5.5.5.1 Saudi Arabia
- 5.5.5.2 United Arab Emirates
- 5.5.5.3 Turkey
- 5.5.5.4 Rest of Middle East
- 5.5.6 Africa
- 5.5.6.1 South Africa
- 5.5.6.2 Egypt
- 5.5.6.3 Rest of Africa
- 5.5.1 North America
6 COMPETITIVE LANDSCAPE
- 6.1 Market Concentration
- 6.2 Strategic Moves
- 6.3 Market Share Analysis
- 6.4 Company Profiles (includes Global Level Overview, Market Level Overview, Core Segments, Financials as available, Strategic Information, Market Rank/Share, Products and Services, Recent Developments)
- 6.4.1 Logitech International S.A.
- 6.4.2 Cisco Systems, Inc.
- 6.4.3 Sony Group Corporation
- 6.4.4 Crestron Electronics, Inc.
- 6.4.5 Barco NV
- 6.4.6 DTEN Inc.
- 6.4.7 Panasonic Holdings Corporation
- 6.4.8 Shure Incorporated
- 6.4.9 Sennheiser electronic GmbH & Co. KG
- 6.4.10 Yamaha Corporation
- 6.4.11 Biamp Systems, LLC
- 6.4.12 ClearOne, Inc.
- 6.4.13 Aver Information Inc.
- 6.4.14 GN Audio A/S (Jabra)
- 6.4.15 Huddly AS
- 6.4.16 Yealink Network Technology Co., Ltd.
- 6.4.17 Huawei Technologies Co., Ltd.
- 6.4.18 ZTE Corporation
- 6.4.19 Lifesize, Inc.
- 6.4.20 Owl Labs, Inc.
7 MARKET OPPORTUNITIES AND FUTURE OUTLOOK
- 7.1 White-Space and Unmet-Need Assessment


