

|
시장보고서
상품코드
2073090
스코프 3 공급망 배출량 투명성 플랫폼 시장 : 점유율 분석, 업계 동향과 통계, 성장 예측(2026-2031년)Scope 3 Supply Chain Emissions Transparency Platform - Market Share Analysis, Industry Trends & Statistics, Growth Forecasts (2026 - 2031) |
||||||
 Mordor Intelligence
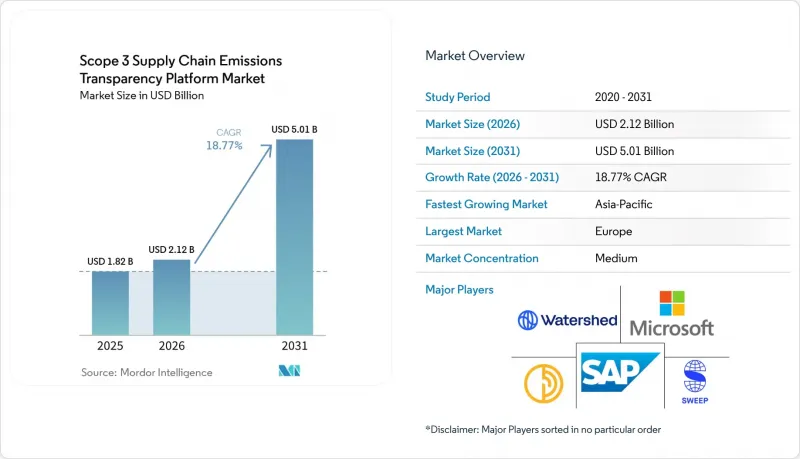
Mordor Intelligence에 의하면, 스코프 3 공급망 배출량 투명성 플랫폼 시장 규모는 2025년에 18억 2,000만 달러로 평가되었고 2026년 21억 2,000만 달러에서 2031년까지 50억 1,000만 달러에 이를 것으로 예측되며, 예측 기간(2026-2031년) CAGR은 18.77%를 나타낼 전망입니다.
본 보고서는 구성 요소(소프트웨어 및 서비스), 도입 형태(클라우드, On-Premise, 하이브리드), 기업 규모(대기업, 기타), 용도(공급업체의 배출량 데이터 수집, 기타), 최종 이용 산업(IT 및 통신, 에너지 및 유틸리티, 은행, 금융서비스 및 보험(BFSI), 제조업, 기타), 지역별로 분류되어 있습니다. 시장 전망은 금액(달러) 기준으로 제시되어 있습니다.
전 세계 Scope 3 공급망 배출량 투명성 플랫폼 시장 동향 및 인사이트
확대되는 규제상 공시 의무
현재, 공시 의무 규제는 스코프 3 공급망 배출량 투명성 플랫폼 시장에 있어 직접적인 구매 동인이 되고 있습니다. 이는 대기업들이 밸류체인 데이터를 반복 가능한 방식으로 수집, 구조화, 문서화할 수 있는 시스템이 필요하기 때문입니다. “기업 지속가능성 보고 지침(CSRD)”는 대기업의 기후 변화 정보 공개에서 스코프 3 보고를 핵심으로 삼고 있으며, “옴니버스 I”의 개정 이후에도, 정의된 보고 체계 내에서 가치사슬 정보를 수집해야 할 필요성은 여전히 남아 있습니다. 이 점은 중요합니다. 왜냐하면 보고와 관련된 과제는 더 이상 연 1회의 배출량 산정에 그치지 않고, 보증 요건이나 내부 심사를 견딜 수 있는 증거 기록을 유지하는 것까지 포함하고 있기 때문입니다. 유럽 집행위원회는 또한 밸류체인의 상한선이 어떻게 적용되어야 하는지를 명확히 하고, 보고 의무가 있는 기업에 부과된 새로운 법적 한계를 넘지 않으면서도 적절한 공급업체 데이터를 수집할 수 있는 플랫폼의 필요성을 강조했습니다. 그 결과, 스코프 3 공급망 배출량 투명성 플랫폼 시장은 강력한 공급업체 워크플로우, 추적 가능한 산정 및 문서 관리 기능을 갖춘 시스템에 유리한 컴플라이언스 사이클의 혜택을 누리고 있습니다.
지출 기반 추정에서 공급업체별 데이터로의 전환
스코프 3 공급망 배출량 투명성 플랫폼 시장도 발전하고 있습니다. 이는 기업들이 가능한 한 광범위한 지출 기반 대체 지표를 공급업체별 정보로 대체하도록 압력을 받고 있기 때문입니다. MIT 슬론 경영대학원과 CSCMP의 조사에 따르면, 많은 조직에서 공급업체 데이터의 접근성이 스코프 3의 정확한 측정을 가로막는 가장 큰 장애물로 밝혀졌습니다. 이것이 바로 구매자들이 공급업체와의 협업 및 데이터 교환을 용이하게 해주는 플랫폼을 원하는 이유를 설명해 줍니다. 이러한 변화로 인해 제품의 요구 사항도 변화하고 있습니다. 기업들은 더 이상 단순한 계산 파일이 아니라, 공급업체용 포털, 제품의 탄소 발자국 관리 워크플로우, 구조화된 템플릿을 필요로 하게 되었기 때문입니다. WBCSD PACT 조사 방법론 v3.0은 거래 파트너들에게 시스템 간 제품 탄소 발자국 데이터를 교환할 수 있는 공통 기반을 제공함으로써 이러한 움직임을 지원하고 있으며, 이를 통해 대규모 자동 데이터 전송을 보다 실용적으로 만들고 있습니다. 구매자가 일반적인 조달 및 보고 주기 내에서 1차 데이터 제공을 요구하기 시작하면, 표준 형식으로 대응할 수 있는 공급업체는 관리하기 쉬워지고, 제품 카테고리를 넘나드는 비교도 용이해집니다. 따라서 스코프 3 공급망 배출량 투명성 플랫폼 시장은 단순한 탄소 회계에 그치지 않고, 공급업체의 참여와 제품 수준의 데이터 정비 현황까지 포함하는 형태로 확대되고 있습니다.
다단계 공급망에서 데이터 품질과 추적성의 저하
다층 공급망 전반에 걸친 데이터 품질의 저하는 여전히 스코프 3 공급망 배출량 투명성 플랫폼 시장에서 가장 큰 운영상의 제약 요인으로 남아 있습니다. 이는 기업들이 여전히 직접적인 공급업체 관계를 넘어서는 데 어려움을 겪고 있기 때문입니다. SBTi는 공급망 공개 프로그램에서 공급업체의 응답률이 적극적인 참여가 없으면 종종 제한적인 수준에 머물게 되며, 보고 기업이 공급망의 더 깊은 단계로 나아갈수록 1차 데이터의 입수 가능성이 낮아진다고 지적하고 있습니다. 2026년에 발표된 다계층 스코프 3 산정에 관한 학술 논문에서도, GHG 프로토콜이 개념적인 지침을 제공하고는 있으나, 복잡한 업스트림 관계를 추적하기 위한 알고리즘을 규정하고 있지 않아 공급업체가 독자적인 방법을 개발할 수밖에 없는 상황이라고 지적되고 있습니다. 이로 인해 두 플랫폼이 공급업체의 격차, 공유된 투입 요소, 순환적 의존 관계를 서로 다른 방식으로 처리할 가능성이 있어, 비교 가능성이 저하됩니다. 비즈니스적 측면에서 구매자는 보고의 일관성을 해치지 않으면서 1차 데이터, 부분적인 추정치, 대체 기법을 조합하여 활용할 수 있는 시스템을 원하고 있습니다. 수요가 견조하더라도 공급업체의 참여와 추적성이 개선되지 않는 한, 스코프 3 공급망 배출량 투명성 플랫폼 시장은 그 수요를 실질적인 도입으로 완전히 연결할 수 없습니다.
부문별 분석
2025년, Scope 3 공급망 배출량 투명성 플랫폼 시장에서 소프트웨어 플랫폼이 68.74%를 차지했으며, 구매자들이 여전히 관련 지원 서비스보다 핵심 시스템을 우선시하고 있는 것으로 확인되었습니다. 그 이유는 간단명료합니다. 기업들은 배출량 산정, 공급업체와의 소통, 보고 논리, 감사 증거를 연계하여 처리할 수 있는 단일 플랫폼이 필요하기 때문입니다. 유럽의 보고 요건에 따라 이 통합 모델의 중요성은 더욱 커지고 있습니다. 기업은 일회성 수작업이 아니라 반복 가능한 워크플로우를 필요로 하기 때문입니다. SAP와 IBM의 제품 전략도 이러한 추세를 뒷받침하고 있습니다. 두 회사 모두 탄소 관련 워크플로우를 업무 시스템이나 재무 시스템에 직접 연동하는 기능을 확충하고 있기 때문입니다. 따라서 서비스 수요가 견조한 추세를 보이고 있는 경우에도, 소프트웨어는 스코프 3 공급망 배출량 투명성 플랫폼 시장의 핵심을 이루고 있습니다.
서비스가 여전히 중요한 이유는 플랫폼이 실제 공시 주기에서 제대로 작동하게 되기까지는 대부분의 도입 사례에서 설정, 공급업체 온보딩, 데이터 확인, 보고 지원이 필요하기 때문입니다. 이 시장 부문은 프로젝트가 독립적인 지속가능성 팀 내에서만 머무르는 것이 아니라, 조달 및 재무 프로세스에 점점 더 통합됨에 따라 성장하고 있습니다. 또한, 기업이 공급업체별 데이터 교환을 WBCSD PACT 방식이나 제품의 탄소 발자국 요건에 부합하도록 조정하려 할 때에도 서비스에 대한 수요가 증가합니다. 실제로 서비스에 대한 수요는 소프트웨어 기능의 심도 수준에 따라 달라지는 경향이 있습니다. 왜냐하면, 플랫폼의 기능이 높을수록 사내 시스템이나 공급업체 네트워크 전반에 걸쳐 더 많은 설정이 필요하기 때문입니다. 즉, 스코프 3 공급망 배출량 투명성 플랫폼 산업은 소프트웨어 및 서비스라는 별개의 부문으로 나뉘는 것이 아니라, 서비스 계층이 소프트웨어의 대규모 상용화를 지원하는 번들형 제공 모델로 전환되고 있는 것입니다.
2025년에는 매출의 65.12%를 클라우드가 차지했습니다. 이는 공급업체 데이터 수집이 많은 경우 여러 시설, 파트너, 지역에 걸쳐 동시에 이루어진다는 점을 반영한 것입니다. 공급업체 포털, 워크플로우 승인, 기업 간 데이터 교환은 공유 인터페이스를 통해 접근할 수 있을 때 더 원활하게 작동하므로, 클라우드 모델은 Scope 3 공급망 배출량 투명성 플랫폼 시장에 적합합니다. WBCSD PACT의 기술 개발은 이 점을 뒷받침하고 있습니다. 표준화된 제품의 탄소 발자국 교환은 독립된 로컬 파일이 아니라, 시스템 간 전송을 지원하도록 설계되었기 때문입니다. 기업들이 카테고리나 지역을 넘나들며 제품 단위의 배출량 데이터를 요구함에 따라, 이러한 상호운용성은 점점 더 중요해지고 있습니다. 또한, 클라우드 모델은 공시 규정이나 고객의 요구 사항이 변경되었을 때 템플릿을 신속하게 수정할 수 있게 해줍니다.
하이브리드형은 2031년까지 연평균 성장률(CAGR) 18.92%를 기록하며 성장할 것으로 전망됩니다. 이는 많은 대기업들이 공급업체와의 연계에는 외부 인터페이스를 활용하면서도, 핵심 ERP 환경이나 기밀 데이터의 관리는 여전히 사내 시스템 내에서 유지하고 있기 때문입니다. SAP의 최신 동향은 이 설계가 왜 매력적인지를 보여주고 있습니다. 탄소 배출량 계산을 거래 기록 근처에 배치하면서도, 보다 광범위한 팩터 라이브러리와 연동된 워크플로를 활용할 수 있기 때문입니다. 따라서 하이브리드형은 스코프 3 공급망 배출량 투명성 플랫폼 시장에서 기업들이 공통적으로 우려하는 사항, 즉 “데이터 거버넌스를 약화시키지 않으면서 공급업체와의 협력을 어떻게 실현할 것인가”라는 과제를 해결하고 있습니다. On-Premise형 시스템은 기밀성이 높은 환경에서는 여전히 일정한 역할을 수행하고 있지만, 대규모 공급업체의 참여나 빈번한 데이터 교환에는 그다지 적합하지 않습니다. 따라서 시장은 클라우드를 외면하는 것이 아니라, 보다 유연한 도입 방식의 조합으로 확대되고 있습니다.
지역별 분석
2025년, 유럽은 스코프 3 공급망 배출량 투명성 플랫폼 시장에서 주도적인 위치를 차지했습니다. 이는 해당 지역이 공식적인 공시 요건과 긴밀한 국경 간 공급업체 관계를 모두 갖추고 있기 때문입니다. “기업 지속가능성 보고 지침(CSRD)”에 따라 대기업용 보고 체계에서 스코프 3 공시가 유지되고 있으며, 이로 인해 일시적인 규정 준수 대응 붐이 아닌 지속적인 소프트웨어 수요가 뒷받침되고 있습니다. 밸류체인의 상한선에 대한 명확한 규정 또한 중요합니다. 이는 기업이 공급업체에 데이터를 요청하는 방식을 형성하고, 나아가 플랫폼의 워크플로우 설계에 영향을 미치기 때문입니다. 또한, 유럽이 중요한 이유는 제품의 탄소 발자국 거래와 디지털 제품 데이터가 기업의 보고 요구 사항과 병행하여 발전하고 있다는 점에도 있습니다. 이러한 조합 덕분에 해당 지역은 규정 준수 수요와 시장 맞춤형 제품 기능 개발이라는 두 가지 측면에서 계속해서 중심적인 위치를 차지하고 있습니다.
아시아태평양은 2031년까지 스코프 3 공급망 배출량 투명성 플랫폼 시장에서 가장 빠르게 성장할 지역이 될 것으로 전망됩니다. 이는 전 세계 바이어들과 거래를 하기 위해 제품 및 공급업체의 배출량 데이터에 대한 수요가 점점 더 높아지고 있는 수출 주도형 공급망에 의해 뒷받침되고 있습니다. 현지 규제가 다르더라도, 이 지역의 제조업체들은 다국적 기업인 고객들이 기대하는 보고 및 제품 데이터 요구 사항의 영향을 계속해서 받고 있습니다. 국경 간 협력은 데이터 교환을 위한 실용적인 기반을 마련했으며, 이는 공급업체가 집중된 제조 회랑에서 중요한 의미를 갖습니다. 수백 개에 달하는 소비재 카테고리로의 확대 역시 아시아태평양이 중요한 이유를 반영하고 있습니다. 왜냐하면 이 지역의 많은 공급업체들이 제품 차원의 광범위한 배출량 파악을 필요로 하는 브랜드에 서비스를 제공하고 있기 때문입니다. 공급업체 네트워크 접근 방식은 대규모 구매자가 산업 및 지역을 아우르는 분산된 공급업체들로부터 표준화된 정보를 손쉽게 수집할 수 있도록 함으로써 이러한 추세를 가속화하고 있습니다. 따라서 이 지역의 성장 배경에는 현지 보고 규제와 마찬가지로 공급망 내에서의 위치도 크게 기여하고 있습니다.
북미는 여전히 가장 큰 수요 거점 중 하나로 남아 있습니다. 이는 해당 지역의 다국적 기업들이 국내 지속가능성 프로그램과 국제적인 보고 의무 모두를 충족할 수 있는 시스템을 필요로 하는 경우가 많기 때문입니다. 엔터프라이즈 솔루션은 탄소 워크플로우를 재무 및 조달 데이터와 연동하는 제품을 통해 이러한 수요에 대응하고 있으며, 이는 북미의 주요 구매업체들의 요구에 부합합니다. 남미, 중동 및 아프리카는 스코프 3 공급망 배출량 투명성 플랫폼 시장에서 아직 발전 단계에 있는 지역이지만, 수출업체, 산업 그룹, 공급업체 네트워크가 다국적 기업의 데이터 제공 요청 대상이 되고 있다는 점에서 여전히 중요한 시장입니다. 모든 지역에서 플랫폼 도입은 현지 브랜드의 영향력보다, 플랫폼이 공급업체 데이터를 수집하고 업무 기록을 통합하며, 대기업 바이어를 만족시킬 수 있을 만큼 일관성 있게 제품 수준의 추적성을 지원할 수 있는지에 달려 있습니다.
기타 혜택
- 엑셀 형식 시장 예측(ME) 시트
- 3개월간의 애널리스트 지원
자주 묻는 질문
목차
제1장 서론
제2장 조사 방법
제3장 주요 요약
제4장 시장 구도
제5장 시장 규모와 성장 예측
제6장 경쟁 구도
제7장 시장 기회와 향후 전망
JHS 26.07.07According to Mordor Intelligence, the scope 3 supply chain emissions transparency platform market size was valued at USD 1.82 billion in 2025 and estimated to grow from USD 2.12 billion in 2026 to reach USD 5.01 billion by 2031, at a CAGR of 18.77% during the forecast period (2026-2031).
This report is Segmented by Component (Software, and Services), Deployment (Cloud, On-Premise, and Hybrid), Enterprise Size (Large Enterprises, and More), Application (Supplier Carbon Emissions Tracking, and More), End-Use Industry (IT and Telecom, Energy and Utilities, BFSI, Manufacturing, and More), and Geography. The Market Forecasts are Provided in Terms of Value (USD).
Global Scope 3 Supply Chain Emissions Transparency Platform Market Trends and Insights
Expanding Regulatory Disclosure Mandates
Mandatory disclosure rules are now a direct buying trigger for the scope 3 supply chain emissions transparency platform market because large companies need systems that can gather, structure, and document value chain data in a repeatable way. The Corporate Sustainability Reporting Directive keeps Scope 3 reporting at the center of climate disclosure for large companies, and the Omnibus I changes still preserve the need to collect value chain information within a defined reporting framework. This matters because the reporting challenge is no longer limited to calculating emissions once a year; it now involves maintaining evidence trails that can withstand assurance requirements and internal review. The European Commission also clarified how the value chain cap should be applied, underscoring the need for platforms that can collect the right supplier data without crossing the new legal boundaries imposed on reporting companies. As a result, the scope 3 supply chain emissions transparency platform market is benefiting from a compliance cycle that favors systems with strong supplier workflows, traceable calculations, and documentation controls.
Shift From Spend-Based Estimates to Supplier-Specific Data
The scope 3 supply chain emissions transparency platform market is also advancing, as companies are under pressure to replace broad, spend-based proxies with supplier-specific information wherever possible. MIT Sloan and CSCMP found that supplier data availability was the single largest obstacle to accurate Scope 3 measurement for many organizations, which explains why buyers are looking for platforms that make supplier outreach and data exchange easier. This shift changes the product requirement because enterprises now need supplier portals, product carbon footprint workflows, and structured templates rather than standalone calculation files. WBCSD PACT Methodology v3.0 supports this move by providing trading partners with a common basis for exchanging product carbon footprint data across systems, thereby making automated data transfer at scale more practical. Once buyers start requesting primary data within normal sourcing and reporting cycles, suppliers that can respond in a standard format are easier to retain and compare across product categories. That is why the scope 3 supply chain emissions transparency platform market is expanding beyond carbon accounting alone to include supplier participation and product-level data readiness.
Poor Multi-Tier Data Quality and Traceability
Poor data quality across multi-tier supply chains remains the largest operational restraint on the scope 3 supply chain emissions transparency platform market because companies still struggle to move beyond direct supplier relationships. SBTi noted that supplier response rates in supply chain disclosure programs often remain limited without active engagement, leading to a decline in the availability of primary data as reporting companies move deeper into the supply chain. A 2026 academic paper on multi-tier Scope 3 accounting also noted that the GHG Protocol provides conceptual guidance but does not prescribe algorithms for tracing complex upstream relationships, leaving vendors to develop their own methods. That weakens comparability because two platforms may handle supplier gaps, shared inputs, and circular dependencies differently. The commercial effect is that buyers want systems that can mix primary data, partial estimates, and fallback methods without breaking reporting consistency. Even when demand stays strong, the scope 3 supply chain emissions transparency platform market cannot fully convert that demand into usable deployments unless supplier participation and traceability improve.
Other drivers and restraints analyzed in the detailed report include:
- AI-Enabled Factor Matching and Anomaly Detection
- Procurement Integration Into ERP And P2P Workflows
- High Change Management and Implementation Cost
For complete list of drivers and restraints, kindly check the Table Of Contents.
Segment Analysis
Software platforms accounted for 68.74% of the scope 3 supply chain emissions transparency platform market in 2025, confirming that buyers still prioritize core systems over adjacent support services. The reason is straightforward: enterprises need a single platform to handle emissions calculation, supplier communication, reporting logic, and audit evidence in a connected way. European reporting requirements have made that integrated model even more important, as companies need repeatable workflows rather than one-time manual exercises. SAP and IBM product direction also support this pattern because both companies are expanding features that tie carbon workflows directly to operational and financial systems. That makes software the anchor layer of the scope 3 supply chain emissions transparency platform market, even when service demand remains healthy.
Services still matter because most deployments need configuration, supplier onboarding, data checks, and reporting support before a platform can work well in live disclosure cycles. This part of the market grows as projects become more embedded in procurement and finance processes rather than staying inside stand-alone sustainability teams. The need for services also rises when companies try to align supplier-specific data exchange with WBCSD PACT methods and product carbon footprint requirements. In practice, service demand tends to follow software depth, as more capable platforms often require more setup across internal systems and supplier networks. This means the scope 3 supply chain emissions transparency platform industry is not splitting into separate software and service lanes; it is moving toward bundled delivery models where the service layer helps software become usable at scale.
Cloud accounted for 65.12% of revenue in 2025, reflecting that supplier data collection often spans multiple facilities, partners, and geographies simultaneously. The cloud model fits the scope 3 supply chain emissions transparency platform market because supplier portals, workflow approvals, and cross-company data exchange work better when they are accessible through shared interfaces. WBCSD PACT technical development reinforces this point because standardized product carbon footprint exchange is designed to support system-to-system transfers rather than isolated local files. That interoperability matters more as enterprises request product-level emissions data across categories and geographies. The cloud model also supports faster template changes when disclosure rules or customer requests evolve.
Hybrid is projected to grow at a 18.92% CAGR through 2031 because many large companies still keep core ERP environments and sensitive data controls inside internal systems while using external interfaces for supplier engagement. SAP's updates show why this design is attractive, since carbon calculations can sit close to transaction records while still drawing on wider factor libraries and connected workflows. Hybrid, therefore, addresses a common enterprise concern in the scope 3 supply chain emissions transparency platform market: how to enable supplier collaboration without weakening data governance. On-premises systems still hold a place in sensitive environments, but they are less aligned with large-scale supplier participation and frequent data exchange. For that reason, the market is not moving away from cloud; it is expanding toward more flexible deployment combinations.
Complete Report Scope:
- By Component
- Software Platforms
- Services
- By Deployment Mode
- Cloud
- On-Premises
- Hybrid
- By Enterprise Size
- Large Enterprises
- Small And Medium Enterprises
- By Transparency Function
- Supplier Emissions Data Collection
- Data Validation and Verification
- Product Carbon Footprint Transparency
- Supply Chain Traceability
- Reporting and Disclosure
- Supplier Collaboration
- By End-Use Industry
- Manufacturing
- Retail and E-Commerce
- Transportation and Logistics
- Energy and Utilities
- IT and Telecom
- BFSI
- Construction and Infrastructure
- Government and Public Sector
- Other End-User Industries
- By Geography
- North America
- Canada
- Mexico
- South America
- Brazil
- Argentina
- Rest of South America
- Europe
- Germany
- United Kingdom
- France
- Italy
- Spain
- Netherlands
- Russia
- Rest of Europe
- Asia-Pacific
- China
- Japan
- India
- South Korea
- Australia and New Zealand
- Indonesia
- Rest of Asia-Pacific
- Middle East and Africa
- Middle East
- Saudi Arabia
- United Arab Emirates
- Rest of Middle East
- Africa
- South Africa
- Nigeria
- Rest of Africa
- Rest of Africa
- Middle East
- North America
Geography Analysis
Europe held the leading position in the scope 3 supply chain emissions transparency platform market in 2025 because the region combines formal disclosure requirements with dense cross-border supplier relationships. The Corporate Sustainability Reporting Directive has kept Scope 3 disclosures in the reporting framework for large companies, which supports sustained software demand rather than a one-off compliance rush. Clarification on the value chain cap also matters because it shapes how companies request data from suppliers, thereby affecting platform workflow design. Europe is also important because product carbon footprint exchange and digital product data are advancing in parallel with corporate reporting needs. That combination keeps the region at the center of both compliance demand and product feature development for the market.
Asia-Pacific is projected to be the fastest-growing region in the scope 3 supply chain emissions transparency platform market through 2031, supported by export-led supply chains that increasingly need product and supplier emissions data to work with global buyers. Even where local rules vary, manufacturers in the region are still affected by the reporting expectations and product data requests coming from multinational customers. Cross-border relationships gain a practical basis for data exchange, which is important in supplier-heavy manufacturing corridors. Expansion across hundreds of consumer goods categories also reflects why Asia-Pacific matters, because many regional suppliers serve brands that need broad product-level emissions coverage. Supplier network approaches add to this dynamic by making it easier for large buyers to collect standardized information from distributed suppliers across sectors and locations. The regional growth story, therefore, comes from supply chain position as much as from local reporting rules.
North America remains one of the largest demand centers because multinational companies in the region often need systems that can serve both domestic sustainability programs and international reporting obligations. Enterprise solutions support this demand with products that connect carbon workflows to finance and procurement data, which matches the needs of large North American buyers. South America, the Middle East, and Africa are earlier-stage regions in the scope 3 supply chain emissions transparency platform market, but they remain relevant where exporters, industrial groups, and supplier networks are being pulled into multinational data requests. Across all regions, adoption still depends less on local branding and more on whether platforms can collect supplier data, integrate operational records, and support product-level traceability with enough consistency to satisfy large enterprise buyers.
- Persefoni AI Inc.
- Watershed Technology, Inc.
- Sweep SAS
- Normative AB
- Emitwise Limited
- CarbonChain Ltd
- Greenly SAS
- SINAI Technologies, Inc.
- Climatiq GmbH
- Plan A Software GmbH
- Carbon Analytics Limited
- Dcycle Sustainability Solutions, S.L.
- Novata, Inc.
- EcoVadis SAS
- Sphera Solutions, Inc.
- IBM Corporation
- SAP SE
- Microsoft Corporation
- Salesforce, Inc.
- Diligent Corporation
Additional Benefits:
- The market estimate (ME) sheet in Excel format
- 3 months of analyst support
TABLE OF CONTENTS
1 INTRODUCTION
- 1.1 Study Assumptions and Market Definition
- 1.2 Scope of the Study
2 RESEARCH METHODOLOGY
3 EXECUTIVE SUMMARY
4 MARKET LANDSCAPE
- 4.1 Market Overview
- 4.2 Market Drivers
- 4.2.1 Expanding Regulatory Disclosure Mandates
- 4.2.2 Shift From Spend-Based Estimates To Supplier-Specific Data
- 4.2.3 Procurement Integration Into ERP And P2P Workflows
- 4.2.4 AI Enabled Factor Matching And Anomaly Detection
- 4.2.5 Supplier Engagement And Capacity Building Workflows
- 4.2.6 Product And SKU Level Carbon Traceability Demand
- 4.3 Market Restraints
- 4.3.1 Poor Multi-Tier Data Quality And Traceability
- 4.3.2 High Change Management And Implementation Cost
- 4.3.3 Supplier Privacy, NDAs, And Antitrust Friction
- 4.3.4 Methodology Fragmentation Across Frameworks
- 4.4 Impact of Macroeconomic Factors on the Market
- 4.5 Industry Value-Chain Analysis
- 4.6 Regulatory Landscape
- 4.7 Technological Outlook
- 4.8 Porter's Five Forces Analysis
- 4.8.1 Bargaining Power of Buyers
- 4.8.2 Bargaining Power of Suppliers
- 4.8.3 Threat of New Entrants
- 4.8.4 Threat of Substitutes
- 4.8.5 Competitive Rivalry
5 MARKET SIZE AND GROWTH FORECASTS (VALUE)
- 5.1 By Component
- 5.1.1 Software Platforms
- 5.1.2 Services
- 5.2 By Deployment Mode
- 5.2.1 Cloud
- 5.2.2 On-Premises
- 5.2.3 Hybrid
- 5.3 By Enterprise Size
- 5.3.1 Large Enterprises
- 5.3.2 Small And Medium Enterprises
- 5.4 By Transparency Function
- 5.4.1 Supplier Emissions Data Collection
- 5.4.2 Data Validation and Verification
- 5.4.3 Product Carbon Footprint Transparency
- 5.4.4 Supply Chain Traceability
- 5.4.5 Reporting and Disclosure
- 5.4.6 Supplier Collaboration
- 5.5 By End-Use Industry
- 5.5.1 Manufacturing
- 5.5.2 Retail and E-Commerce
- 5.5.3 Transportation and Logistics
- 5.5.4 Energy and Utilities
- 5.5.5 IT and Telecom
- 5.5.6 BFSI
- 5.5.7 Construction and Infrastructure
- 5.5.8 Government and Public Sector
- 5.5.9 Other End-User Industries
- 5.6 By Geography
- 5.6.1 North America
- 5.6.1.1 Canada
- 5.6.1.2 Mexico
- 5.6.2 South America
- 5.6.2.1 Brazil
- 5.6.2.2 Argentina
- 5.6.2.3 Rest of South America
- 5.6.3 Europe
- 5.6.3.1 Germany
- 5.6.3.2 United Kingdom
- 5.6.3.3 France
- 5.6.3.4 Italy
- 5.6.3.5 Spain
- 5.6.3.6 Netherlands
- 5.6.3.7 Russia
- 5.6.3.8 Rest of Europe
- 5.6.4 Asia-Pacific
- 5.6.4.1 China
- 5.6.4.2 Japan
- 5.6.4.3 India
- 5.6.4.4 South Korea
- 5.6.4.5 Australia and New Zealand
- 5.6.4.6 Indonesia
- 5.6.4.7 Rest of Asia-Pacific
- 5.6.5 Middle East and Africa
- 5.6.5.1 Middle East
- 5.6.5.1.1 Saudi Arabia
- 5.6.5.1.2 United Arab Emirates
- 5.6.5.1.3 Rest of Middle East
- 5.6.5.2 Africa
- 5.6.5.2.1 South Africa
- 5.6.5.2.2 Nigeria
- 5.6.5.2.3 Rest of Africa
- 5.6.5.3 Rest of Africa
- 5.6.5.1 Middle East
- 5.6.1 North America
6 COMPETITIVE LANDSCAPE
- 6.1 Market Concentration
- 6.2 Strategic Moves
- 6.3 Market Share Analysis
- 6.4 Company Profiles (includes Global Level Overview, Market Level Overview, Core Segments, Financials as available, Strategic Information, Market Rank/Share, Products and Services, Recent Developments)
- 6.4.1 Persefoni AI Inc.
- 6.4.2 Watershed Technology, Inc.
- 6.4.3 Sweep SAS
- 6.4.4 Normative AB
- 6.4.5 Emitwise Limited
- 6.4.6 CarbonChain Ltd
- 6.4.7 Greenly SAS
- 6.4.8 SINAI Technologies, Inc.
- 6.4.9 Climatiq GmbH
- 6.4.10 Plan A Software GmbH
- 6.4.11 Carbon Analytics Limited
- 6.4.12 Dcycle Sustainability Solutions, S.L.
- 6.4.13 Novata, Inc.
- 6.4.14 EcoVadis SAS
- 6.4.15 Sphera Solutions, Inc.
- 6.4.16 IBM Corporation
- 6.4.17 SAP SE
- 6.4.18 Microsoft Corporation
- 6.4.19 Salesforce, Inc.
- 6.4.20 Diligent Corporation
7 MARKET OPPORTUNITIES AND FUTURE OUTLOOK
- 7.1 White-Space and Unmet Need Assessment


