|
시장보고서
상품코드
2073092
탄소 인식 애플리케이션 프로그래밍 인터페이스(API) 및 소프트웨어 개발 키트(SDK) 플랫폼 시장 : 점유율 분석, 업계 동향과 통계, 성장 예측(2026-2031년)Carbon-Aware Application Programming Interface (API) and Software Development Kit (SDK) Platform - Market Share Analysis, Industry Trends & Statistics, Growth Forecasts (2026 - 2031) |
||||||
 Mordor Intelligence
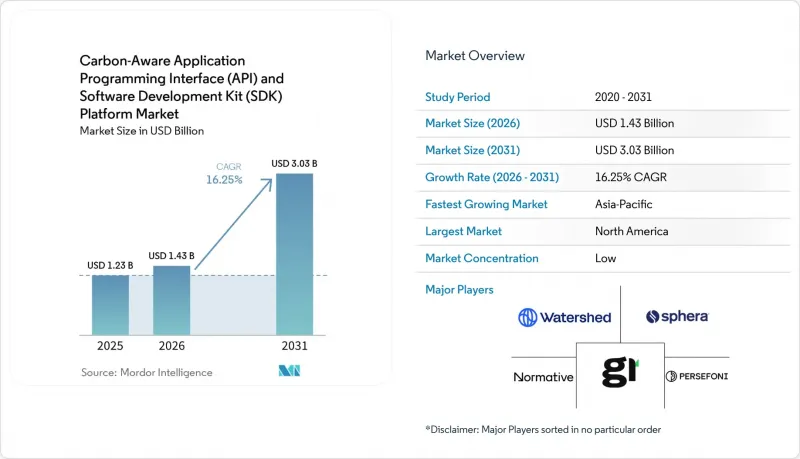
Mordor Intelligence에 의하면, 탄소 인식 애플리케이션 프로그래밍 인터페이스(API) 및 소프트웨어 개발 키트(SDK) 플랫폼 시장 규모는 2025년에 12억 3,000만 달러, 2026년에는 14억 3,000만 달러되어, 2031년까지 30억 3,000만 달러에 이른다고 전망되고 있어 2026-2031년까지 CAGR 16.25%를 나타낼 것으로 예측됩니다.
본 보고서는 구성 요소(플랫폼, 서비스), 용도(탄소 인식 쿠버네티스 스케줄링, 기타), 도입 형태(클라우드 기반, 기타), 조직 규모(대기업, 기타), 최종 사용자(소매 및 전자상거래, 기타), 지역별로 분류되어 있습니다. 시장 전망은 금액(달러) 기준으로 제시되어 있습니다.
전 세계 탄소 인식 애플리케이션 프로그래밍 인터페이스(API) 및 소프트웨어 개발 키트(SDK) 플랫폼 시장 동향과 인사이트
감사 대응이 가능한 탄소 공시 요건 증가
카본 어웨어 애플리케이션 프로그래밍 인터페이스(API) 및 소프트웨어 개발 키트(SDK) 플랫폼 시장에서 가장 강력한 상업적 견인력으로 작용하고 있는 것은 소프트웨어 배출량 데이터에 대한 추적 가능성을 더욱 강화하도록 의무화한 공시 프레임워크입니다. 2026년에는 유럽 전역의 많은 기관이 첫 번째 CSRD 보고서를 제출하게 될 예정이며, 이로 인해 보증 요건을 충족하고 체계적이며 기계 판독이 가능한 배출량 정보에 대한 요구가 높아지고 있습니다. “소프트웨어 탄소 강도” 기법은 소프트웨어 활동을 일관된 보고 구조에 매핑하는 것으로, 이를 통해 구매자는 공급업체나 사내 엔지니어링 팀에 대해 비교 가능한 탄소 데이터를 보다 명확하게 요구할 수 있게 됩니다. 이러한 변화가 중요한 이유는 조달 팀이 광범위한 연간 평균값이 아니라 용도 수준의 근거를 요구할 때, 수작업으로 산출한 추정치는 별 도움이 되지 않기 때문입니다. 따라서, Carbon Aware API 및 SDK 플랫폼 시장은 특히 유럽에서 소프트웨어를 판매하는 기업들을 중심으로, 기업의 핵심 보고 인프라에 점점 더 가까워지고 있습니다. 캘리포니아주의 SB 253 법안과 같은 주 차원의 의무화 조치로 인해 연방 정책과는 별개로 병행되는 보고 절차가 추가되었으며, 이로 인해 해당 플랫폼들이 준수해야 할 규정 적용 범위가 더욱 확대되고 있습니다.
AI 및 고성능 컴퓨팅(HPC) 워크로드의 탄소 배출량 가시화
탄소 인식 애플리케이션 프로그래밍 인터페이스(API) 및 소프트웨어 개발 키트(SDK) 플랫폼 시장은 AI 인프라의 급속한 확장과, 운영 시 발생하는 탄소 발자국을 보다 정밀하게 측정해야 할 필요성에 힘입어 성장하고 있습니다. 전 세계 데이터센터의 전력 소비량은 2025년에 448TWh에 달할 것으로 보이며, 현재 예측에 따르면 2030년까지 945TWh에 이를 것으로 전망되고 있어, 이에 따라 인프라 로드맵에서 탄소 가시화가 계속해서 중요한 위치를 차지하고 있습니다. 또한, AI의 총 에너지 소비량 중 80-90%를 추론이 차지하기 때문에 에너지 수요의 구성도 변화하고 있으며, 측정상의 과제는 더 이상 모델 훈련 실험실뿐만 아니라 실제 운영 환경까지 미치고 있습니다. 그린 소프트웨어 재단은 2025년 하반기에 AI용 SCI를 승인하고, 개발자들에게 GPU를 많이 사용하는 워크로드에서 추론 요청당 탄소 강도를 평가하기 위한 표준 기법을 제공했습니다. 동료 심사를 거친 연구 결과에 따르면, ‘카본 어웨어 AI 스케줄링’을 통해 지연 시간 증가를 1.1-1.7% 이내로 억제하면서 탄소 사용량을 최대 41%까지 줄일 수 있는 것으로 나타났습니다. 이에 따라, “배출량 감축에는 필연적으로 성능이 크게 저하되는 결과가 따른다”라는 주장의 설득력은 약해지고 있습니다. 그 결과, 팀이 가시성과 제어 기능을 모두 필요로 하는 AI 운영 스택 분야에서 탄소 인식 API 및 SDK 플랫폼 시장의 중요성이 점점 더 커지고 있습니다.
인터넷 서비스 제공업체마다 차이가 있는 카본 신호 데이터의 품질
탄소 인식 애플리케이션 프로그래밍 인터페이스(API) 및 소프트웨어 개발 키트(SDK) 플랫폼 시장은 탄소 신호 제공업체와 지역 간 데이터 품질에 차이가 있어 여전히 큰 도입 장벽에 직면해 있습니다. 데이터 공백이 가장 두드러지는 지역은 남아시아와 동남아시아 일부, 사하라 이남 아프리카, 남미이며, 이들 지역에서는 실시간 배출량 상한선 데이터가 제한적이거나 아예 존재하지 않기 때문에 구매자들은 정확도가 낮은 연간 평균치를 얼터너티브 데이터로 활용할 수밖에 없는 상황입니다. 성숙한 시장에서도 평균 배출 강도와 한계 배출 강도의 차이는 특히 재생에너지 도입률이 높은 전력 시스템에서 발전 일정 결정에 실질적인 차이를 초래할 가능성이 있습니다. WattTime과 REsurety는 2025년 3월, 전 세계 무료 ‘Grid Emissions Data” 플랫폼을 출시하여 자격을 갖춘 사용자가 1시간 단위의 한계 데이터에 접근할 수 있도록 개선했으나, 제약이 있는 지역의 실시간 예측 품질 문제는 완전히 해결되지는 않았습니다. 따라서, 언뜻 보기에 동일한 이용 사례에 대응하는 것처럼 보여도, 그 기초가 되는 가정이 다른 공급업체를 비교할 때 구매자는 여전히 조사 방법론상의 위험에 노출되어 있습니다. 이러한 점 때문에 Carbon Aware API 및 SDK 플랫폼 시장이 특정 분야로의 도입에서 보다 광범위한 기업 표준화로 전환되는 속도가 제한되고 있습니다.
부문별 분석
2025년, 플랫폼 솔루션은 탄소 인식 애플리케이션 프로그래밍 인터페이스(API) 및 소프트웨어 개발 키트(SDK) 시장의 62.51%를 차지했으며, 통합형 제공 모델이 기업들의 조기 도입에 있어 선호되는 선택지가 되었습니다. 구매자들이 번들형 플랫폼을 선호한 이유는 여러 팀에 걸쳐 있는 API 관리, 카본 시그널의 정규화, 보고서 대시보드를 연동하는 데 필요한 작업을 줄일 수 있기 때문입니다. 이러한 경향은 더 신속한 가치 실현과 통합 부담 경감을 대가로 높은 라이선스 비용을 정당화할 수 있는 대규모 조직에서 가장 두드러지게 나타났습니다. 또한, 초기 도입은 하이퍼스케일러, 전 세계 은행, 대형 기술 기업 등 이미 강력한 사내 플랫폼 엔지니어링 역량을 갖춘 기술적으로 성숙한 고객들에게 집중되어 있었습니다. 이러한 상황에서 Carbon Aware API 및 SDK 플랫폼 시장에서는 제한적인 단일 기능 도구가 아닌, 관리형 운영 환경을 제공할 수 있는 벤더가 높은 평가를 받았습니다.
서비스 시장은 2031년까지 연평균 성장률(CAGR) 18.15%로 확대될 것으로 예상되며, 이는 많은 신규 구매자들에게 도구만으로는 충분하지 않음을 보여줍니다. 다음 단계의 고객군에는 ISO 표준에 부합하는 소프트웨어 기반 탄소 측정 기법을 고객 고유의 파이프라인 및 운영 전략에 적용하기 위한 지원이 필요한 조직이 포함됩니다. 아마데우스는 2026년 1월, 실제 운영 수준의 탄소 측정 엔진인 ‘Carmen”를 그린 소프트웨어 재단에 이관했습니다. 이는 핵심 측정 도구에 대한 접근이 점차 용이해지고 있는 반면, 구현에 관한 전문 지식은 여전히 상업적 가치가 높다는 것을 시사합니다. 따라서, 탄소 인식 애플리케이션 프로그래밍 인터페이스(API) 및 소프트웨어 개발 키트(SDK) 플랫폼 산업은 라이선스 수익과 서비스 수익이 경쟁하는 것이 아니라, 서로를 보완하는 모델로 전환되고 있습니다.
2025년, 탄소 집약도 API는 탄소 인식 애플리케이션 프로그래밍 인터페이스(API) 및 소프트웨어 개발 키트(SDK) 플랫폼 시장의 54.23%를 차지하고 있으며, 이는 하류 스케줄링 및 보고서 작성 도구에 있어 주요 데이터 계층으로서의 역할을 반영하고 있습니다. 이 지위는 일시적인 것이 아니라 구조적인 것입니다. 왜냐하면 대부분의 다른 용도 범주에서는 최적화를 수행하기 전에 여전히 신뢰할 수 있는 탄소 집약도 데이터 스트림에 의존하고 있기 때문입니다. Carbon Aware Kubernetes 스케줄링 및 CI/CD 워크플로우의 통합은 이미 의미 있는 이용 사례가 되고 있지만, 클라우드, 클러스터, 소프트웨어 제공 방식에 따라 배포 로직이 다르기 때문에 여전히 세분화가 진행되고 있습니다. 따라서, CarbonAware API 및 SDK 플랫폼 시장은 다른 모든 용도의 작동을 뒷받침하는 데이터 레이어를 중심으로 계속해서 발전하고 있습니다. 신뢰할 수 있는 신호 품질과 강력한 정규화 기능을 갖춘 공급업체는 보다 제한적인 오케스트레이션 기능만을 제공하는 공급업체보다 구매자의 의사결정 과정에서 더 중요한 위치를 차지하고 있습니다.
AI 및 고성능 컴퓨팅(HPC) 워크로드 최적화 시장은 2031년까지 연평균 성장률(CAGR) 17.31%를 기록하며 성장할 것으로 예상되며, 가장 빠르게 성장하는 응용 분야가 될 전망입니다. 이러한 성장은 AI의 에너지 수요가 실시간 추론으로 이동하고 있기 때문이며, 이를 통해 고주파수의 전체 프로덕션 워크로드 전반에 걸쳐 스케줄링 결정을 대규모로 반복할 수 있게 됩니다. 그린 소프트웨어 재단(Green Software Foundation)의 AI용 SCI(탄소 인사이트 지수)는 이러한 이용 사례에 대해 보다 공식적인 측정 프레임워크를 제공함으로써, 기업 팀이 워크로드 수준의 탄소 관리에 대한 투자를 정당화할 수 있도록 돕고 있습니다. 엣지 스케줄링이나 IoT 텔레메트리 같은 다른 용도들은 아직 초기 단계에 있지만, 연결된 시스템과 개발자 도구 전반에 걸쳐 탄소 데이터가 더욱 보편화됨에 따라 그 혜택을 누리게 될 것입니다.
지역별 분석
2025년, 북미는 탄소 인식 API 및 SDK 플랫폼 시장 점유율의 37.29%를 차지하며, 지역별 수요의 중심지로서의 위상을 유지했습니다. 이 지역은 고밀도 하이퍼스케일 인프라, 대규모 클라우드 네이티브 개발자 커뮤니티, 탄소 저감형 오픈소스 도구에 대한 조기 접근과 같은 이점을 누리고 있습니다. 캘리포니아주의 SB 253과 SB 261은 연방 정부의 기후 규제 지속성에 의존하지 않는 공시 압력을 조성함으로써, 규정 준수 대상 범위를 확대했습니다. 미국 증권거래위원회(SEC)는 2026년 5월 기후 변화 공시 규정의 철회를 제안했으나, 이러한 변경으로 인해 주 차원의 의무가 폐지된 것은 아니며, 더욱 엄격한 해외 보고 환경에서 사업을 지속하는 기업들의 요구에도 부응하지 못하고 있습니다. 남미 시장 규모는 여전히 작지만, 브라질은 대규모 IT 부문과 유럽의 보고 기준을 준수하는 자회사를 통해 단기적으로는 가장 명확한 신호를 보내고 있습니다.
유럽의 경우, 제출된 자료에는 지역별 점유율 수치가 공개되어 있지 않았으나, 탄소 인식 애플리케이션 프로그래밍 인터페이스(API) 및 소프트웨어 개발 키트(SDK) 플랫폼 시장에서 여전히 정책이 가장 집중되고 있는 지역이었습니다. 2026년 CSRD(기업 지속가능성 보고 지침) 보고에 따라, 용도 수준의 소프트웨어 배출량 데이터를 보다 일관성 있고 감사 가능한 형태로 구조화할 수 있는 수요가 증가하고 있습니다. 독일, 영국, 프랑스는 기업의 보고 체계가 성숙해 있을 뿐만 아니라 대규모 개발자 생태계와 클라우드 생태계를 모두 갖추고 있어, 국가별 최대 수요 거점으로 두각을 나타내고 있습니다. 중동은 아직 초기 단계이지만, 사우디아라비아와 아랍에미리트(UAE)에서 진행 중인 정부 주도의 클라우드 프로그램이 데이터센터 및 디지털 인프라 계획 수립 과정에서 탄소 배출량 측정에 활용되며, 정책 주도형 기회를 창출하기 시작하고 있습니다.
아시아태평양은 2031년까지 연평균 성장률(CAGR) 17.04%를 나타낼 것으로 예측되며, 탄소 인식 애플리케이션 프로그래밍 인터페이스(API) 및 소프트웨어 개발 키트(SDK) 플랫폼 시장에서 가장 빠르게 성장하는 지역 시장이 될 전망입니다. 일본은 그 기세의 상당 부분을, 지속적으로 발전하고 있는 SSBJ 공시 지침과 NTT가 2026년 3월에 발표한 “제조부터 폐기에 이르는 소프트웨어 수명 주기”에 관한 CO2 규정을 통해 주도하고 있습니다. 한국은 대형 상장 기업에 대한 ESG 보고 의무화라는 새로운 정책의 핵심을 제시하고 있습니다. 한편, 인도의 성장은 국내 규제보다는 수출 지향적인 IT 서비스 부문에 대한 노출에 의해 주도되고 있습니다. 중국은 표준화 참여 및 보다 광범위한 탄소 정책 수립을 통해 장기적인 로드맵을 마련해 나가고 있습니다. 한편, 아프리카는 여전히 개발도상 단계에 있으며, 수요는 소수의 다국적 기업 관련 사업에 집중되어 있습니다.
기타 혜택
- 엑셀 형식 시장 예측(ME) 시트
- 3개월간의 애널리스트 지원
자주 묻는 질문
목차
제1장 서론
제2장 조사 방법
제3장 주요 요약
제4장 시장 구도
제5장 시장 규모와 성장 예측
제6장 경쟁 구도
제7장 시장 기회와 향후 전망
JHS 26.07.07According to Mordor Intelligence, the carbon-aware application programming interface (API) and software development kit (SDK) platform market size is projected to be USD 1.23 billion in 2025, USD 1.43 billion in 2026, and reach USD 3.03 billion by 2031, growing at a CAGR of 16.25% from 2026 to 2031.
This report is Segmented by Component (Platform, and Services), Application (Carbon-Aware Kubernetes Scheduling, and More), Deployment Mode (Cloud-Based, and More), Organization Size (Large Enterprises, and More), End User (Retail and E-Commerce, and More), and Geography. The Market Forecasts are Provided in Terms of Value (USD).
Global Carbon-Aware Application Programming Interface (API) and Software Development Kit (SDK) Platform Market Trends and Insights
Increasing Audit-Ready Carbon Disclosure Requirements
The carbon-aware application programming interface (API) and software development kit (SDK) platform market is seeing its strongest commercial pull from mandatory disclosure frameworks that now require more traceable software emissions data. In 2026, many organizations across Europe are filing their first CSRD reports, and this process is raising pressure for structured, machine-readable emissions information that meets assurance requirements. The Software Carbon Intensity method maps software activity into a consistent reporting structure, which gives buyers a clearer way to request comparable carbon data from vendors and internal engineering teams. That shift matters because manual estimates are less useful when procurement teams seek application-level evidence rather than broad annual averages. The carbon-aware API and SDK platform market is therefore moving closer to core enterprise reporting infrastructure, especially for companies that sell software into Europe. State-level obligations, such as California SB 253, are adding a parallel reporting stream outside federal policy, which further broadens the compliance base addressed by these platforms.
AI and High-Performance Compute Workload Carbon Visibility
The carbon-aware application programming interface (API) and software development kit (SDK) platform market is also being driven by the rapid expansion of AI infrastructure and the need to measure its operating footprint with greater precision. Worldwide data center electricity use reached 448TWh in 2025, and current projections point to 945TWh by 2030, which keeps carbon visibility high on infrastructure roadmaps. The mix of energy demand is also changing because inference accounts for 80-90% of total AI energy consumption, so the measurement problem now sits in live production environments rather than only in model training labs. The Green Software Foundation ratified SCI for AI in late 2025, providing developers with a standard way to evaluate per-inference-request carbon intensity across GPU-heavy workloads. Peer-reviewed research also showed that carbon-aware AI scheduling can cut carbon use by up to 41% while keeping latency increases within 1.1-1.7%, which weakens the argument that lower emissions must come with a material performance penalty. As a result, the carbon-aware API and SDK platform market is gaining greater prominence in AI operations stacks where teams need both visibility and control.
Fragmented Carbon Signal Data Quality across Providers
The carbon-aware application programming interface (API) and software development kit (SDK) platform market still faces a major deployment barrier due to uneven data quality across carbon signal providers and regions. Coverage gaps are most visible in parts of South and Southeast Asia, Sub-Saharan Africa, and South America, where real-time marginal emissions data are limited or absent, forcing buyers to fall back on weaker annual-average proxies. Even in mature markets, the difference between average and marginal emissions intensity can lead to materially different scheduling decisions, especially in grids with high renewable penetration. WattTime and REsurety launched a free global Grid Emissions Data platform in March 2025, which improved access to hourly marginal data for qualified users but did not fully address real-time forecast quality in constrained regions. Buyers are therefore still exposed to methodology risk when they compare vendors that appear to address the same use case but differ in their underlying assumptions. This limits the pace at which the carbon-aware API and SDK platform market can move from targeted deployments to broader enterprise standardization.
Other drivers and restraints analyzed in the detailed report include:
- FinOps and Carbon Cost Co-Optimization
- Carbon Intensity API Adoption for Runtime Scheduling
- Integration Burden Across Cloud, DevOps, and Application Stacks
For complete list of drivers and restraints, kindly check the Table Of Contents.
Segment Analysis
Platform solutions held 62.51% of the carbon-aware application programming interface (API) and software development kit (SDK) market in 2025, making the integrated delivery model the preferred choice for early enterprise adoption. Buyers favored bundled platforms because they reduce the work needed to connect API management, carbon signal normalization, and reporting dashboards across multiple teams. This preference was strongest among large organizations that could justify higher license costs in exchange for faster time-to-value and lower integration effort. Early adoption also leaned toward technically mature customers, such as hyperscalers, global banks, and large technology firms, that already had strong internal platform engineering capabilities. In that context, the carbon-aware API and SDK platform market rewarded vendors that could deliver a managed operating environment rather than a narrow point tool.
Services are projected to expand at a 18.15% CAGR through 2031, indicating that tooling alone is not enough for many new buyers. The next wave of customers includes organizations that need help translating ISO-compliant software carbon methods into client-specific pipelines and operating policies. Amadeus transferred Carmen, its production-grade carbon measurement engine, to the Green Software Foundation in January 2026, which signals that core measurement tooling is becoming easier to access while implementation expertise remains commercially valuable. The carbon-aware application programming interface (API) and software development kit (SDK) platform industry is therefore moving toward a model where license revenue and services revenue reinforce each other rather than compete.
Carbon intensity APIs accounted for 54.23% of the carbon-aware application programming interface (API) and software development kit (SDK) platform market in 2025, reflecting their role as the primary data layer for downstream scheduling and reporting tools. This position is structural rather than temporary because most other application categories still depend on a reliable stream of carbon-intensity data before any optimization can happen. Carbon-aware Kubernetes scheduling and CI/CD workflow integration are already meaningful use cases, but they remain more fragmented because deployment logic changes across clouds, clusters, and software delivery practices. The carbon-aware API and SDK platform market, therefore, continues to center on the data layer that feeds all other application behavior. Vendors with dependable signal quality and strong normalization capabilities remain closer to the center of buyer decision-making than those that offer only narrower orchestration features.
AI and high-performance computing workload optimization is projected to grow at a 17.31% CAGR through 2031, making it the fastest-growing application area. That growth follows the shift in AI energy demand toward live inference, where scheduling decisions can be repeated at scale across high-frequency production workloads. The Green Software Foundation's SCI for AI work provides a more formal measurement framework for that use case, making it easier for enterprise teams to justify investment in workload-level carbon controls. Other applications, such as edge scheduling and IoT telemetry, remain early, but they benefit as carbon data becomes more ambient across connected systems and developer tools.
Complete Report Scope:
- By Component
- Platform
- Services
- Implementation and Integration Services
- Support and Maintenance Services
- By Application
- Carbon-Aware Kubernetes Scheduling
- Carbon Intensity APIs
- AI and High-Performance Computing Workload Optimization
- Continuous Integration (CI)/Continuous Delivery (CD) and Developer Workflow Integration
- Other Applications
- By Deployment Mode
- Cloud-Based
- On-Premises
- Hybrid
- By Organization Size
- Large Enterprises
- Small and Medium Enterprises
- By End User
- Information Technology and Telecom
- Banking, Financial Services, and Insurance
- Energy and Utilities
- Manufacturing
- Retail and E-Commerce
- Healthcare and Life Sciences
- Other End Users
- By Geography
- North America
- United States
- Canada
- Mexico
- South America
- Brazil
- Argentina
- Rest of South America
- Europe
- Germany
- United Kingdom
- France
- Italy
- Spain
- Russia
- Rest of Europe
- Asia-Pacific
- China
- India
- Japan
- South Korea
- Australia
- Rest of Asia-Pacific
- Middle East
- Saudi Arabia
- United Arab Emirates
- Turkey
- Rest of Middle East
- Africa
- South Africa
- Nigeria
- Rest of Africa
- North America
Geography Analysis
North America held 37.29% of the carbon-aware API and SDK platform market share in 2025, maintaining its position as the leading regional demand center. The region benefits from dense hyperscale infrastructure, large cloud-native developer communities, and early exposure to carbon-aware open-source tooling. California SB 253 and SB 261 broadened the compliance base by creating disclosure pressure that does not depend on federal climate rule continuity. The SEC proposed rescinding its climate disclosure rules in May 2026, but that change did not remove state-level obligations or address the needs of companies that still operate in stricter overseas reporting environments. South America remained smaller, with Brazil providing the clearest near-term signal through its large IT sector and through subsidiaries tied to European reporting expectations.
Europe did not have a disclosed regional share figure in the input, yet it remained the most policy-dense part of the carbon-aware application programming interface (API) and software development kit (SDK) platform market. CSRD reporting in 2026 is increasing demand for application-level software emissions data that can be structured in a more consistent and auditable form. Germany, the United Kingdom, and France stood out as the largest national demand centers because they combine strong enterprise reporting maturity with large developer and cloud ecosystems. The Middle East is still early, but sovereign cloud programs in Saudi Arabia and the UAE are beginning to create a policy-led opening for carbon measurement in data center and digital infrastructure planning.
Asia-Pacific is projected to grow at a 17.04% CAGR through 2031, making it the fastest-growing regional market for the carbon-aware application programming interface and software development kit platform market. Japan is shaping much of that momentum through its evolving SSBJ disclosure guidance and NTT's March 2026 publication of CO2 rules for the cradle-to-grave software lifecycle. South Korea adds another policy anchor with mandatory ESG reporting for large listed companies, while India's growth is led more by export-oriented IT services exposure than by domestic regulation. China is building a longer-term pathway through standards participation and broader carbon policy development, while Africa remains nascent, with demand concentrated in a small number of multinational-linked operations.
- Watershed Technology, Inc.
- Persefoni AI, Inc.
- Normative AB
- Plan A Earth GmbH
- Sweep SAS
- Greenly SAS
- Emitwise Limited
- Asuene Inc.
- 51toCarbonZero Limited
- Key ESG Limited
- FigBytes Inc.
- Novisto Inc.
- Sphera Solutions, Inc.
- Measurabl, Inc.
- Sinai Technologies, Inc.
- CarbonTrail Ltd.
- Brightest GmbH
- Unravel Carbon Pte. Ltd.
- Climatiq GmbH
- CarbonChain Ltd.
Additional Benefits:
- The market estimate (ME) sheet in Excel format
- 3 months of analyst support
TABLE OF CONTENTS
1 INTRODUCTION
- 1.1 Study Assumptions and Market Definition
- 1.2 Scope of the Study
2 RESEARCH METHODOLOGY
3 EXECUTIVE SUMMARY
4 MARKET LANDSCAPE
- 4.1 Market Overview
- 4.2 Market Drivers
- 4.2.1 Increasing Audit-Ready Carbon Disclosure Requirements
- 4.2.2 FinOps and Carbon Cost Co-Optimization
- 4.2.3 AI and High-Performance Compute Workload Carbon Visibility
- 4.2.4 Carbon Intensity API Adoption For Runtime Scheduling
- 4.2.5 Standardization of Software Carbon Metrics and Tooling
- 4.2.6 Embedded Sustainability Controls In Engineering Workflows
- 4.3 Market Restraints
- 4.3.1 Fragmented Carbon Signal Data Quality Across Providers
- 4.3.2 Integration Burden Across Cloud, DevOps, and Application Stacks
- 4.3.3 Performance Tradeoffs in Aggressive Carbon-Aware Scheduling
- 4.3.4 Limited Buyer Readiness to Operationalize Developer-Facing Carbon Workflows
- 4.4 Industry Value Chain Analysis
- 4.5 Regulatory Landscape
- 4.6 Technological Outlook
- 4.7 Impact of Macroeconomic Factors on the Market
- 4.8 Porter's Five Forces Analysis
- 4.8.1 Threat of New Entrants
- 4.8.2 Bargaining Power of Suppliers
- 4.8.3 Bargaining Power of Buyers
- 4.8.4 Threat of Substitutes
- 4.8.5 Intensity of Competitive Rivalry
5 MARKET SIZE AND GROWTH FORECASTS (VALUE)
- 5.1 By Component
- 5.1.1 Platform
- 5.1.2 Services
- 5.1.2.1 Implementation and Integration Services
- 5.1.2.2 Support and Maintenance Services
- 5.2 By Application
- 5.2.1 Carbon-Aware Kubernetes Scheduling
- 5.2.2 Carbon Intensity APIs
- 5.2.3 AI and High-Performance Computing Workload Optimization
- 5.2.4 Continuous Integration (CI)/Continuous Delivery (CD) and Developer Workflow Integration
- 5.2.5 Other Applications
- 5.3 By Deployment Mode
- 5.3.1 Cloud-Based
- 5.3.2 On-Premises
- 5.3.3 Hybrid
- 5.4 By Organization Size
- 5.4.1 Large Enterprises
- 5.4.2 Small and Medium Enterprises
- 5.5 By End User
- 5.5.1 Information Technology and Telecom
- 5.5.2 Banking, Financial Services, and Insurance
- 5.5.3 Energy and Utilities
- 5.5.4 Manufacturing
- 5.5.5 Retail and E-Commerce
- 5.5.6 Healthcare and Life Sciences
- 5.5.7 Other End Users
- 5.6 By Geography
- 5.6.1 North America
- 5.6.1.1 United States
- 5.6.1.2 Canada
- 5.6.1.3 Mexico
- 5.6.2 South America
- 5.6.2.1 Brazil
- 5.6.2.2 Argentina
- 5.6.2.3 Rest of South America
- 5.6.3 Europe
- 5.6.3.1 Germany
- 5.6.3.2 United Kingdom
- 5.6.3.3 France
- 5.6.3.4 Italy
- 5.6.3.5 Spain
- 5.6.3.6 Russia
- 5.6.3.7 Rest of Europe
- 5.6.4 Asia-Pacific
- 5.6.4.1 China
- 5.6.4.2 India
- 5.6.4.3 Japan
- 5.6.4.4 South Korea
- 5.6.4.5 Australia
- 5.6.4.6 Rest of Asia-Pacific
- 5.6.5 Middle East
- 5.6.5.1 Saudi Arabia
- 5.6.5.2 United Arab Emirates
- 5.6.5.3 Turkey
- 5.6.5.4 Rest of Middle East
- 5.6.6 Africa
- 5.6.6.1 South Africa
- 5.6.6.2 Nigeria
- 5.6.6.3 Rest of Africa
- 5.6.1 North America
6 COMPETITIVE LANDSCAPE
- 6.1 Market Concentration
- 6.2 Strategic Moves
- 6.3 Market Share Analysis
- 6.4 Company Profiles (includes Global Level Overview, Market Level Overview, Core Segments, Financials as available, Strategic Information, Market Rank/Share, Products and Services, Recent Developments)
- 6.4.1 Watershed Technology, Inc.
- 6.4.2 Persefoni AI, Inc.
- 6.4.3 Normative AB
- 6.4.4 Plan A Earth GmbH
- 6.4.5 Sweep SAS
- 6.4.6 Greenly SAS
- 6.4.7 Emitwise Limited
- 6.4.8 Asuene Inc.
- 6.4.9 51toCarbonZero Limited
- 6.4.10 Key ESG Limited
- 6.4.11 FigBytes Inc.
- 6.4.12 Novisto Inc.
- 6.4.13 Sphera Solutions, Inc.
- 6.4.14 Measurabl, Inc.
- 6.4.15 Sinai Technologies, Inc.
- 6.4.16 CarbonTrail Ltd.
- 6.4.17 Brightest GmbH
- 6.4.18 Unravel Carbon Pte. Ltd.
- 6.4.19 Climatiq GmbH
- 6.4.20 CarbonChain Ltd.
7 MARKET OPPORTUNITIES AND FUTURE OUTLOOK
- 7.1 White-Space and Unmet-Need Assessment