

|
시장보고서
상품코드
2073093
지속 가능 조달 및 공급업체 탄소 평가 소프트웨어 시장 : 점유율 분석, 업계 동향과 통계, 성장 예측(2026-2031년)Sustainable Procurement and Supplier Carbon Scoring Software - Market Share Analysis, Industry Trends & Statistics, Growth Forecasts (2026 - 2031) |
||||||
 Mordor Intelligence
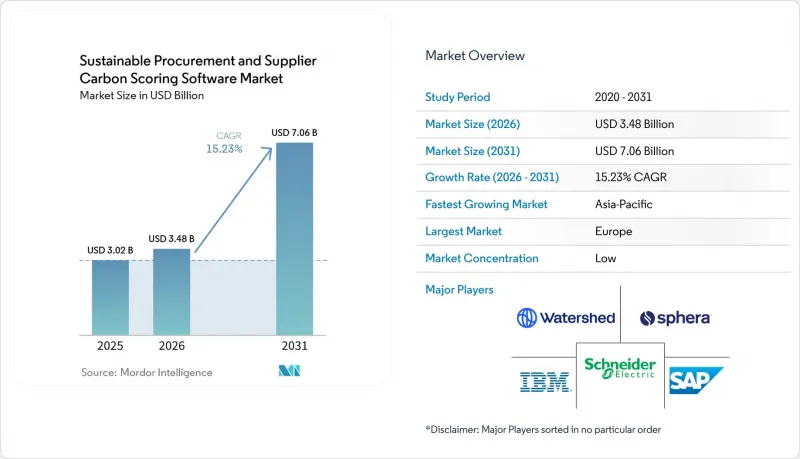
Mordor Intelligence에 의하면, 지속 가능조달 및 공급업체 탄소 평가 소프트웨어 시장 규모는 2025년에 30억 2,000만 달러로 평가되었고 2026년 34억 8,000만 달러에서 2031년까지 70억 6,000만 달러에 이를 것으로 예측되며, 예측 기간(2026-2031년) CAGR은 15.23%를 나타낼 전망입니다.
본 보고서는 기능별(공급업체와의 연계 및 시정 조치 관리, 기타), 도입 형태별(클라우드 기반 및 On-Premise형), 조직 규모별(대기업 및 중소기업), 최종 사용자 산업별(은행/금융서비스/보험, 기타), 지역별로 분류되어 있습니다. 시장 전망은 금액(달러) 단위로 제시되어 있습니다.
전 세계 지속 가능 조달 및 공급업체 탄소 평가 소프트웨어 시장 동향과 인사이트
기업 바이어들의 스코프 3 공개에 대한 압박이 커지고 있습니다.
지속 가능 조달 및 공급업체 탄소 평가 소프트웨어 시장은 주요 경제권에서 Scope 3 보고 기한이 더욱 엄격해지고 있는 추세에 힘입어 성장하고 있습니다. 캘리포니아주는 2026년 2월 SB 253에 관한 첫 번째 보고 규정을 채택했습니다. 이 규정에 따르면, 기업 수익 기준치를 초과하는 기업은 2026년부터 스코프 1 및 스코프 2에 대한 공시를 시작해야 하며, 스코프 3에 대한 공시 의무는 이 1단계 이후에 이어질 예정입니다. 유럽연합(EU) 역시 2026년 개정안을 통해 필요한 데이터 항목의 총수를 축소한 후에도, 개정된 지속 가능성 보고 체계 내에서 스코프 3 공시를 유지했습니다. 이는 공식 보고서에서 공급업체 데이터의 품질과 출처가 이전보다 더 중요하게 여겨지게 되었기 때문에 구매자가 지출액을 바탕으로 한 대략적인 추정치에 더 이상 오랫동안 의존할 수 없게 되었음을 의미합니다. 그 결과, 조달 팀은 공급업체와의 협의, 데이터 수집, 평가를 일회성 스프레드시트 작업이 아닌, 소프트웨어를 활용한 정기적인 업무로 전환해 나가고 있습니다. 따라서, 보고 주기가 시작된 직후 공급업체 데이터 부족에 직면하는 상황을 피하고자 하는 기업들로부터 지속 가능한 조달 및 공급업체 탄소 평가 소프트웨어 시장에 대한 수요가 증가하고 있습니다.
조달 주도의 탈탄소화가 예산이 편성된 업무 흐름으로 자리 잡게 됩니다.
또한, 조달 팀이 공급업체의 배출량 관리를 예산이 확보된 운영 업무로 다루게 된 점도 지속 가능 조달 및 공급업체 탄소 평가 소프트웨어 시장의 확대 요인으로 작용하고 있습니다. EcoVadis는 2026년 5월, 자사 네트워크 전체에서 이미 2조 5,000억 달러를 초과하는 전 세계 지출이 지속 가능성 리스크 분석 결과와 연관되어 있다고 보고했습니다. 이는 공급업체에 대한 지속 가능성 심사가 주류 조달 활동으로 자리 잡았음을 보여줍니다. 해당 보고서에 따르면, 5만 5,838개 기업이 적어도 하나의 온실가스(GHG) 지표를 보고했으며, 2025년에는 2만 5,852개의 신규 기업이 지속 가능성 평가를 도입한 것으로 나타났습니다. 이는 구매 측과 공급 측 양측 모두에서 참여가 확대되고 있음을 보여줍니다. 조달 부서가 워크플로우를 주도하게 되면, 해당 도구가 공급업체와의 협력, 위험 검토, 조달 결정 등을 지원하게 되므로 소프트웨어에 대한 지출을 정당화하기가 쉬워집니다. 이에 따라 이 분야는 재량적인 ESG 예산에서 핵심적인 조달 시스템으로 전환되고 있습니다. 지속 가능 조달 및 공급업체 탄소 평가 소프트웨어 시장은 이러한 변화로부터 직접적인 혜택을 보고 있습니다. 왜냐하면 정기적인 보고 프로젝트보다 지속적인 조달 활동이 더 안정적인 수요를 창출하기 때문입니다.
공급업체 데이터의 미비 사항이 점수의 신뢰성을 떨어뜨립니다.
지속 가능 조달 및 공급업체 탄소 평가 소프트웨어 시장은 많은 공급업체의 기록이 여전히 불완전하기 때문에 근본적인 품질 문제에 직면해 있습니다. 이 문제는 공급업체의 롱테일 부문에서 특히 두드러지는데, 소규모 공급업체의 경우 지속 가능성 담당자가 제한적이며 사내 데이터 시스템도 취약한 경우가 많기 때문입니다. 그 결과, 많은 구매 조직은 동일한 스코어링 환경 내에서 검증된 값, 부분적으로 공개된 정보, 추정값 등을 조합하여 활용할 수밖에 없는 상황에 처해 있습니다. 조달 팀이 점수의 어느 정도가 1차 공급업체 정보에 근거한 것인지 보여줄 수 없다면, 결과에 대한 신뢰도는 떨어집니다. 이로 인해 공급업체 선정 시 망설임이 생깁니다. 왜냐하면 구매자는 확실한 기초 데이터가 없음에도 불구하고, 단지 보기 좋은 점수만 만들어내는 플랫폼은 원하지 않기 때문입니다. 따라서, 지속 가능한 조달 및 공급업체 탄소 평가 소프트웨어 시장은 데이터 수집의 깊이가 여전히 공개에 대한 기대치에 미치지 못하고 있어, 도입 지연이라는 위험에 계속 노출되어 있습니다.
부문별 분석
2025년, 공급업체 탄소 평가 및 벤치마킹은 시장의 41.45%를 차지하며, 지속 가능 조달 및 공급업체 탄소 평가 소프트웨어 시장에서 가장 큰 비중을 차지했습니다. 이러한 우위는 조달 팀이 일반적으로 “어떤 공급업체의 탄소 리스크가 낮아 조달 및 협력 시 우선적으로 고려해야 하는가”라는 실용적인 질문에서 출발하는 경향을 반영하고 있습니다. 또한 벤치마킹은 구매자가 카테고리나 지역을 넘나들며 공급업체를 명확하게 비교할 수 있는 수단을 제공함으로써, 일상적인 조달 결정에 탄소 성과를 반영하기 쉽게 해줍니다. 도입 초기 단계에서는 많은 조직이 데이터 수집 프로세스 전체를 재설계하기보다는 이용 가능한 공급업체가 제출한 데이터나 추정 기법을 활용할 수 있다는 점 때문에 스코어링 계층을 선호하여 채택했습니다.
공급업체의 탄소 데이터 수집 시장은 2031년까지 연평균 성장률(CAGR) 16.77%로 확대될 것으로 예상되며, 이는 가장 빠르게 성장하는 기능 부문이 될 것입니다. 이러한 경향은 구매 담당자들이 점수 산정의 근거가 될 보다 확실한 증거를 요구하고 있기 때문에 초기 점수 산정 도구에 이어 데이터 수집에 대한 투자가 더욱 확대되고 있음을 보여줍니다. 지속 가능 조달 및 공급업체 탄소 평가 소프트웨어 시장은 산출물 표시에서 투입물의 질로 전환되고 있으며, 이러한 변화로 인해 공급업체 포털, 안내형 설문지, 문서 관리, 검증 규칙의 가치가 높아지고 있습니다. 적정 조치의 관리 및 보고 기능도 여전히 중요합니다. 왜냐하면, 점수가 공급업체에 대한 후속 조치, 목표 추적, 감사에 대응할 수 있는 기록으로 이어지지 않는다면 그 가치는 제한적이기 때문입니다. 그 밖의 기능들도 제품의 탄소 발자국이나 디지털 제품 정보에 대한 요구 사항에 대응하는 등 관련 이용 사례를 지속적으로 반영하고 있으며, 시간이 지남에 따라 기능의 범위를 넓혀가고 있습니다.
클라우드 기반 도입은 2025년에 72.11%의 점유율을 차지할 것으로 예상되며, 2031년까지 연평균 성장률(CAGR) 17.45%로 성장할 것으로 전망됩니다. 이는 지속 가능 조달 및 공급업체 탄소 평가 소프트웨어 시장에서 가장 큰 규모를 차지하는 모델이 동시에 가장 빠르게 성장하고 있음을 의미합니다. 클라우드를 통한 제공은 이 범주에 매우 적합합니다. 이는 공급업체, 구매 담당자, 사내 팀이 대규모의 로컬 인프라 없이도 공유 워크플로에 접근할 수 있어야 하기 때문입니다. 또한, 제품 업데이트를 신속하게 진행하고, 공급업체 온보딩을 확대하며, 자동화 기능을 일상 업무에 손쉽게 통합할 수 있게 해줍니다.
SAP의 2026년 제품 로드맵에서는 차별화된 기능이 클라우드 제공과 점점 더 밀접하게 연계되고 있음이 드러났습니다. 구체적으로 말하면, 지속 가능성 관련 기능이 독립형 수동 도구로 취급되는 것이 아니라 소프트웨어 환경에 통합되어 있습니다. 또한 SAP는 2026년 1분기의 “Sustainability Footprint Management” 업데이트에서 수동 데이터 처리에 대한 의존도를 낮추고, ERP 연동 계산 워크플로우를 확대한 점을 강조했습니다. 엄격한 데이터 소재지 요건, 보안 요건 또는 조달 규정을 갖춘 조직, 특히 기밀성이 높은 산업 분야나 오랜 기간 ERP 환경을 운영해 온 조직의 경우, On-Premise 배포는 여전히 중요합니다. 혁신의 중심은 분명히 클라우드 플랫폼으로 이동하고 있으며, On-Premise 솔루션은 산업을 선도하기보다는 사업 연속성에 중점을 두게 되었습니다. 이로 인해, 클라우드 기반 조달 및 탄소 데이터 환경에서 이미 대규모로 사업을 전개하고 있는 벤더들에게 On-Premise 구축은 구조적인 경쟁 우위를 제공합니다.
지역별 분석
2025년, 유럽은 36.18%의 점유율을 차지하며, 지속 가능한 조달 및 공급업체 탄소 평가 소프트웨어 시장에서 지역 1위의 입지를 확립했습니다. 이 지역은 대기업들이 이미 공급업체 관련 지속 가능성 정보를 공식적으로 공개할 준비를 해야 했기 때문에 다른 대부분의 지역보다 먼저 움직이기 시작했습니다. 2026년 EU 개정으로 인해 직원 수 및 매출액에 관한 조사 범위는 축소되었으나, 스코프 3에 대한 의무는 프레임워크 내에 그대로 유지되었습니다. 즉, 단순화로 인해 공급업체 데이터에 대한 수요가 사라진 것은 아닙니다. 이것이 바로 보고 규정이 더욱 세분화되었음에도 불구하고, 유럽이 여전히 최대의 수익 기반으로 남아 있는 이유 중 하나입니다. 독일, 프랑스, 이탈리아, 영국의 기업들은 이미 공급업체에 대한 지속 가능성 기대가 더욱 확고히 자리 잡은 조달 환경에서 사업을 전개하고 있기 때문에 소프트웨어 도입은 새로운 규정 준수 압박과 더불어 기존의 사내 프로세스에 의해서도 뒷받침되고 있습니다.
북미는 2025년 지역별 순위에서 2위를 차지하고 있으며, 이는 주로 광범위한 조달 네트워크를 보유하고 캘리포니아주의 보고 일정에 조기에 대응해 온 미국에 기반을 둔 다국적 기업들에 의해 뒷받침되고 있습니다. 2026년 2월 캘리포니아주의 규정 제정에 따라, 정보 공개 준비가 단기적인 업무 과제가 되었으며, 공급업체 데이터 수집 및 사내 체계 정비에 대한 시급성이 높아졌습니다. 남미 시장 규모는 여전히 작지만, 원자재 및 제조업 등의 분야에서 수출을 주력으로 하는 기업들은 해외 주요 구매처가 공급업체의 배출량 기록에 대한 기준을 강화할 경우 여전히 영향을 받고 있습니다. 중동 및 아프리카도 2026년에는 시장 규모가 여전히 작았지만, 이 지역에서는 구매자들이 조달 프로세스의 현대화와 지속 가능성 보고 역량 구축을 병행하고 있어 시장 진입 기회가 생기고 있습니다. 이 지역 전반에 걸쳐 도입은 국제적인 고객을 보유한 대기업, 보다 엄격한 거버넌스가 요구되는 기업, 혹은 다국적 기업공급망 기준에 따라야 하는 기업에서 시작되는 경향이 있습니다.
아시아태평양은 2031년까지 연평균 성장률(CAGR) 16.23%를 나타낼 것으로 예측되며, 지속 가능 조달 및 공급업체 탄소 평가 소프트웨어 시장에서 가장 빠르게 성장하는 지역이 될 전망입니다. 일본 금융청은 2026년 4월에 단계적 로드맵을 발표하고, 2026년 4월부터 시작되는 회계연도부터 프라임 시장에 상장된 대기업에 대해 지속 가능성 정보 공시를 의무화하기로 했습니다. 여기에는 새로운 프레임워크에 따른 스코프 3 관련 요건도 포함되어 있습니다. 이를 통해 해당 지역에는 상장 기업과 그 공급망에 직접적인 영향을 미치는 중요한 규제 기반이 마련되었습니다. 또한, 유럽 바이어에게 제품을 공급하는 공급업체들이 내재된 배출량 및 관련 탄소 데이터에 대한 보다 상세한 기록을 요구받게 되면서, 수출 측의 압박도 아시아태평양의 성장을 뒷받침하고 있습니다. 그 결과, 해당 지역은 전 세계 고객의 요구 사항을 충족하는 충분한 문서 관리 체계를 유지하면서 공급업체 온보딩을 확대할 수 있는 플랫폼을 위한 주요 성장 영역으로 부상하고 있습니다.
기타 혜택
- 엑셀 형식 시장 예측(ME) 시트
- 3개월간의 애널리스트 지원
자주 묻는 질문
목차
제1장 서론
제2장 조사 방법
제3장 주요 요약
제4장 시장 구도
제5장 시장 규모와 성장 예측
제6장 경쟁 구도
제7장 시장 기회와 향후 전망
JHS 26.07.07According to Mordor Intelligence, the sustainable procurement and Supplier Carbon Scoring Software Market size was valued at USD 3.02 billion in 2025 and estimated to grow from USD 3.48 billion in 2026 to reach USD 7.06 billion by 2031, at a CAGR of 15.23% during the forecast period (2026-2031).
This report is Segmented by Function (Supplier Engagement and Corrective Action Management, and More), Deployment (Cloud-Based, and On-Premises), Organization Size (Large Enterprises, and Small and Medium Enterprises), End-User Industry (Banking, Financial Services and Insurance, and More), and Geography. The Market Forecasts are Provided in Terms of Value (USD).
Global Sustainable Procurement and Supplier Carbon Scoring Software Market Trends and Insights
Rising Scope 3 Disclosure Pressure from Enterprise Buyers
The sustainable procurement and supplier carbon scoring software market is being driven by the tightening timelines for Scope 3 reporting in major economies. California adopted its initial reporting regulations for SB 253 in February 2026, and the rule requires companies above the revenue threshold to begin filing Scope 1 and Scope 2 disclosures in 2026, with Scope 3 obligations following after that first phase. The European Union also kept Scope 3 disclosure inside the revised sustainability reporting framework, even after reducing the overall number of required data points in the 2026 amendment. This means buyers can no longer rely on broad spend-based estimates for long, because the quality and origin of supplier data now matter more in formal reporting. The practical result is that procurement teams are turning supplier outreach, data capture, and scoring into recurring, software-led work rather than one-time spreadsheet exercises. The sustainable procurement and supplier carbon scoring software market is therefore gaining demand from enterprises that want to avoid last-minute supplier data gaps once reporting cycles begin.
Procurement-Led Decarbonization Becomes a Budgeted Workflow
The sustainable procurement and supplier carbon scoring software market is also expanding because procurement teams are now treating supplier emissions management as a funded operating task. EcoVadis reported in May 2026 that more than USD 2.5 trillion in global spend was already linked to sustainability risk insights across its network, which shows that supplier sustainability screening has moved into mainstream sourcing activity. The same update said that 55,838 companies were reporting at least 1 GHG metric and that 25,852 new companies adopted sustainability ratings in 2025, indicating growing participation on both the buyer and supplier sides. Once procurement owns the workflow, software spending becomes easier to justify because the tools support supplier engagement, risk review, and sourcing decisions. This shifts the category away from discretionary ESG budgets and closer to core procurement systems. The sustainable procurement and supplier carbon scoring software market benefits directly from that change, as recurring procurement activity creates steadier demand than periodic reporting projects.
Supplier Data Gaps Limit Score Reliability
The sustainable procurement and supplier carbon scoring software market still faces a fundamental quality issue because many supplier records remain incomplete. The issue is strongest in long supplier tails, where smaller vendors often have limited sustainability staff and weaker internal data systems. That leads many buying organizations to work with a mix of verified values, partial disclosures, and estimated records inside the same scoring environment. When procurement teams cannot demonstrate how much of the score is based on primary supplier information, confidence in the result declines. This creates hesitation during vendor selection because buyers do not want a platform that produces neat scores without strong underlying coverage. The sustainable procurement and supplier carbon scoring software market, therefore, remains exposed to adoption delays, with data collection depth still weaker than disclosure expectations.
Other drivers and restraints analyzed in the detailed report include:
- Supplier Data Digitization Improves Emissions Scoring Accuracy
- Audit-Ready Carbon Data Reduces Reporting Friction
- Methodology Fragmentation Reduces Score Comparability
For complete list of drivers and restraints, kindly check the Table Of Contents.
Segment Analysis
Supplier carbon scoring and benchmarking accounted for 41.45% of the market in 2025, making it the largest function in the sustainable procurement and supplier carbon scoring software market. That lead reflects how procurement teams usually start with a practical question: which supplier poses lower carbon risk and which should be prioritized for sourcing or engagement. Benchmarking also gives buyers a clear way to compare suppliers across categories and regions, making it easier to incorporate carbon performance into routine procurement decisions. In the first phase of adoption, many organizations preferred scoring layers because they could work with available supplier submissions and estimation methods rather than redesign the entire data collection process.
Supplier carbon data collection is projected to grow at a 16.77% CAGR through 2031, which makes it the fastest-growing functional segment. This pattern shows that early scoring tools are now being followed by deeper investment in data capture, because buyers want stronger evidence behind the scores they use. The sustainable procurement and supplier carbon scoring software market is moving from output display to input quality, and this shift raises the value of supplier portals, guided questionnaires, document handling, and validation rules. Corrective action management and reporting functions also remain important because a score has limited value if it does not lead to supplier follow-up, target tracking, and audit-ready records. Other functions continue to absorb adjacent use cases, such as support for product carbon footprint and digital product information needs, broadening the functional map over time.
Cloud-based deployment accounted for 72.11% share in 2025 and is also projected to grow at a 17.45% CAGR through 2031. This means the largest deployment model is also the fastest-growing in the sustainable procurement and supplier carbon scoring software market. Cloud delivery fits the category well because suppliers, buyers, and internal teams need access to shared workflows without the heavy local infrastructure required. It also supports faster product updates, broader supplier onboarding, and easier integration of automation features into everyday use.
SAP's 2026 product roadmap showed how differentiated features are increasingly tied to cloud delivery, with new sustainability agents built into its software environment rather than treated as separate manual tools. SAP also highlighted Q1 2026 updates in Sustainability Footprint Management that reduced dependence on manual data handling and extended ERP-linked calculation workflows. On-premises deployment still matters for organizations with strict residency, security, or procurement rules, especially in sensitive sectors and long-standing ERP environments. Even so, the balance of innovation is clearly moving toward cloud platforms, leaving on-premises solutions more focused on continuity than on category leadership. This makes deployment a structural competitive advantage for vendors that already operate at scale in cloud-based procurement and carbon data environments.
Complete Report Scope:
- By Function
- Supplier Carbon Data Collection
- Supplier Carbon Scoring and Benchmarking
- Supplier Engagement and Corrective Action Management
- Carbon Reporting and Audit Trail Management
- Other Functions
- By Deployment
- Cloud-Based
- On-Premises
- By Organization Size
- Large Enterprises
- Small and Medium Enterprises
- By End-User Industry
- Banking, Financial Services, and Insurance
- Information Technology and Telecom
- Healthcare and Life Sciences
- Manufacturing
- Retail and Consumer Goods
- Automotive and Mobility
- Energy and Utilities
- Government and Public Sector
- Other End-User Industries
- By Geography
- North America
- United States
- Canada
- Mexico
- South America
- Brazil
- Argentina
- Rest of South America
- Europe
- Germany
- United Kingdom
- France
- Italy
- Spain
- Russia
- Rest of Europe
- Asia-Pacific
- China
- India
- Japan
- South Korea
- Australia
- Rest of Asia-Pacific
- Middle East
- Saudi Arabia
- United Arab Emirates
- Turkey
- Rest of Middle East
- Africa
- South Africa
- Nigeria
- Rest of Africa
- North America
Geography Analysis
Europe held a 36.18% share in 2025, giving it the leading regional position in the sustainable procurement and supplier carbon scoring software market. The region moved earlier than most others because large companies already had to prepare supplier-linked sustainability information for formal disclosures. The 2026 EU amendment narrowed the reporting scope in employee and turnover terms, but it kept Scope 3 obligations within the framework, meaning supplier data needs did not disappear with the simplification. This helps explain why Europe remains the largest revenue base even as reporting rules are being refined. Companies in Germany, France, Italy, and the United Kingdom already operate in procurement environments where supplier sustainability expectations are more established, so software adoption is supported by existing internal processes as much as by new compliance pressure.
North America held the second-largest regional position in 2025, supported mainly by U.S.-based multinationals with broad procurement networks and early exposure to California's reporting timetable. California's February 2026 rulemaking made disclosure preparation a near-term operational task, increasing the urgency around supplier data collection and internal readiness. South America remained smaller, but export-facing companies in sectors such as commodities and manufacturing are still affected when large overseas buyers demand stronger supplier emissions records. Middle East and Africa also remained smaller in 2026, though the region offers entry points where buyers are building procurement modernization and sustainability reporting capabilities in parallel. Across these regions, adoption tends to start with larger enterprises that have international customers, stricter governance expectations, or exposure to multinational supply chain standards.
Asia-Pacific is projected to grow at a 16.23% CAGR through 2031, making it the fastest-growing region in the sustainable procurement and supplier carbon scoring software market. Japan's Financial Services Agency released its phased roadmap in April 2026 and set mandatory sustainability disclosure requirements for larger Prime Market companies, effective for fiscal years beginning in April 2026, including Scope 3 expectations under the new framework. This gives the region an important regulatory anchor that reaches directly into listed companies and their supplier networks. Growth in Asia-Pacific is also supported by export-side pressure, as suppliers serving European buyers need better records of embedded emissions and related carbon data. As a result, the region is becoming a major expansion area for platforms that can scale supplier onboarding while still maintaining documentation strong enough to meet global customer requirements.
- EcoVadis SAS
- IntegrityNext GmbH
- Worldfavor AB
- Greenly SAS
- SAP SE
- IBM Corporation
- Siemens AG
- Schneider Electric SE
- Persefoni AI, Inc.
- Watershed Technology, Inc.
- Sphera Solutions, Inc.
- Ivalua Inc.
- Coupa Software Incorporated
- Jaggaer, LLC
- GEP Worldwide
- Oracle Corporation
- Basware Corporation
- Cority Software Inc.
- Sedex Holdings Limited
- Enablon SA
- Normative AB
- Plan A Earth GmbH
- Emitwise Ltd
- Climatiq GmbH
- Cozero GmbH
- CarbonChain Ltd
Additional Benefits:
- The market estimate (ME) sheet in Excel format
- 3 months of analyst support
TABLE OF CONTENTS
1 INTRODUCTION
- 1.1 Study Assumptions and Market Definition
- 1.2 Scope of the Study
2 RESEARCH METHODOLOGY
3 EXECUTIVE SUMMARY
4 MARKET LANDSCAPE
- 4.1 Market Overview
- 4.2 Market Drivers
- 4.2.1 Rising Scope 3 Disclosure Pressure from Enterprise Buyers
- 4.2.2 Procurement-Led Decarbonization Becomes a Budgeted Workflow
- 4.2.3 Supplier Data Digitization Improves Emissions Scoring Accuracy
- 4.2.4 Audit-Ready Carbon Data Reduces Reporting Friction
- 4.2.5 Carbon Scoring Becomes Embedded in Supplier Selection
- 4.2.6 AI-Assisted Supplier Intake Reduces Manual Follow-Up Cost
- 4.3 Market Restraints
- 4.3.1 Supplier Data Gaps Limit Score Reliability
- 4.3.2 Methodology Fragmentation Reduces Score Comparability
- 4.3.3 Integration Complexity With ERP and Procurement Suites
- 4.3.4 Buyer Fatigue from Overlapping ESG Questionnaires
- 4.4 Industry Value Chain Analysis
- 4.5 Impact of Macroeconomic Factors on the Market
- 4.6 Regulatory Landscape
- 4.7 Technological Outlook
- 4.8 Porter's Five Forces Analysis
- 4.8.1 Bargaining Power of Suppliers
- 4.8.2 Bargaining Power of Buyers
- 4.8.3 Threat of New Entrants
- 4.8.4 Threat of Substitutes
- 4.8.5 Competitive Rivalry
5 MARKET SIZE AND GROWTH FORECASTS (VALUE)
- 5.1 By Function
- 5.1.1 Supplier Carbon Data Collection
- 5.1.2 Supplier Carbon Scoring and Benchmarking
- 5.1.3 Supplier Engagement and Corrective Action Management
- 5.1.4 Carbon Reporting and Audit Trail Management
- 5.1.5 Other Functions
- 5.2 By Deployment
- 5.2.1 Cloud-Based
- 5.2.2 On-Premises
- 5.3 By Organization Size
- 5.3.1 Large Enterprises
- 5.3.2 Small and Medium Enterprises
- 5.4 By End-User Industry
- 5.4.1 Banking, Financial Services, and Insurance
- 5.4.2 Information Technology and Telecom
- 5.4.3 Healthcare and Life Sciences
- 5.4.4 Manufacturing
- 5.4.5 Retail and Consumer Goods
- 5.4.6 Automotive and Mobility
- 5.4.7 Energy and Utilities
- 5.4.8 Government and Public Sector
- 5.4.9 Other End-User Industries
- 5.5 By Geography
- 5.5.1 North America
- 5.5.1.1 United States
- 5.5.1.2 Canada
- 5.5.1.3 Mexico
- 5.5.2 South America
- 5.5.2.1 Brazil
- 5.5.2.2 Argentina
- 5.5.2.3 Rest of South America
- 5.5.3 Europe
- 5.5.3.1 Germany
- 5.5.3.2 United Kingdom
- 5.5.3.3 France
- 5.5.3.4 Italy
- 5.5.3.5 Spain
- 5.5.3.6 Russia
- 5.5.3.7 Rest of Europe
- 5.5.4 Asia-Pacific
- 5.5.4.1 China
- 5.5.4.2 India
- 5.5.4.3 Japan
- 5.5.4.4 South Korea
- 5.5.4.5 Australia
- 5.5.4.6 Rest of Asia-Pacific
- 5.5.5 Middle East
- 5.5.5.1 Saudi Arabia
- 5.5.5.2 United Arab Emirates
- 5.5.5.3 Turkey
- 5.5.5.4 Rest of Middle East
- 5.5.6 Africa
- 5.5.6.1 South Africa
- 5.5.6.2 Nigeria
- 5.5.6.3 Rest of Africa
- 5.5.1 North America
6 COMPETITIVE LANDSCAPE
- 6.1 Market Concentration
- 6.2 Strategic Moves
- 6.3 Market Share Analysis
- 6.4 Company Profiles (includes Global Level Overview, Market Level Overview, Core Segments, Financials as available, Strategic Information, Market Rank/Share, Products and Services, Recent Developments)
- 6.4.1 EcoVadis SAS
- 6.4.2 IntegrityNext GmbH
- 6.4.3 Worldfavor AB
- 6.4.4 Greenly SAS
- 6.4.5 SAP SE
- 6.4.6 IBM Corporation
- 6.4.7 Siemens AG
- 6.4.8 Schneider Electric SE
- 6.4.9 Persefoni AI, Inc.
- 6.4.10 Watershed Technology, Inc.
- 6.4.11 Sphera Solutions, Inc.
- 6.4.12 Ivalua Inc.
- 6.4.13 Coupa Software Incorporated
- 6.4.14 Jaggaer, LLC
- 6.4.15 GEP Worldwide
- 6.4.16 Oracle Corporation
- 6.4.17 Basware Corporation
- 6.4.18 Cority Software Inc.
- 6.4.19 Sedex Holdings Limited
- 6.4.20 Enablon SA
- 6.4.21 Normative AB
- 6.4.22 Plan A Earth GmbH
- 6.4.23 Emitwise Ltd
- 6.4.24 Climatiq GmbH
- 6.4.25 Cozero GmbH
- 6.4.26 CarbonChain Ltd
7 MARKET OPPORTUNITIES AND FUTURE OUTLOOK
- 7.1 White-Space and Unmet-Need Assessment


