
|
시장보고서
상품코드
2073170
그린 IT 소프트웨어 시장 : 점유율 분석, 업계 동향과 통계, 성장 예측(2026-2031년)Green IT Software - Market Share Analysis, Industry Trends & Statistics, Growth Forecasts (2026 - 2031) |
||||||
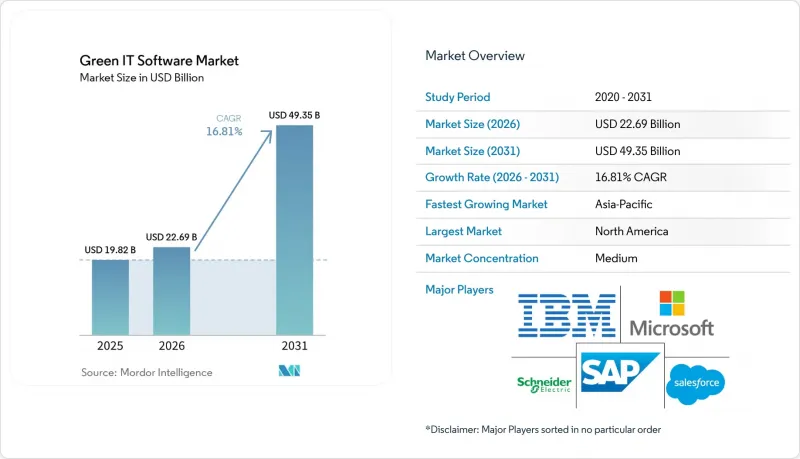
Mordor Intelligence에 의하면, 그린 IT 소프트웨어 시장 규모는 2025년 198억 2,000만 달러에서 2026년에는 226억 9,000만 달러로 확대되어 2031년까지 493억 5,000만 달러에 이를 것으로 예상되고 있어 2026년부터 2031년까지 CAGR 16.81%로 성장할 전망입니다.

본 보고서는 제공 형태(소프트웨어 및 서비스), 도입 형태(클라우드 기반, On-Premise형, 하이브리드형), 기업 규모(대기업 및 중소기업), 솔루션 유형(탄소 관리·산정 소프트웨어, ESG 보고·컴플라이언스 소프트웨어 등), 최종 사용자(IT 및 통신, BFSI 등), 지역별로 분류되어 있습니다. 시장 전망은 금액(달러) 기준으로 제시되어 있습니다.
세계 그린 IT 소프트웨어 시장 동향과 인사이트
감사 대응이 가능한 ESG 및 탄소 공시를 위한 규제 추진
그린 IT 소프트웨어 시장의 단기적인 최대 촉진요인은 자발적 공개에서 규제 기반 보고로의 전환입니다. EU의 CSRD 옴니버스 I 지침은 2026년 3월 18일에 발효되었으며, 보고 대상 기준이 직원 수 1,000명 이상이고 연간 순매출액이 4억 5,000만 유로(4억 8,690만 달러)를 초과하는 기업으로 상향 조정되었습니다. 개정된 프레임워크에서는 여전히 이중 중요도 평가, ESRS에 기반한 보고, 기계 판독 가능 형식의 제출 및 제한적 보증이 요구되고 있으므로, 기업들은 계속해서 완전하고 추적 가능한 데이터를 생성할 수 있는 시스템을 갖추어야 합니다. 캘리포니아주에서는 2026년 2월에 승인된 최초의 SB 253 규정에 따라, 해당 주에서 사업을 영위하며 기업 매출이 10억 달러를 초과하는 기업에 대해 스코프 1 및 스코프 2 보고 기한이 2026년 8월로 정해졌습니다. 이러한 기한은 지역 및 보고 단계별로 단계적으로 설정되어 있기 때문에 조달 활동은 한 번 정점을 찍은 후 곧바로 주춤해지기보다는 수년에 걸쳐 활발하게 지속될 것으로 보입니다. 이러한 추세로 인해 그린 IT 소프트웨어 시장에는 지속적인 수요 기반이 형성될 것입니다. 이는 소프트웨어 선정, 통합, 관리 체계 구축 및 보증 준비가 일반적으로 법정 제출 기한보다 훨씬 앞서 이루어지기 때문입니다.
확대되는 기업의 탄소중립 목표
기업들의 기후 변화 대응 노력은 여전히 그린 IT 소프트웨어의 잠재 시장을 확대시키고 있습니다. 과학 기반 목표 이니셔티브(SBTi)의 보고서에 따르면, 2025년에는 기업의 기후 목표 설정이 40% 증가했으며, 같은 해 말까지 1만 2,000개 이상의 기업이 목표 또는 공약에 대한 검증을 완료했습니다. 또한, SBTi는 2026년 4월에 “기업 탄소중립 기준 버전 2.0”을 발표했습니다. 이는 제시된 목표에 대한 진행 상황을 일관된 방식으로 추적하는 방법을 모색하는 더 규모가 크고 활발한 기업 그룹의 동향을 반영한 것입니다. 약속이 확대됨에 따라 기업에는 정기적인 재고 조사에서 지속적인 데이터 수집, 시나리오 계획 수립, 그리고 거버넌스에 부합하는 보고로 전환할 수 있는 소프트웨어가 필요합니다. 이러한 변화가 중요한 이유는 기록, 업무 흐름, 재현 가능한 계산을 통해 뒷받침되지 않는다면 목표 설정만으로는 이사회, 투자자, 규제 당국의 요구를 충족시킬 수 없기 때문입니다. 그 결과, 탄소 회계, 공시 관리 및 전반적인 계획 도구에 대한 수요가 확대되고 있으며, 이는 그린 IT 소프트웨어 시장을 단순한 규정 준수 사례라는 좁은 용도의 범위를 넘어 발전시키는 요인 중 하나가 되고 있습니다.
기존 IT 시스템과의 통합에 따른 높은 초기 비용
레거시 시스템은 그린 IT 소프트웨어 시장에 여전히 실질적인 걸림돌이 되고 있습니다. 특히, 기업이 구식 ERP, 자산 관리, 시설 관리 시스템을 운영하고 있는 경우에는 그 현상이 두드러집니다. Sciendo에서 발표한 제조업 분야의 ESG 소프트웨어 도입에 관한 조사에 따르면, 기업들은 도입 과정에서 발생하는 시스템 가동 중단 시간을 감당할 수 없었기 때문에 단계적인 도입이나 장기적인 도입 일정을 채택할 수밖에 없었던 것으로 밝혀졌습니다. 이 문제는 중요합니다. 이는 많은 배출량 관리 워크플로가 탄소 회계, 감사 추적 또는 통합 보고를 목적으로 구축되지 않은 시스템의 데이터에 의존하고 있기 때문입니다. 통합이 단계적으로 진행될 경우, 소프트웨어의 가치를 실감하기까지 시간이 오래 걸리기 때문에 사내 팀은 초기 모듈이 안정화된 것이 확인될 때까지 본격적인 배포를 미루는 경우가 많습니다. 이로 인해 수요가 높고 규정 준수 측면에서의 필요성도 명확한 경우에도, 구매자와 공급업체 양측의 총 부담이 증가하게 됩니다. 따라서 그린 IT 소프트웨어 시장은 수요의 문제라기보다는 시기의 문제에 직면해 있으며, 도입 의지는 있더라도 실제 구현에는 여러 예산 주기가 소요될 수 있습니다.
부문별 분석
2025년, 그린 IT 소프트웨어 시장에서 소프트웨어의 점유율은 76.14%를 차지했으며, 플랫폼 구독이 도입을 위한 주요 상업적 경로로 계속 자리 잡고 있는 것으로 확인되었습니다. 구매자가 이 소프트웨어를 선호하는 이유는 단일 환경 내에서 데이터 수집의 통합, 사용자 권한 관리, 보고서 로직 업데이트, 그리고 정기적인 규정 준수 주기 지원을 수행할 수 있기 때문입니다. 이러한 추세로 인해 그린 IT 소프트웨어 시장의 기반은 일회성 컨설팅 업무가 아닌 SaaS 및 엔터프라이즈 용도 모델과 견고하게 연결되어 있습니다. 또한, 이는 지속가능성 보고에서 일회성 연례 프로젝트가 아닌, 반복 가능한 워크플로가 필요하다는 사실도 반영하고 있습니다.
서비스 시장은 2031년까지 연평균 성장률(CAGR) 16.93%로 확대될 것으로 예측되며, 소프트웨어 판매에 따라 도입 및 지원 업무도 지속적으로 증가할 것으로 보입니다. 기업이 ERP 시스템, 에너지 기록, 공급업체 파일, 보고 체계에서 수집된 데이터를 단일 거버넌스가 확립된 프로세스로 통합해야 하는 경우, 해당 서비스에 대한 수요는 여전히 높은 수준을 유지하고 있습니다. 2026년 4월, IBM이 Excel용으로 “Envizi 배출량 계산”을 출시한 것은 각 벤더들이 수작업 워크플로우와 기업의 탄소 회계를 보다 체계적인 방식으로 연계하려고 하고 있음을 보여줍니다. 많은 고객이 여전히 단편적인 스프레드시트로 시작하여, 이후 더 대규모의 시스템 구축으로 넘어가고 있기 때문에 이러한 가교 역할은 중요합니다. 따라서 그린 IT 소프트웨어 업계에서는 소프트웨어가 주요 수익 기반이 되고 있는 반면, 규제의 복잡성으로 인해 도입, 전환, 변경 관리에 여전히 막대한 노력이 필요하기 때문에 서비스 부문도 계속해서 성장하고 있습니다.
2025년에는 클라우드 기반 도입이 매출의 64.17%를 차지하며, 그린 IT 소프트웨어 시장에서 가장 큰 비중을 차지하는 도입 모델이 되었습니다. 클라우드 시스템이 널리 활용되는 이유는 자회사 간에 확장성이 뛰어나고, 빈번한 보고서 업데이트에 대응할 수 있으며, 인프라에 가해지는 부담을 줄이면서 통합적인 거버넌스를 지원할 수 있기 때문입니다. 이 구성은 여러 사업 부서에서 데이터 세트가 제공되고, 지속적인 업데이트가 필요한 배출량 보고에 가장 적합합니다. 또한, 새로운 사내 환경을 구축하지 않고도 지역 간 관리 체제를 표준화하고자 하는 기업에게 보다 신속한 도입을 가능하게 합니다.
하이브리드 도입은 2031년까지 연평균 성장률(CAGR) 17.02%를 나타낼 것으로 예측되며, 그린 IT 소프트웨어 시장 규모 전망에서 도입 모델 중 가장 빠른 성장세를 보일 것으로 전망됩니다. 그 주된 이유는 일부 기업이 기밀성이 높은 기록을 On-Premise에서 보관하면서도, 집계나 제출에는 클라우드 분석을 활용해야 하기 때문입니다. 유럽연합 집행위원회의 CSRD 지침은 지배구조와 감사 가능한 공시에 대한 압력을 지속적으로 강화하고 있으며, 통제, 데이터 소재지, 유연성 간의 균형을 맞출 수 있는 아키텍처를 장려하고 있습니다. 하이브리드 구성은 정보 취급 요건이 엄격한 경향이 있는 은행, 의료, 국방 등의 분야에서 특히 중요합니다. 따라서 그린 IT 소프트웨어 업계에서는 규정 준수 및 데이터 관리가 소프트웨어 설계를 좌우하는 가운데, 클라우드가 여전히 가장 큰 점유율을 차지하는 한편, 하이브리드 솔루션의 점유율이 확대될 것으로 전망됩니다.
지역별 분석
2025년, 북미는 그린 IT 소프트웨어 시장 점유율의 38.12%를 차지하며, 지역별로는 가장 큰 기여도를 보였습니다. 이 지역은 기업용 소프트웨어의 구매자 기반이 광범위하고, 기업의 지속가능성 활동이 활발하며, 정보 공개에 대한 압박이 커지고 있는 점 등의 혜택을 누렸습니다. 캘리포니아주 SB 253 법안에 따른 초기 규제에서는 매출액 기준을 초과하는 기업에 대해 스코프 1 및 스코프 2 보고 기한을 2026년 8월로 정하고 있어, 대상 기업들의 대응이 시급해졌습니다. 또한, 미국에는 그린 IT 소프트웨어 시장에서 활약하는 주요 플랫폼 벤더와 전문 공급업체들이 다수 진출해 있으며, 이는 제품의 접근성, 서비스의 충실도, 그리고 사업 확장의 가속화를 뒷받침하고 있습니다.
유럽은 그린 IT 소프트웨어 시장에서 성숙 단계에 접어들었음에도 여전히 성장을 이어가고 있는 지역으로 남아 있습니다. 유럽연합 집행위원회는 CSRD(기업 지속가능성 보고 지침)의 시행이 단계적으로 진행되고 있으며, 선행 기업들은 이미 보고를 시작했고, 후속 그룹들은 개정된 프레임워크에 따른 연기된 의무 이행에 대비하고 있다고 밝혔습니다. 독일은 공급망 실사 요건과 탄소 공시에 대한 기대감으로 인해, 영향을 받는 기업들에게 더 까다로운 사업 환경이 조성되었다는 점에서 두드러졌습니다. 이러한 요인들이 복합적으로 작용하면서, 내부 보고와 공급업체 관련 정보를 모두 관리할 수 있는 소프트웨어에 대한 수요가 계속해서 집중되고 있습니다. 또한, 유럽에는 전문 서비스 제공업체들이 집중적으로 모여 있어, 그린 IT 소프트웨어 분야의 탄소 회계, 공시 준비, 공급망 데이터 관리 등 각 영역에서 활발한 경쟁이 이어지고 있습니다.
아시아태평양은 2031년까지 연평균 성장률(CAGR) 17.42%를 나타낼 것으로 예측되며, 그린 IT 소프트웨어 시장 전망에서 가장 빠르게 성장하는 지역이 될 것으로 보입니다. 이 지역은 보고 요건의 확대, 대규모 디지털 인프라 투자, 그리고 기업 간 기후 변화 대응 노력의 고조 등에 힘입어 성장하고 있습니다. SBTi의 보고서에 따르면, 2025년에는 아시아가 기업의 새로운 기후 변화 대책의 중요한 중심지가 되었다고 하며, 이는 수요가 가장 성숙한 유럽 및 미국 시장을 넘어 확대되고 있다는 관점을 뒷받침하는 것입니다. 남미, 중동 및 아프리카는 여전히 초기 단계 시장이지만, 정책적 움직임과 현대화 프로그램이 향후 그린 IT 소프트웨어 도입을 위한 기반을 마련해 나가고 있습니다.
기타 혜택:
- 엑셀 형식 시장 예측(ME) 시트
- 3개월간의 애널리스트 지원
자주 묻는 질문
목차
제1장 서론
제2장 조사 방법
제3장 주요 요약
제4장 시장 구도
제5장 시장 규모와 성장 예측
제6장 경쟁 구도
제7장 시장 기회와 향후 전망
JHSAccording to Mordor Intelligence, the green IT software market size is expected to increase from USD 19.82 billion in 2025 to USD 22.69 billion in 2026 and reach USD 49.35 billion by 2031, growing at a CAGR of 16.81% over 2026-2031.
This report is Segmented by Offering (Software, and Services), Deployment (Cloud-Based, On-Premise, and Hybrid), Enterprise Size (Large Enterprises, and Small and Medium Enterprises), Solution Type (Carbon Management and Accounting Software, ESG Reporting and Compliance Software, and More), End User (IT and Telecom, BFSI, and More), and Geography. The Market Forecasts are Provided in Terms of Value (USD).
Global Green IT Software Market Trends and Insights
Regulatory Push for Audit-Ready ESG and Carbon Disclosure
The strongest near-term driver of the green IT software market is the shift from voluntary disclosure to regulated reporting. The EU CSRD Omnibus I directive entered into force on March 18, 2026, and raised the reporting threshold to companies with more than 1,000 employees and more than EUR 450 million, or USD 486.9 million, in annual net turnover. The revised framework still requires double materiality assessments, ESRS-based reporting, machine-readable filing, and limited assurance, meaning companies still need systems that can produce complete, traceable data. In California, the initial SB 253 regulation approved in February 2026 set an August 2026 deadline for Scope 1 and Scope 2 reporting for companies with revenue above USD 1 billion operating in the state. These deadlines are staggered across regions and reporting waves, so procurement is likely to remain active over several years rather than peaking once and fading quickly. That pattern gives the green IT software market a durable demand base because software selection, integration, controls, and assurance preparation usually happen well before statutory filing dates.
Growing Corporate Net-Zero Targets
Corporate climate commitments are still expanding the addressable market for green IT software. The Science Based Targets initiative reported that corporate climate target-setting grew 40% in 2025, and more than 12,000 companies had validated targets or commitments by the end of that year. SBTi also released the Corporate Net-Zero Standard Version 2.0 in April 2026, reflecting a larger and more active group of companies seeking consistent ways to track progress against stated goals. As commitments expand, companies need software that can move from periodic inventories to continuous data collection, scenario planning, and governed reporting. This shift matters because target-setting alone does not satisfy boards, investors, or regulators unless records, workflows, and repeatable calculations back it. The result is a broader demand pull across carbon accounting, disclosure management, and planning tools, which is helping the green IT software market move beyond a narrow compliance use case.
High Upfront Integration Cost with Legacy IT Systems
Legacy estates remain a practical brake on the green IT software market, especially where companies run older ERP, asset, and facility systems. Research published in Sciendo on ESG software deployment in manufacturing found that companies could not absorb system downtime during implementation, which led them to adopt phased rollouts and longer deployment schedules. That problem is important because many emissions workflows depend on data from systems that were not built for carbon accounting, audit trails, or unified reporting. When integration is staged, software value is realized more slowly, and internal teams often delay broader rollouts until early modules prove stable. This raises total effort for both buyers and vendors, even when demand is strong, and the compliance case is clear. The green IT software market, therefore, faces a timing issue rather than a demand problem, where adoption is present but implementation can span several budget cycles.
Other drivers and restraints analyzed in the detailed report include:
- Rising Energy Costs Improving ROI on Green IT Software
- AI-Driven Real-Time IT Energy Optimization
- Sustainability-Oriented IT Talent Shortage
For complete list of drivers and restraints, kindly check the Table Of Contents.
Segment Analysis
Software held 76.14% of the green IT software market share in 2025, confirming that platform subscriptions remained the main commercial route to adoption. Buyers have favored software because it can centralize data collection, manage user permissions, update reporting logic, and support recurring compliance cycles within a single environment. This preference has kept the base of the green IT software market firmly tied to SaaS and enterprise application models rather than one-time consulting work. It also reflects the fact that sustainability reporting now needs repeatable workflows rather than standalone annual projects.
Services are projected to expand at a 16.93% CAGR through 2031, indicating that implementation and support work will continue to rise alongside software sales. The need for services remains high when companies must integrate data from ERP systems, energy records, supplier files, and reporting frameworks into a single, governed process. IBM's April 2026 launch of Envizi Emissions Calculations in Excel showed how vendors are trying to bridge manual workflows and enterprise carbon accounting in a more structured way. That kind of bridge matters because many customers still begin with fragmented spreadsheets and then move into larger system builds. The green IT software industry is therefore seeing software as the main revenue base, while services continue to grow because regulatory complexity still makes deployment, migration, and change management labor-intensive.
Cloud-based deployment accounted for 64.17% of revenue in 2025, which made it the largest deployment model in the green IT software market. Cloud systems are widely used because they can scale across subsidiaries, absorb frequent reporting updates, and support centralized governance with lower infrastructure effort. This setup is well-suited to emissions reporting, where datasets come from many business units and need continuous refresh. It also supports faster rollout for companies that want to standardize controls across regions without building new in-house environments.
Hybrid deployment is projected to grow at a 17.02% CAGR through 2031, the fastest pace among deployment models in the green IT software market size outlook. The main reason is that some companies need to keep sensitive records on-premise while still using cloud analytics for consolidation and filing. The European Commission's CSRD guidance continues to put pressure on governance and auditable disclosures, supporting architectures that can balance control, data residency, and flexibility. Hybrid setups are especially relevant in sectors such as banking, healthcare, and defense, where information-handling requirements can be stringent. The green IT software industry is therefore likely to keep cloud as the volume leader, while hybrid solutions gain share as compliance and data control shape software design.
Complete Report Scope:
- By offering
- Software
- Services
- By Deployment
- Cloud-Based
- On-Premise
- Hybrid
- By Enterprise Size
- Large Enterprises
- Small and Medium Enterprises
- By Solution Type
- Carbon Management and Accounting Software
- ESG Reporting and Compliance Software
- Sustainability Data Management Platforms
- Decarbonization Planning Software
- Energy and Resource Optimization Software
- By End User
- IT and Telecom
- BFSI
- Manufacturing
- Energy and Utilities
- Retail and E-Commerce
- Government
- Healthcare
- Construction and Infrastructure
- Other End-User Industries
- By Geography
- North America
- United States
- Canada
- Mexico
- South America
- Brazil
- Argentina
- Rest of South America
- Europe
- Germany
- United Kingdom
- France
- Italy
- Spain
- Russia
- Rest of Europe
- Asia-Pacific
- China
- India
- Japan
- South Korea
- Australia
- Rest of Asia-Pacific
- Middle East and Africa
- Middle East
- Saudi Arabia
- United Arab Emirates
- Rest of Middle East
- Africa
- South Africa
- Nigeria
- Rest of Africa
- Middle East
- North America
Geography Analysis
North America held 38.12% of the green IT software market share in 2025, which made it the largest regional contributor. The region benefited from a large base of enterprise software buyers, strong corporate sustainability activity, and growing disclosure pressure. California's SB 253 initial regulation set an August 2026 deadline for Scope 1 and Scope 2 reporting for companies above the revenue threshold, which added urgency for covered businesses. The United States also hosts many of the major platform vendors and specialist providers active in the green IT software market, which helps support product availability, service depth, and faster commercial scaling.
Europe remained a mature but still expanding part of the green IT software market. The European Commission stated that CSRD implementation moved through phased waves, with earlier entities already reporting and later groups preparing for deferred obligations under the revised framework. Germany stood out because supply chain due diligence requirements and carbon disclosure expectations created a more demanding operating environment for affected companies. This combination has kept demand focused on software that can manage both internal reporting and supplier-related information. Europe also supports a concentrated cluster of specialized providers, which keeps competition active across carbon accounting, disclosure preparation, and supply chain data management in the green IT software.
Asia-Pacific is projected to grow at a 17.42% CAGR through 2031, making it the fastest-growing region in the green IT software market outlook. The region is being supported by expanding reporting requirements, large digital infrastructure investments, and rising climate commitments among companies. SBTi reported that Asia became an important center of gravity for new corporate climate commitments during 2025, which supports the view that demand is widening beyond the most mature Western markets. South America, the Middle East, and Africa remained early-stage markets, but policy moves and modernization programs are still laying the groundwork for future adoption of green IT software.
- Microsoft Corporation
- IBM Corporation
- SAP SE
- Salesforce, Inc.
- Schneider Electric SE
- Accenture PLC
- Workiva Inc.
- Persefoni AI, Inc.
- Watershed Technology, Inc.
- Greenly SAS
- Plan A
- Sweep SAS
- Normative AB
- Sphera Solutions, Inc.
- Enablon SA
- Intelex Technologies ULC
- Cority Software Inc.
- Novisto Inc.
- Diligent Corporation
- Nasdaq, Inc.
- Benchmark Gensuite, Inc.
- Dakota Software Corporation
- Microsoft Cloud for Sustainability
- EcoVadis SAS
- Salesforce Net Zero Cloud
- Sustainability Strategy and Roadmap Services
Additional Benefits:
- The market estimate (ME) sheet in Excel format
- 3 months of analyst support
TABLE OF CONTENTS
1 INTRODUCTION
- 1.1 Study Assumptions and Market Definition
- 1.2 Scope of the Study
2 RESEARCH METHODOLOGY
3 EXECUTIVE SUMMARY
4 MARKET LANDSCAPE
- 4.1 Market Overview
- 4.2 Market Drivers
- 4.2.1 Growing Corporate Net-Zero Targets
- 4.2.2 Rising Energy Costs Improving ROI on Green IT Software
- 4.2.3 Regulatory Push for Audit-Ready ESG and Carbon Disclosure
- 4.2.4 AI-Driven Real-Time IT Energy Optimization
- 4.2.5 Scope 3 Data Readiness Demands Across Digital Supply Chains
- 4.2.6 EU Digital Product Passport Requirements
- 4.3 Market Restraints
- 4.3.1 High Upfront Integration Cost with Legacy IT Systems
- 4.3.2 Shortage of Sustainability-Oriented IT Talent
- 4.3.3 Fragmented Emissions Data Across Multi-Cloud Environments
- 4.3.4 Variable Data Quality from Metered and Unmetered Assets
- 4.4 Industry Value Chain Analysis
- 4.5 Regulatory Landscape
- 4.6 Technological Outlook
- 4.7 Impact of Macroeconomic Factors On The Market
- 4.8 Porter's Five Forces Analysis
- 4.8.1 Intensity of Competitive Rivalry
- 4.8.2 Bargaining Power of Suppliers
- 4.8.3 Bargaining Power of Buyers
- 4.8.4 Threat of New Entrants
- 4.8.5 Threat of Substitutes
5 MARKET SIZE AND GROWTH FORECASTS (VALUE)
- 5.1 By offering
- 5.1.1 Software
- 5.1.2 Services
- 5.2 By Deployment
- 5.2.1 Cloud-Based
- 5.2.2 On-Premise
- 5.2.3 Hybrid
- 5.3 By Enterprise Size
- 5.3.1 Large Enterprises
- 5.3.2 Small and Medium Enterprises
- 5.4 By Solution Type
- 5.4.1 Carbon Management and Accounting Software
- 5.4.2 ESG Reporting and Compliance Software
- 5.4.3 Sustainability Data Management Platforms
- 5.4.4 Decarbonization Planning Software
- 5.4.5 Energy and Resource Optimization Software
- 5.5 By End User
- 5.5.1 IT and Telecom
- 5.5.2 BFSI
- 5.5.3 Manufacturing
- 5.5.4 Energy and Utilities
- 5.5.5 Retail and E-Commerce
- 5.5.6 Government
- 5.5.7 Healthcare
- 5.5.8 Construction and Infrastructure
- 5.5.9 Other End-User Industries
- 5.6 By Geography
- 5.6.1 North America
- 5.6.1.1 United States
- 5.6.1.2 Canada
- 5.6.1.3 Mexico
- 5.6.2 South America
- 5.6.2.1 Brazil
- 5.6.2.2 Argentina
- 5.6.2.3 Rest of South America
- 5.6.3 Europe
- 5.6.3.1 Germany
- 5.6.3.2 United Kingdom
- 5.6.3.3 France
- 5.6.3.4 Italy
- 5.6.3.5 Spain
- 5.6.3.6 Russia
- 5.6.3.7 Rest of Europe
- 5.6.4 Asia-Pacific
- 5.6.4.1 China
- 5.6.4.2 India
- 5.6.4.3 Japan
- 5.6.4.4 South Korea
- 5.6.4.5 Australia
- 5.6.4.6 Rest of Asia-Pacific
- 5.6.5 Middle East and Africa
- 5.6.5.1 Middle East
- 5.6.5.1.1 Saudi Arabia
- 5.6.5.1.2 United Arab Emirates
- 5.6.5.1.3 Rest of Middle East
- 5.6.5.2 Africa
- 5.6.5.2.1 South Africa
- 5.6.5.2.2 Nigeria
- 5.6.5.2.3 Rest of Africa
- 5.6.5.1 Middle East
- 5.6.1 North America
6 COMPETITIVE LANDSCAPE
- 6.1 Market Concentration
- 6.2 Strategic Moves
- 6.3 Market Share Analysis
- 6.4 Company Profiles (includes Global Level Overview, Market Level Overview, Core Segments, Financials as available, Strategic Information, Market Rank/Share, Products and Services, Recent Developments)
- 6.4.1 Microsoft Corporation
- 6.4.2 IBM Corporation
- 6.4.3 SAP SE
- 6.4.4 Salesforce, Inc.
- 6.4.5 Schneider Electric SE
- 6.4.6 Accenture PLC
- 6.4.7 Workiva Inc.
- 6.4.8 Persefoni AI, Inc.
- 6.4.9 Watershed Technology, Inc.
- 6.4.10 Greenly SAS
- 6.4.11 Plan A
- 6.4.12 Sweep SAS
- 6.4.13 Normative AB
- 6.4.14 Sphera Solutions, Inc.
- 6.4.15 Enablon SA
- 6.4.16 Intelex Technologies ULC
- 6.4.17 Cority Software Inc.
- 6.4.18 Novisto Inc.
- 6.4.19 Diligent Corporation
- 6.4.20 Nasdaq, Inc.
- 6.4.21 Benchmark Gensuite, Inc.
- 6.4.22 Dakota Software Corporation
- 6.4.23 Microsoft Cloud for Sustainability
- 6.4.24 EcoVadis SAS
- 6.4.25 Salesforce Net Zero Cloud
- 6.4.26 Sustainability Strategy and Roadmap Services
7 MARKET OPPORTUNITIES and FUTURE OUTLOOK
- 7.1 White-space and Unmet-Need Assessment
(주말 및 공휴일 제외)
