
|
시장보고서
상품코드
2073193
방사선 진단 서비스 시장 : 점유율 분석, 업계 동향과 통계, 성장 예측(2026-2031년)Radiology Services - Market Share Analysis, Industry Trends & Statistics, Growth Forecasts (2026 - 2031) |
||||||
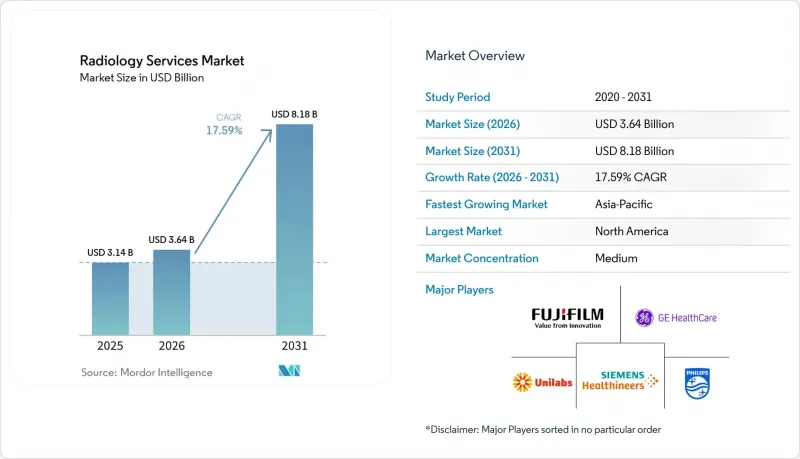
Mordor Intelligence에 의하면, 방사선 진단 서비스 시장 규모는 2025년에 31억 4,000만 달러로 평가되었고 2026년 36억 4,000만 달러에서 2031년까지 81억 8,000만 달러에 이를 것으로 예측되며, 예측 기간(2026-2031년) CAGR은 17.59%를 나타낼 전망입니다.
본 보고서는 모달리티(X선, CT, MRI, 초음파 등), 서비스 유형(진단 영상 등), 서비스 제공 환경(병원 내 영상 진단 등), 제공 모델(자사 소유·운영 네트워크 등), 용도(종양학 등), 최종 사용자(병원, 영상 진단센터, 기타), 지역(북미 등)별로 분류되어 있습니다. 시장 전망은 금액(달러) 기준으로 제시되어 있습니다.
세계 방사선 진단 서비스 시장 동향 및 인사이트
만성 질환으로 인한 부담 증가와 반복적인 영상 진단 수요
방사선 진단 서비스 시장은 장기간에 걸친 치료 기간 동안 반복적인 영상 진단이 필요한 환자층이 확대됨에 따라 혜택을 보고 있습니다. 암, 심혈관 질환, 신경퇴행성 질환의 경우, 진단, 치료 계획 수립, 치료 효과 모니터링, 경과 관찰의 각 단계에서 종종 여러 차례의 영상 검사가 필요합니다. 이러한 추세로 인해 환자 1인당 청구 가능한 영상 진단 횟수가 증가하며, 하나의 의뢰 경로를 통해 여러 가지 영상 모달리티를 제공할 수 있는 네트워크의 가치가 높아집니다. 또한, 의료 제공업체가 종양학이나 신경학 분야에서 높은 영상 판독 능력을 갖추고 있는 경우, 방사선 진단 서비스 시장은 더욱 큰 혜택을 받게 됩니다. 이러한 사례에서는 보다 정교한 영상 판독이 요구되는 경우가 많기 때문입니다. 이러한 수요 추세는 CT, MRI, PET, 핵의학 영상 검사를 통해 장기간에 걸쳐 환자를 동일한 네트워크 내에서 관리할 수 있는 다거점 운영 사업자에게 유리하게 작용합니다.
외래로 이동한 영상 진단 건수
또한, 영상 진단 건수가 병원의 진료과에서 비용이 더 저렴한 외래 진료 시설로 지속적으로 이동하고 있는 점도 방사선 진단 서비스 시장의 성장을 뒷받침하고 있습니다. 적절한 검사가 독립형 센터로 이전되면, 간접비를 절감하면서도 보다 유연한 예약 조정이 가능해지므로, 의료 제공업체와 보험사 양측 모두 혜택을 받게 됩니다. 병원 그룹은 단순히 그 검사 건수를 잃고 있는 것만은 아닙니다. 많은 병원 그룹이 의뢰 관계를 유지하기 위해 독자적인 외래 환자 네트워크를 구축하거나 인수하고 있기 때문입니다. 이로 인해 병원이 지원하는 센터가 독립 사업자와 보다 직접적인 경쟁 관계에 놓이게 되어, 지역 내 방사선 진단 서비스 시장의 경쟁 환경이 변화하고 있습니다. 다만, 이러한 전환 속도는 여전히 시장에 따라 다릅니다. 보험자 구성, 지역별 규제, 그리고 ‘필요성 증명서(CON)’ 규정이 새로운 검사 능력을 어느 정도 속도로 추가할 수 있는지에 영향을 미치기 때문입니다.
방사선과 전문의 및 기술자 부족
방사선 진단 서비스 시장은 수요를 완성된 판독 결과나 청구 가능한 검사로 얼마나 전환할 수 있는지를 제한하는 구조적인 인력 부족 문제에 계속해서 직면하고 있습니다. 『American Journal of Neuroradiology』지에 실린 2025년 연구에 따르면, 2014년부터 2023년까지의 채용 정보와 비교했을 때, 진단 방사선학 졸업생 예상 인원 수에서 10년 동안 누적 2만 1,645명의 부족이 발생할 것으로 보고되었습니다. 또한, 2026년에 발표된 또 다른 연구에 따르면, 미국의 방사선과 전문의 이직률이 2013년부터 2022년 사이에 5.3%에서 8.5%로 상승한 것으로 보고되었으며, 이는 업무 부담이 인력 유지에 어떤 영향을 미치고 있는지를 보여줍니다. 그 결과, 일부 성숙한 지역에서는 방사선과 서비스 시장의 성장 속도가 이용 가능한 전문의공급 속도를 앞지르고 있습니다. AI를 활용한 지원, 공동 판독 체계, 분산형 인력 배치 모델을 확대하고 있는 의료기관은 여전히 현지의 사내 팀에만 의존하고 있는 의료기관보다 더 유리한 입장에 있습니다.
부문별 분석
컴퓨터 단층촬영(CT)은 2026년부터 2031년까지 연평균 성장률(CAGR) 19.24%를 기록하며, 방사선 진단 서비스 시장에서 가장 빠르게 성장하고 있는 검사법입니다. 한편, X선 검사는 2025년 시장 점유율이 28.53%를 차지하며, 매출 기준으로는 여전히 주요 검사법으로서의 위상을 유지하고 있습니다. CT가 주목을 받고 있는 이유는 새로운 광자 계수형 및 스펙트럼 분석 시스템 덕분에 종양학, 뇌졸중, 심장 평가, 복잡한 신경학적 검사 등 폭넓은 분야에서 그 유용성이 확대되고 있기 때문입니다. GE 헬스케어는 2026년 3월에 "Photonova Spectra" FDA 승인을 획득했고 Philips는 2026년 초에 "Verida"FDA 승인을 획득했습니다. 이로 인해 차세대 CT 플랫폼의 상업적 성장세가 더욱 가속화되고 있습니다. 이러한 시스템은 1회 스캔당 임상적 가치를 높여, 급변하는 방사선 진단 서비스 시장의 도입 경로에서 CT의 역할을 강화하고 있습니다.
초음파 검사는 중재적 치료 시 실시간 안내를 지원하며, 현장 진료(point-of-care) 워크플로우에도 적합하기 때문에 방사선 진단 서비스 업계에서 여전히 중요한 위치를 차지하고 있습니다. 또한 MRI도 헬륨 공급에 대한 우려와 장비 도입 계획에 따른 장기적인 회복탄력성 요구에 대응해 나가면서 계속 발전하고 있습니다. 지멘스 헬스인이어스는 2025년에 "Magnetom Flow" FDA 승인을 획득했고 GE 헬스케어는 2026년 2월에 "SIGNA Sprint with Freelium"의 인가를 취득했습니다. 이 모든 것은 기존에 헬륨을 대량으로 소비하는 설계에 대한 의존도를 낮추기 위한 것입니다. 또한, 유방촬영술과 PET, CT도 암 및 신경학 진료 과정에서 더 큰 역할을 담당하게 되었으며, 긴급성이 높은 전문 분야의 의뢰 건수가 증가함에 따라 방사선 진단 서비스 시장에서 모달리티 조합의 다양화가 촉진되고 있습니다.
2025년 기준으로 진단 영상 서비스는 방사선 의학 서비스 시장 규모의 37.38%를 차지했으나, 중재적 방사선 의학은 2031년까지 연평균 성장률(CAGR) 22.82%로 성장할 것으로 전망됩니다. 진단 영상이 공유 순위 상위를 차지하고 있는 것은 응급 평가부터 만성 질환 모니터링에 이르기까지 거의 모든 일상적 및 고도의 임상 워크플로우에서 중요한 역할을 하고 있음을 반영합니다. 중재적 방사선 의학의 성장이 더욱 두드러지는 이유는 더 많은 시술이 외과 수술 환경에서 영상 유도실로 옮겨가고 있으며, 그곳에서 의료진은 침습성이 낮고 회복 기간도 짧은 치료를 제공할 수 있기 때문입니다. 이로 인해 단순한 일상적인 촬영 건수뿐만 아니라, 고부가가치의 처치 기반 업무의 기여도가 높아지면서 방사선 서비스 시장의 수익 구성이 변화하고 있습니다.
CMS는 2026년 메디케어 의사 보수 일정에 있어, 영상 진단 각 부문이 삭감 대상이 되는 반면, 중재적 방사선과에 2%의 인상분을 배정함으로써 이러한 변화를 뒷받침했습니다. 이 보상 방침은 소개 환자층이 두텁고 의사를 확보할 수 있는 경우, 의료기관이 중재적 진료 체제를 확충하도록 장려하기 위한 것입니다. 방사선종양학 지원 서비스는 여전히 규모가 작지만, 영상 진단, 표적 치료 계획 및 정밀 치료 워크플로우 간의 긴밀한 협력을 통해 혜택을 받고 있습니다. 방사선 의학 서비스 업계에서 인증을 받은 검사실을 보유하고, 세부 전문 분야 의사를 확보하며, 다중 모달리티 연계 체계를 갖추고 있는 사업자는 시술 능력이 제한적인 일반적인 영상 진단 제공업체보다 이러한 변화를 포착할 가능성이 높다고 할 수 있습니다.
지역별 분석
2025년, 북미는 방사선 진단 서비스 시장 점유율의 38.63%를 차지하며, 계속해서 최대 지역 기여자로서의 위상을 유지했습니다. 이 지역은 높은 영상 검사 실시 빈도, 잘 갖춰진 보험 급여 인프라, 그리고 첨단 장비의 풍부한 도입 실적을 통해 혜택을 누리고 있습니다. 또한, 미국의 방사선 진단 서비스 시장에서는 전국 규모의 사업자들이 인수, 합작 투자, 디지털 헬스 분야 투자를 통해 사업 확대를 모색하는 가운데, 업계 재편이 더욱 가속화되고 있습니다. RadNet의 2026년 전망에 따르면, 영상진단센터의 매출이 17%에서 19% 성장하고, 디지털 헬스 분야의 매출이 46%에서 56% 성장할 것으로 예측되며, 이는 주요 사업자들이 핵심 사업인 스캔 서비스를 넘어 비즈니스 모델을 확대하고 있음을 보여줍니다. 2026년부터 메디케어 어드밴티지에 대한 사전 승인 응답 시간을 단축하도록 의무화하는 CMS의 규정 또한 북미 방사선 진단 서비스 시장의 일부에서 영상 진단 지연을 줄이고 처리 능력을 향상시킬 가능성이 있습니다.
유럽은 영상 진단 수요가 높은 반면, 국가마다 보험 급여 제도가 크게 다르기 때문에 방사선 진단 서비스 시장에서 여전히 전략적으로 중요한 위치를 차지하고 있습니다. 프랑스에서는 2024년에 영상 진단 가격이 1.0% 하락했음에도 불구하고, 영상 진단 지출이 7.0% 증가한 것으로 보고되었으며, 이는 수익 유지를 위해 규모와 가동률이 얼마나 중요한지를 여실히 보여주고 있습니다. 독일은 여전히 유럽 시장의 깊이를 뒷받침하고 있지만, 범유럽 그룹은 성숙한 시장에서의 최적화와 시장 침투율이 낮은 시장으로의 선택적 확장을 계속해서 조화롭게 병행하고 있습니다. 또한, 유럽의 방사선 진단 서비스 시장은 데이터 및 상호 운용성과 관련하여 더욱 엄격한 의무를 직면하고 있으며, 이로 인해 규정 준수 비용은 증가하겠지만, 조기에 적응한 사업자의 경우 장기적으로 플랫폼의 품질을 강화할 가능성이 있습니다.
아시아태평양은 2026년부터 2031년까지 연평균 성장률(CAGR) 20.38%를 기록하며, 방사선 진단 서비스 시장에서 가장 빠르게 성장하고 있는 지역입니다. 이러한 성장은 의료 인프라에 대한 투자, 만성 질환 유병률 증가, 그리고 일부 국가에서 지속되고 있는 방사선과 전문의 부족에 힘입은 것입니다. 이러한 상황으로 인해 아시아태평양의 선진국과 신흥국을 막론하고 원격 방사선 진단 및 디지털 워크플로우 도구가 특히 중요하게 여겨지고 있습니다. 중국에서는 병원과 외딴 지역에 있는 방사선과 의사 간의 클라우드 기반 영상 공유를 개선하기 위한 디지털 방사선 의학 인프라에 대한 투자가 진행되고 있습니다. 중동 및 아프리카 시장 규모는 여전히 작은 편이지만, 걸프 지역 국가들에서는 고성능 기기에 대한 수요가 시장을 지탱하고 있는 반면, MRI를 많이 사용하는 의료 기관들은 헬륨 공급 변동 위험에 지속적으로 노출되어 있습니다. 남미에서는 선택적 성장 가능성이 전망되고 있으며, 브라질에서는 민간 진단센터 네트워크와 중산층의 이용 확대를 통해 계속해서 지역 수요의 대부분을 차지하고 있습니다.
기타 혜택:
- 엑셀 형식 시장 예측(ME) 시트
- 3개월간의 애널리스트 지원
자주 묻는 질문
목차
제1장 서론
제2장 조사 방법
제3장 주요 요약
제4장 시장 구도
제5장 시장 규모와 성장 예측
제6장 경쟁 구도
제7장 시장 기회와 향후 전망
JHSAccording to Mordor Intelligence, the radiology services market size was valued at USD 3.14 billion in 2025 and is estimated to grow from USD 3.64 billion in 2026 to reach USD 8.18 billion by 2031, at a CAGR of 17.59% during the forecast period (2026-2031).

This report is Segmented by Modality (X-Ray, CT, MRI, Ultrasound, and More), Service Type (Diagnostic Imaging, and More), Service Setting (Hospital-Based Imaging, and More), Delivery Model (Owned and Operated Networks, and More), Application (Oncology, and More), End User (Hospitals, Imaging Centers, Others), and Geography (North America, and More). The Market Forecasts are Provided in Terms of Value (USD).
Global Radiology Services Market Trends and Insights
Rising Chronic Disease Burden and Repeat Imaging Demand
The radiology services market is benefiting from a larger pool of patients who need repeated imaging over long periods of care. Cancer, cardiovascular disease, and neurodegenerative disorders often require several scans across diagnosis, treatment planning, response monitoring, and follow-up. That pattern increases the number of billable imaging episodes generated by each patient and raises the value of networks that can provide multiple modalities in one referral pathway. The radiology services market also gains when providers have subspecialty reading depth in oncology and neurology because those cases often require higher-acuity interpretation. This demand pattern favors multi-site operators that can keep patients inside the same network across CT, MRI, PET, and nuclear imaging over time.
Outpatient Shift of Imaging Volumes
The radiology services market is also being lifted by the continued movement of imaging volume away from hospital departments and into lower-cost outpatient settings. Providers and payers both benefit when appropriate studies move into freestanding centers because the service can be delivered with lower overhead and better scheduling flexibility. Hospital systems are not simply losing that volume, because many are building or buying their own outpatient networks to keep referral relationships intact. This is changing local competition in the radiology services market by placing hospital-backed centers in more direct competition with independent operators. The pace of this shift still varies by market because payer mix, local regulation, and certificate-of-need rules affect how quickly new capacity can be added.
Radiologist and Technologist Shortages
The radiology services market continues to face a structural staffing gap that limits how much demand can be converted into finished reads and billed procedures. A 2025 study in the American Journal of Neuroradiology documented a cumulative 10-year deficit of 21,645 anticipated diagnostic radiology graduates relative to job listings between 2014 and 2023. A separate 2026 study reported that radiologist turnover in the United States rose from 5.3% to 8.5% between 2013 and 2022, which shows how workload pressure is affecting retention. The radiology services market is therefore growing faster than the available specialist pool in several mature regions. Providers that expand AI support, shared reading pools, and distributed staffing models are better positioned than operators that still rely only on local in-house teams.
Other drivers and restraints analyzed in the detailed report include:
- AI-Assisted Workflow Compression in Reading and Triage
- Expansion of Teleradiology Coverage Across Underserved Facilities
- Reimbursement Compression in Advanced Imaging
For complete list of drivers and restraints, kindly check the Table Of Contents.
Segment Analysis
Computed tomography is the fastest-growing modality in the radiology services market at 19.24% CAGR from 2026 to 2031, while X-ray remained the leading modality by revenue with market share of 28.53% in 2025. CT is gaining ground because new photon-counting and spectral systems are widening its usefulness across oncology, stroke, cardiac assessment, and complex neurological workups. GE HealthCare received FDA clearance for Photonova Spectra in March 2026, while Philips received FDA clearance for Verida in early 2026, which reinforces commercial momentum behind next-generation CT platforms. These systems support higher clinical value per scan and strengthen the role of CT in fast-moving radiology services market referral pathways.
Ultrasound remains important in the radiology services industry because it supports real-time guidance in interventional settings and fits well with point-of-care workflows. MRI is also evolving as operators respond to helium supply concerns and long-term resilience needs in fleet planning. Siemens Healthineers received FDA clearance in 2025 for Magnetom Flow, and GE HealthCare received clearance in February 2026 for SIGNA Sprint with Freelium, both of which reduce dependence on traditional helium-intensive designs. Mammography and PET or CT are also gaining a larger role in cancer and neurology pathways, which supports a broader modality mix within the radiology services market as referral intensity rises in higher-acuity specialties.
Diagnostic imaging services accounted for 37.38% of the radiology services market size in 2025, while interventional radiology is projected to grow at 22.82% CAGR through 2031. The share leadership of diagnostic imaging reflects its role across almost every routine and advanced clinical workflow, from emergency evaluation to chronic disease monitoring. Growth is stronger in interventional radiology because more procedures are moving from surgical settings into image-guided suites, where providers can offer less invasive care with shorter recovery times. This changes the revenue mix in the radiology services market by increasing the contribution of higher-value, procedure-based work rather than routine scan volumes alone.
CMS reinforced that shift by assigning interventional radiology a positive 2% impact in the 2026 Medicare Physician Fee Schedule while diagnostic imaging categories faced cuts. That payment signal encourages providers to add interventional capacity where referral depth and physician availability can support it. Radiation oncology support services remain smaller in scale, but they are benefiting from closer integration between imaging, targeted therapy planning, and precision treatment workflows. In the radiology services industry, operators with accredited suites, subspecialty physicians, and multi-modality coordination are more likely to capture that shift than general imaging providers with limited procedural capability.
Complete Report Scope:
- By Modality
- X-Ray
- Computed Tomography
- Magnetic Resonance Imaging
- Ultrasound
- Nuclear Imaging
- Mammography
- Positron Emission Tomography
- Other Modalities
- By Service Type
- Diagnostic Imaging
- Interventional Radiology
- Radiation Oncology Support Services
- By Service Setting
- Hospital-Based Imaging
- Freestanding Imaging Centers
- Community Diagnostic Centers
- Mobile Imaging Units
- By Delivery Model
- Owned and Operated Networks
- Teleradiology-Enabled Networks
- Hospital Joint Ventures
- Managed Services and Outsourcing
- By Application
- Oncology
- Neurology and Spine
- Cardiology
- Orthopedics and Musculoskeletal
- Chest and Pulmonary Imaging
- Women's Health and Obstetrics
- General Imaging
- By End User
- Hospitals
- Diagnostic Imaging Centers
- Ambulatory Centers
- Clinics
- Research and Academic Institutions
- By Geography
- North America
- United States
- Canada
- Mexico
- Europe
- Germany
- United Kingdom
- France
- Italy
- Spain
- Rest of Europe
- Asia-Pacific
- China
- Japan
- India
- Australia
- South Korea
- Rest of Asia-Pacific
- Middle East & Africa
- GCC
- South Africa
- Rest of Middle East & Africa
- South America
- Brazil
- Argentina
- Rest of South America
- North America
Geography Analysis
North America accounted for 38.63% of the radiology services market share in 2025, which kept it as the largest regional contributor. The region benefits from high imaging procedure density, deep reimbursement infrastructure, and a large installed base of advanced equipment. The radiology services market in the United States is also seeing more consolidation as national operators expand through acquisitions, joint ventures, and digital health investments. RadNet's 2026 guidance pointed to 17% to 19% imaging center revenue growth and 46% to 56% digital health revenue growth, which shows how large operators are broadening their business models beyond core scanning services. CMS rules that require faster prior authorization response times for Medicare Advantage from 2026 may also reduce imaging delays and improve throughput in parts of the North American radiology services market.
Europe remains strategically important in the radiology services market because imaging demand is high, but reimbursement systems vary widely across countries. France reported 7.0% growth in imaging expenditure in 2024, even as imaging prices declined 1.0%, which highlights the importance of scale and utilization in maintaining revenue. Germany still anchors market depth in Europe, while pan-European groups continue to balance mature-market optimization with selective expansion into underpenetrated markets. The radiology services market in Europe also faces heavier data and interoperability obligations, which raise compliance costs but can strengthen long-term platform quality for operators that adapt early.
Asia-Pacific is the fastest-growing region in the radiology services market at 20.38% CAGR from 2026 to 2031. Growth is being supported by healthcare infrastructure spending, rising chronic disease incidence, and a continuing shortage of radiologists in several countries. Those conditions make teleradiology and digital workflow tools especially relevant across both developed and emerging Asia-Pacific systems. China is drawing investment into digital radiology infrastructure that improves cloud-based image sharing between hospitals and off-site radiologists. The Middle East and Africa remain smaller in scale, but Gulf markets are supporting premium equipment demand while MRI-heavy providers remain exposed to helium supply volatility. South America offers selective growth potential, with Brazil continuing to account for the largest part of regional demand through private diagnostic center networks and growing middle-income utilization.
- Affidea Group
- Akumin Inc.
- Alliance Medical Group
- Everlight Radiology
- FUJIFILM
- GE HealthCare Technologies Inc.
- HCA Healthcare, Inc.
- I-MED Radiology Network
- Koninklijke Philips
- Mednax, Inc.
- ONRAD
- RadNet, Inc.
- Radiology Partners, Inc.
- Ramsay Health Care Limited
- RAYUS Radiology
- Siemens Healthineers
- SimonMed Imaging
- Sonic Healthcare
- Unilabs
Additional Benefits:
- The market estimate (ME) sheet in Excel format
- 3 months of analyst support
TABLE OF CONTENTS
1 Introduction
- 1.1 Study Assumptions & Market Definition
- 1.2 Scope of the Study
2 Research Methodology
3 Executive Summary
4 Market Landscape
- 4.1 Market Overview
- 4.2 Market Drivers
- 4.2.1 Rising Chronic Disease Burden and Repeat Imaging Demand
- 4.2.2 Outpatient Shift of Imaging Volumes
- 4.2.3 AI-Assisted Workflow Compression in Reading and Triage
- 4.2.4 Expansion of Teleradiology Coverage Across Underserved Facilities
- 4.2.5 Prior Authorization Friction Redirecting Volume to Networked Providers
- 4.2.6 Helium and Contrast Supply Resilience Becoming a Service Differentiator
- 4.3 Market Restraints
- 4.3.1 Radiologist and Technologist Shortages
- 4.3.2 Reimbursement Compression in Advanced Imaging
- 4.3.3 High CAPEX and Replacement Cycle Dependency
- 4.3.4 Data Privacy and Interoperability Burden Across Distributed Networks
- 4.4 Value / Supply-Chain Analysis
- 4.5 Regulatory Landscape
- 4.6 Technological Outlook
- 4.7 Porter's Five Forces Analysis
- 4.7.1 Threat of New Entrants
- 4.7.2 Bargaining Power of Suppliers
- 4.7.3 Bargaining Power of Buyers
- 4.7.4 Threat of Substitutes
- 4.7.5 Industry Rivalry
5 Market Size & Growth Forecasts
- 5.1 By Modality
- 5.1.1 X-Ray
- 5.1.2 Computed Tomography
- 5.1.3 Magnetic Resonance Imaging
- 5.1.4 Ultrasound
- 5.1.5 Nuclear Imaging
- 5.1.6 Mammography
- 5.1.7 Positron Emission Tomography
- 5.1.8 Other Modalities
- 5.2 By Service Type
- 5.2.1 Diagnostic Imaging
- 5.2.2 Interventional Radiology
- 5.2.3 Radiation Oncology Support Services
- 5.3 By Service Setting
- 5.3.1 Hospital-Based Imaging
- 5.3.2 Freestanding Imaging Centers
- 5.3.3 Community Diagnostic Centers
- 5.3.4 Mobile Imaging Units
- 5.4 By Delivery Model
- 5.4.1 Owned and Operated Networks
- 5.4.2 Teleradiology-Enabled Networks
- 5.4.3 Hospital Joint Ventures
- 5.4.4 Managed Services and Outsourcing
- 5.5 By Application
- 5.5.1 Oncology
- 5.5.2 Neurology and Spine
- 5.5.3 Cardiology
- 5.5.4 Orthopedics and Musculoskeletal
- 5.5.5 Chest and Pulmonary Imaging
- 5.5.6 Women's Health and Obstetrics
- 5.5.7 General Imaging
- 5.6 By End User
- 5.6.1 Hospitals
- 5.6.2 Diagnostic Imaging Centers
- 5.6.3 Ambulatory Centers
- 5.6.4 Clinics
- 5.6.5 Research and Academic Institutions
- 5.7 By Geography
- 5.7.1 North America
- 5.7.1.1 United States
- 5.7.1.2 Canada
- 5.7.1.3 Mexico
- 5.7.2 Europe
- 5.7.2.1 Germany
- 5.7.2.2 United Kingdom
- 5.7.2.3 France
- 5.7.2.4 Italy
- 5.7.2.5 Spain
- 5.7.2.6 Rest of Europe
- 5.7.3 Asia-Pacific
- 5.7.3.1 China
- 5.7.3.2 Japan
- 5.7.3.3 India
- 5.7.3.4 Australia
- 5.7.3.5 South Korea
- 5.7.3.6 Rest of Asia-Pacific
- 5.7.4 Middle East & Africa
- 5.7.4.1 GCC
- 5.7.4.2 South Africa
- 5.7.4.3 Rest of Middle East & Africa
- 5.7.5 South America
- 5.7.5.1 Brazil
- 5.7.5.2 Argentina
- 5.7.5.3 Rest of South America
- 5.7.1 North America
6 Competitive Landscape
- 6.1 Market Concentration
- 6.2 Market Share Analysis
- 6.3 Company Profiles (includes Global Level Overview, Market-level Overview, Core Segments, Financials, Strategic Information, Market Rank/Share, Products & Services, Recent Developments)
- 6.3.1 Affidea Group
- 6.3.2 Akumin Inc.
- 6.3.3 Alliance Medical Group
- 6.3.4 Everlight Radiology
- 6.3.5 Fujifilm Holdings Corporation
- 6.3.6 GE HealthCare Technologies Inc.
- 6.3.7 HCA Healthcare, Inc.
- 6.3.8 I-MED Radiology Network
- 6.3.9 Koninklijke Philips N.V.
- 6.3.10 Mednax, Inc.
- 6.3.11 ONRAD, Inc.
- 6.3.12 RadNet, Inc.
- 6.3.13 Radiology Partners, Inc.
- 6.3.14 Ramsay Health Care Limited
- 6.3.15 RAYUS Radiology
- 6.3.16 Siemens Healthineers AG
- 6.3.17 SimonMed Imaging
- 6.3.18 Sonic Healthcare Limited
- 6.3.19 Unilabs
7 Market Opportunities & Future Outlook
- 7.1 White-space & Unmet-need Assessment
