

|
시장보고서
상품코드
2073228
온라인 의류 시장 : 점유율 분석, 업계 동향과 통계, 성장 예측(2026-2031년)Online Apparel - Market Share Analysis, Industry Trends & Statistics, Growth Forecasts (2026 - 2031) |
||||||
 Mordor Intelligence
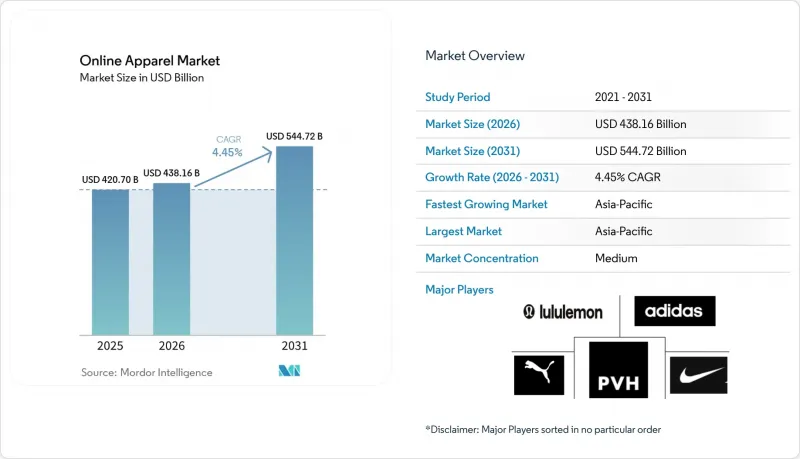
Mordor Intelligence에 의하면, 온라인 의류 시장 규모는 2025년 4,207억 달러, 2026년 4,382억 달러에서 2031년까지 5,447억 달러로 확대한다고 예측되고 있어 2026년부터 2031년까지 연평균 복합 성장률(CAGR)은 4.5%를 나타낼 전망입니다.
본 보고서는 제품 유형(정장, 캐주얼 의류, 스포츠웨어 등), 최종 사용자(남성, 여성 등), 원단 소재(면, 폴리에스터 등), 카테고리(대중 시장 및 프리미엄), 유통 채널(제3자 소매 플랫폼 및 자사 운영 플랫폼), 지역(북미, 유럽, 아시아태평양 등)별로 분류되어 있습니다. 시장 전망은 금액(달러) 기준으로 제시되어 있습니다.
세계 온라인 의류 시장 동향과 인사이트
소셜 미디어가 패션 트렌드에 미치는 영향력의 확대
현재 소셜 플랫폼은 온라인 의류 시장에서 소비자가 의류를 찾고, 코디를 비교하며, 구매를 완료하는 방식의 상당 부분을 차지하고 있습니다. 이러한 변화가 중요한 이유는 쇼핑객이 여러 사이트를 오갈 필요 없이 동일한 채널에서 영감을 얻고, 추천 상품을 확인하며, 결제까지 한 번에 완료할 수 있게 되었기 때문입니다. 이로 인해 구매 주기가 단축되면서, 경쟁이 치열한 패션 분야에서 신속한 인지도 제고가 요구되는 브랜드에게 있어 크리에이터와의 제휴가 더욱 중요해지고 있습니다. 또한, 시장 동향의 주기가 빨라지면서 온라인 의류 시장의 계절별 계획 수립에 할애할 수 있는 시간이 줄어들고 있어, 머천다이징 팀에도 부담이 가중되고 있습니다. 유연한 조달 체계와 신속한 컨텐츠 업데이트 속도를 갖춘 브랜드는 높아지는 관심을 전환율로 이어가는 데 유리한 입장에 있습니다. 반면, 여전히 지연되기 쉬운 계획 일정에 의존하고 있는 브랜드는 소셜 미디어 주도 수요가 며칠 단위로 변화하는 상황에서 명백히 불리한 입장에 놓여 있습니다.
모바일 상거래와 쇼핑 앱의 확대
현재 온라인 의류 시장에서 상품 열람 및 구매 행위의 중심은 모바일 기기로 옮겨가고 있으며, 특히 젊은 층의 소비자들은 브랜드 앱, 마켓플레이스 앱, 숏폼 동영상 피드에서 더 많은 시간을 보내고 있습니다. 이러한 변화로 인해, 구매 과정의 번거로움을 줄이고, 결제 정보를 저장하며, 푸시 알림이나 맞춤형 피드를 통해 지속적으로 상품 탐색을 유도하는 인터페이스가 유리해집니다. 또한, 앱의 재방문율의 중요성도 커지고 있습니다. 왜냐하면, 성공적인 플랫폼이란 검색 결과 상위에 노출되는 것보다 고객의 홈 화면에 지속적으로 자리 잡는 것이기 때문입니다. 일본은 이러한 변화를 여실히 보여주고 있으며, 2024년 의류 전자상거래 보급률은 23.38%에 달하고, 2019년 수준의 거의 2배가 되었습니다. 이러한 추세는 사용자의 소비 습관이 앱 중심의 구매로 전환됨에 따라, 디지털 시장이 성숙한 국가들에서도 온라인 보급률을 더욱 높일 여지가 있음을 보여줍니다. 온라인 의류 시장에서 모바일 참여도를 높이는 것은 브랜드가 신속한 신상품 출시, 동적 가격 책정, 더욱 정밀한 상품 추천을 시범적으로 도입하는 데에도 도움이 됩니다.
위조 의류 제품이 소비자의 신뢰를 훼손합니다.
위조품과의 접촉은 온라인 의류 시장의 신뢰를 계속해서 약화시키고 있습니다. 왜냐하면, 소비자들은 정품 브랜드가 수요를 창출하려고 노력하는 것과 동일한 디지털 환경에서 위조품을 발견하는 경우가 많기 때문입니다. 미국 의류 및 신발 협회(American Apparel & Footwear Association)가 2025년에 주최한 위조품에 초점을 맞춘 세션에서 위조품을 구매한 사람의 61%가 의도치 않게 구매한 것으로 나타났으며, 이러한 의도치 않은 구매의 52%가 위조 패션 아이템인 것으로 밝혀졌습니다. 퓨 리서치 센터의 조사 결과, 미국 성인의 17%가 온라인에서 위조품을 구매했음에도 불구하고 환불을 받지 못했으며, 85%가 온라인 쇼핑 사기를 심각한 문제로 인식하고 있는 것으로 나타났습니다. 그 피해는 단 한 건의 주문에 그치지 않습니다. 위조품으로 인한 불쾌한 경험은 재구매율을 떨어뜨리고, 온라인 의류 시장 전체에 대한 신뢰를 훼손할 가능성이 있기 때문입니다. 유럽연합 지적재산청도 전 세계 위조품 거래 흐름에서 의류가 가장 빈번하게 압수되는 위조품 범주 중 하나라고 밝혔습니다. 판매자 인증, 모니터링, 신속한 상품 하단에 막대한 투자를 하는 브랜드나 플랫폼은 전환율과 재구매율을 보다 효과적으로 보호할 수 있을 것입니다.
부문별 분석
2025년, 캐주얼 의류는 온라인 의류 시장 점유율의 38.06%를 차지하며, 현재 매출액 측면에서 다른 모든 상품군을 확실히 앞질렀습니다. 이 리드는 그 폭넓은 활용 사례에서 비롯된 것입니다. 캐주얼 의류는 재택근무, 하이브리드 생활 방식, 여행, 일상복 등 특별한 옷차림이 필요 없이 폭넓게 활용할 수 있기 때문입니다. 또한, SKU의 품목 구성이 풍부하고 재고 보충 빈도가 높아, 많은 단골 고객들에게 구매 장벽이 낮다는 점도 강점으로 꼽힙니다. 온라인 의류 시장에서 캐주얼 의류는 검색, 필터링, 추천 도구와 특히 잘 어울립니다. 이는 소비자들이 격식 있는 자리가 아닌 곳에서 스타일, 가격, 색상 등을 기준으로 상품을 둘러보는 경우가 많기 때문입니다. 이 부문의 규모가 크기 때문에 패션 유행이 급격하게 변하는 경우에도 총매출액에 안정화 효과를 가져다주고 있습니다.
스포츠웨어 시장은 2026년부터 2031년까지 연평균 성장률(CAGR) 6.35%를 나타낼 것으로 예측되며, 이는 온라인 의류 시장 전체의 성장 속도를 상회하는 수치입니다. 이러한 높은 성장률은 퍼포먼스웨어와 일상복의 경계가 점차 모호해지고 있는 데 힘입은 것으로, 이로 인해 이 카테고리는 헬스장이나 운동 이외의 상황에서도 수요를 유지하고 있습니다. 또한 Mordor Intelligence는 스포츠 의류 시장 전체가 2031년까지 강력한 성장세를 이어갈 것으로 전망하며, 특히 ‘디지털 퍼스트’ 소비자층 사이에서 온라인 채널이 눈부신 성장세를 보이고 있다고 지적하고 있습니다. 정장은 행사 중심 수요가 비교적 드물고, 핏에 대한 요구가 높은 경향이 있어 회복 속도가 완만합니다. 나이트웨어, 라운지웨어, 이너웨어는 재구매를 촉진하고 디지털 판매에서 표준화가 비교적 용이하기 때문에 계속해서 중요한 위치를 차지하고 있습니다. 온라인 의류 시장 전반에서 캐주얼, 스포츠, 그리고 재구매 수요 중심의 상품을 균형 있게 구비하고 있는 브랜드는 특정 기회에 따른 수요에 크게 의존하는 브랜드보다 시장의 변동에 더 잘 대응할 수 있을 것으로 보입니다.
2025년에는 여성 의류가 매출의 52.33%를 차지하며, 온라인 의류 시장에서 압도적인 차이를 보이며 최대의 최종 소비자층이 되었습니다. 이러한 규모는 밸류, 프리미엄, 트렌드 주도 등 각 카테고리에 걸쳐 더 폭넓은 상품 구성, 높은 조회 빈도, 그리고 강력한 참여도를 반영하고 있습니다. 또한, 여성 의류는 워크웨어, 캐주얼웨어, 상황별 의류, 이너웨어, 애슬레저 등 더욱 다양한 구매 목적 덕분에 혜택을 보고 있습니다. 온라인 의류 시장에서 이처럼 폭넓은 상품 구색은 검색 및 추천 기회를 늘려주며, 장바구니 규모 확대와 재방문을 촉진합니다. 또한, 플랫폼과 브랜드 입장에서는 프로모션, 로열티 프로그램, 크리에이터 주도 캠페인을 전개하기 위한 보다 광범위한 기반이 됩니다.
아동복 시장은 2031년까지 연평균 성장률(CAGR) 5.62%로 확대될 것으로 예상되며, 최종 사용자 부문 중 가장 강력한 성장 전망을 보이고 있습니다. 아이들은 금방 옷이 작아지기 때문에 성인들보다 더 자주 옷장을 새로 꾸려야 하므로, 정기적인 교체 주기가 수요 패턴을 뒷받침하고 있습니다. 또한 Mordor Intelligence는 온라인 이용의 확대와 사이즈에 대한 우려를 해소해 주는 디지털 도구의 보급에 힘입어 아동복 부문이 2031년까지 꾸준한 성장을 이어갈 것으로 예상된다는 점을 강조했습니다. 남성 의류 부문도 꾸준히 성장세를 이어가고 있으며, 애슬레저 및 베이직 아이템에 대한 관심이 높아지고, 재구매가 용이하다는 점이 온라인 이용을 촉진하고 있습니다. 온라인 의류 시장 전반에서 편의성과 정확한 사이즈 가이드, 신속한 상품 검색 기능을 결합할 수 있는 브랜드가 최종 소비자층으로부터 점점 더 많은 지지를 얻고 있습니다.
지역별 분석
아시아태평양은 2025년 온라인 의류 시장 규모의 34.81%를 차지하고 있으며, 2031년까지 연평균 성장률(CAGR) 6.31%로 성장할 것으로 전망됩니다. 이로써 해당 지역은 가장 규모가 크고 가장 빠르게 성장하는 지역 블록이 됩니다. 중국은 탄탄한 플랫폼 생태계, 디지털 패션 구매에 대한 높은 친화도, 그리고 컨텐츠 주도형 상거래의 역할 확대를 바탕으로 이 지역에서 핵심적인 위치를 계속 유지하고 있습니다. 인도는 디지털 소매 보급률이 여전히 중국보다 낮기 때문에 온라인 의류 쇼핑을 처음 이용하는 고객층의 여지가 크며, 향후 더 큰 성장 잠재력을 지니고 있습니다. 동남아시아 역시 이 지역의 성장을 뒷받침하고 있으며, 패션 수요는 모바일 이용, 플래시 세일, 인플루언서 주도형 상품 발굴과 밀접하게 연결되어 있습니다. 일본에서는 2024년 의류 전자상거래 보급률이 23.38%에 달한 것으로 나타나, 성숙한 지역 시장이라 하더라도 여전히 성장 여지가 있음을 보여주고 있습니다.
2025년, 북미와 유럽은 각각 2위와 3위의 지역 클러스터를 형성하고 있으며, 두 지역의 온라인 의류 시장은 견고한 디지털 인프라와 보다 성숙한 구매층을 특징으로 하고 있습니다. 이러한 시장은 여전히 주요 수익원 역할을 하고 있지만, 디지털 쇼핑 습관이 이미 정착된 탓에 성장세는 다소 완만해지고 있습니다. 특히 할인, 신속한 배송, 간편한 반품이 고객의 당연한 기대가 된 분야에서는 해당 지역의 경쟁이 극도로 치열합니다. 또한 유럽에서는 포장 및 규정 준수 요건이 강화되면서 운영상의 부담이 커지고 있으며, 이는 출하량에 크게 의존하는 크로스보더 패션 판매업체들에게 비용 증가로 이어질 가능성이 있습니다. 실질적으로 이는 북미 및 유럽의 온라인 의류 시장에서 디지털 분야로의 신규 진입보다 고객 유지, 효율성 제고, 그리고 플랫폼 및 브랜드 간 시장 점유율 변동이 더 중요한 과제가 되고 있음을 의미합니다.
남미 및 중동 및 아프리카(MEA) 지역은 현재 시장 규모는 작지만, 온라인 의류 시장에서 플랫폼 확대와 모바일 주도 소비 확대를 통해 더 큰 성장 잠재력을 지니고 있습니다. 이러한 지역에서는 많은 국가에서 디지털 사용자층이 주로 젊은 층으로 구성되어 있다는 장점이 있으며, 그 때문에 의류 분야에서는 앱을 통해 상품을 발견하는 것이 특히 중요한 경우가 많습니다. MEA 지역에서는 2025년 기준 패션 및 의류 부문이 B2C 전자상거래 상품 매출의 25.96%를 차지하고 있어, 이 카테고리가 이미 해당 지역의 온라인 수요에서 얼마나 중심적인 위치를 차지하고 있는지 알 수 있습니다. 또한 남미 및 MEA 지역에서는 지역 및 현지 브랜드들이 현지화된 컨텐츠, 유연한 결제 수단, 그리고 현지 스타일 트렌드에 대한 신속한 적응을 통해 세계 기업들과 경쟁할 여지가 있습니다. 따라서 현재 규모는 이미 확고히 자리 잡은 주요 지역에는 아직 미치지 못하지만, 두 지역 모두 온라인 의류 시장에 있어 중요한 장기적 성장 기회를 제공하는 시장으로 부상하고 있습니다.
기타 혜택:
- 엑셀 형식 시장 예측(ME) 시트
- 3개월간의 애널리스트 지원
자주 묻는 질문
목차
제1장 서론
제2장 조사 방법
제3장 주요 요약
제4장 시장 구도
제5장 시장 규모와 성장 예측
제6장 경쟁 구도
제7장 시장 기회와 향후 전망
JHS 26.07.07According to Mordor Intelligence, the online apparel market size is projected to expand from USD 420.7 billion in 2025 and USD 438.2 billion in 2026 to USD 544.7 billion by 2031, registering a CAGR of 4.5% between 2026 and 2031.
This report is Segmented by Product Type (Formal Wear, Casual Wear, Sportswear, and More), End-User (Men, Women, and More), Fabric Material (Cotton, Polyester, and More), Category (Mass and Premium), Distribution Channel (Third-Party Retailer Platform and Company-Owned Platform), and Geography (North America, Europe, Asia-Pacific, and More). The Market Forecasts are Provided in Terms of Value (USD).
Global Online Apparel Market Trends and Insights
Growing Influence of Social Media Fashion Trends
Social platforms now shape a large part of how consumers discover clothing, compare looks, and complete purchases in the online apparel market. The shift matters because the same channel can now handle inspiration, recommendation, and checkout without forcing shoppers to move across several sites. That shortens the buying cycle and makes creator partnerships more important for brands that need quick visibility in crowded fashion categories. It also puts pressure on merchandising teams, because trend cycles now move faster and leave less time for seasonal planning in the online apparel market. Brands with flexible sourcing and faster content refresh rates are in a better position to turn rising attention into conversion. Brands that still depend on slower planning calendars face a clear disadvantage when social-led demand shifts within days.
Expansion of Mobile Commerce and Shopping Apps
Mobile devices are now central to browsing and purchasing behavior in the online apparel market, especially where younger shoppers spend more time inside brand apps, marketplace apps, and short-video feeds. This shift favors interfaces that reduce friction, store payment details, and keep product discovery active through push notifications and personalized feeds. It also raises the importance of app retention, because the winning platform is often the one that stays on the customer's home screen rather than the one that ranks highest in search. Japan offers a clear signal of this transition, as apparel e-commerce penetration reached 23.38% in 2024, almost double the 2019 level . That pattern shows how even developed digital markets still have room for deeper online penetration when user habits shift toward app-led buying. In the online apparel market, stronger mobile engagement also helps brands test faster launches, dynamic pricing, and more precise product recommendations.
Counterfeit Apparel Products Reducing Consumer Trust
Counterfeit exposure continues to weaken trust in the online apparel market because shoppers often discover fake products inside the same digital environments where legitimate brands are trying to build demand. A 2025 counterfeit-focused session hosted by the American Apparel & Footwear Association showed that 61% of buyers of fake goods did so unintentionally, and 52% of those unintentional purchases were fake fashion items . Pew Research Center also found that 17% of U.S. adults bought a counterfeit product online and were not refunded, while 85% saw online shopping scams as a significant problem. The damage extends beyond a single order because a poor counterfeit experience can lower repeat buying and reduce trust in the broader online apparel market. The European Union Intellectual Property Office also identified clothing as one of the most frequently seized counterfeit categories in global fake trade flows . Brands and platforms that invest more heavily in seller verification, monitoring, and fast takedowns will be better able to protect conversion and repeat purchase rates.
Other drivers and restraints analyzed in the detailed report include:
- Frequent Discounts and Promotional Pricing Strategies
- Increasing Adoption of Omnichannel Retail Models
- Size and Fit Uncertainties in Online Purchases
For complete list of drivers and restraints, kindly check the Table Of Contents.
Segment Analysis
Casual wear held 38.06% of the online apparel market share in 2025, which kept it firmly ahead of all other product groups in current revenue terms. That lead came from its broad use case, because casual clothing fits remote work, hybrid routines, travel, and everyday wear without requiring high wardrobe specialization. It also benefits from deeper SKU breadth, more frequent replenishment, and a lower decision threshold for many repeat buyers. In the online apparel market, casual wear works especially well with search, filtering, and recommendation tools because consumers often browse by style, price, and color rather than by a formal occasion. The size of this segment gives it a stabilizing effect on overall revenue, even when fashion cycles shift quickly.
Sportswear is forecast to grow at a 6.35% CAGR from 2026 to 2031, which places it ahead of the overall growth pace of the online apparel market. That premium is supported by rising overlap between performance wear and everyday style, which keeps the category relevant beyond gym or training use. Mordor Intelligence also noted that the broader sports apparel space is expected to grow strongly through 2031, with online channels showing particularly strong traction among digital-first consumers. Formal wear is recovering more gradually, because event-led demand tends to be less frequent and more fit-sensitive. Nightwear, loungewear, and intimate apparel remain important because they attract repeat buying and can be easier to standardize in digital selling. Across the online apparel market, brands with a balanced mix of casual, sports, and replenishment-driven items are likely to manage volatility better than brands that depend heavily on occasion-led demand.
Women held 52.33% of revenue in 2025, which made this the largest end-user group in the online apparel market by a wide margin. That scale reflects wider assortment depth, higher browsing frequency, and stronger engagement across value, premium, and trend-driven categories. Women's apparel also benefits from more varied purchase missions, including workwear, casualwear, occasionwear, intimate apparel, and athleisure. In the online apparel market, this range creates more search and recommendation opportunities, which support basket building and repeat visits. It also gives platforms and brands a broader base for promotions, loyalty programs, and creator-led campaigns.
Children's apparel is forecast to expand at a 5.62% CAGR through 2031, which gives it the strongest growth outlook within end-user segmentation. The demand pattern is supported by recurring replacement cycles, because children outgrow sizes quickly and require more frequent wardrobe updates than adults. Mordor Intelligence also highlighted that the children's wear segment is expected to post strong growth through 2031, supported by rising online adoption and digital tools that can ease fit-related hesitation. Men's apparel continues to advance steadily, with online adoption helped by growing interest in athleisure, basics, and easier replenishment purchases. Across the online apparel market, the end-user mix increasingly rewards brands that can combine convenience with strong size guidance and quick product discovery.
Complete Report Scope:
- Product Type
- Formal Wear
- Casual Wear
- Sportswear
- Nightwear/Loungewear
- Intimate
- Other Product Types
- End-User
- Men
- Women
- Children
- Fabric Material
- Cotton
- Polyester
- Nylon
- Denim
- Other Fabric Types
- Category
- Mass
- Premium
- Distribution Channel
- Third-Party Retailer Platform
- Company-Owned Platform
- Geography
- North America
- United States
- Canada
- Mexico
- Rest of North America
- Europe
- Germany
- United Kingdom
- Italy
- France
- Spain
- Netherlands
- Poland
- Belgium
- Sweden
- Rest of Europe
- Asia-Pacific
- China
- India
- Japan
- Australia
- Indonesia
- South Korea
- Thailand
- Singapore
- Rest of Asia-Pacific
- South America
- Brazil
- Argentina
- Colombia
- Chile
- Peru
- Rest of South America
- Middle East and Africa
- South Africa
- Saudi Arabia
- United Arab Emirates
- Nigeria
- Egypt
- Morocco
- Turkey
- Rest of Middle East and Africa
- North America
Geography Analysis
Asia-Pacific accounted for 34.81% share of the online apparel market size in 2025, and it is projected to grow at a 6.31% CAGR through 2031, which makes it both the largest and fastest-growing regional block. China remains the anchor within this region because of its deep platform ecosystem, high comfort with digital fashion buying, and the growing role of content-led commerce. India adds another layer of expansion potential because digital retail penetration is still lower than in China, which leaves more room for first-time online apparel adoption. Southeast Asia also supports regional growth, with fashion demand tied closely to mobile usage, flash sales, and influencer-driven discovery. Japan shows that even mature regional markets still have runway, as apparel e-commerce penetration reached 23.38% in 2024.
North America and Europe formed the second and third largest regional clusters in 2025, and both parts of the online apparel market are marked by strong digital infrastructure and a more mature buying base. These markets still deliver large revenue pools, but growth is more measured because digital shopping habits are already well established. Competition in these regions is intense, especially where discounting, fast delivery expectations, and easy returns have become standard customer assumptions. Europe also faces added operating pressure from tighter packaging and compliance requirements, which can raise cost for cross-border fashion sellers that depend on high shipment volume. In practical terms, this means the online apparel market in North America and Europe is less about first-time digital migration and more about retention, efficiency, and share shifts between platforms and brands.
South America and MEA are smaller in current value, but they offer more open runway for platform expansion and mobile-led wallet growth in the online apparel market. These regions benefit from a younger digital user base in many countries, and that often makes app-first discovery especially important for apparel. In MEA, fashion and apparel represented 25.96% of B2C e-commerce product revenue in 2025, which shows how central this category already is to regional online demand. South America and MEA also give regional and local brands room to compete with global players through localized content, payment flexibility, and faster adaptation to local style cues. That makes both regions important long-term opportunity zones for the online apparel market, even if their present scale still trails the larger established regions.
- VF Corporation
- H&M Group
- Fast Retailing Co., Ltd.
- Nike, Inc.
- Adidas AG
- Roadget Business Pte. Ltd.
- Inditex
- Puma SE
- Kering SA
- LVMH Moet Hennessy Louis Vuitton SE
- PVH Corp.
- Levi Strauss & Co.
- Gap Inc.
- Lululemon Athletica Inc.
- Ralph Lauren Corporation
- American Eagle Outfitters, Inc.
- Hanesbrands Inc.
- Under Armour, Inc.
- Hugo Boss AG
- Columbia Sportswear Company
Additional Benefits:
- The market estimate (ME) sheet in Excel format
- 3 months of analyst support
TABLE OF CONTENTS
1 INTRODUCTION
- 1.1 Study Assumptions and Market Definition
- 1.2 Scope of the Study
2 RESEARCH METHODOLOGY
3 EXECUTIVE SUMMARY
4 MARKET LANDSCAPE
- 4.1 Market Overview
- 4.2 Market Drivers
- 4.2.1 Growing influence of social media fashion trends
- 4.2.2 Expansion of mobile commerce and shopping apps
- 4.2.3 Frequent discounts and promotional pricing strategies
- 4.2.4 Easy product comparison across multiple brands
- 4.2.5 Convenient return and exchange policies boosting purchases
- 4.2.6 Increasing adoption of omnichannel retail models
- 4.3 Market Restraints
- 4.3.1 Counterfeit apparel products reducing consumer trust
- 4.3.2 Size and fit uncertainties in online purchases
- 4.3.3 Data privacy and cybersecurity concerns among shoppers
- 4.3.4 Growing concerns over sustainability and packaging waste
- 4.4 Consumer Demand Analysis
- 4.5 Regulatory Landscape
- 4.6 Technological outlook
- 4.7 Porter's Five Forces Analysis
- 4.7.1 Bargaining Power of Suppliers
- 4.7.2 Bargaining Power of Buyers
- 4.7.3 Threat of New Entrants
- 4.7.4 Threat of Substitutes
- 4.7.5 Degree of Competition
5 MARKET SIZE AND GROWTH FORECASTS (VALUE)
- 5.1 Product Type
- 5.1.1 Formal Wear
- 5.1.2 Casual Wear
- 5.1.3 Sportswear
- 5.1.4 Nightwear/Loungewear
- 5.1.5 Intimate
- 5.1.6 Other Product Types
- 5.2 End-User
- 5.2.1 Men
- 5.2.2 Women
- 5.2.3 Children
- 5.3 Fabric Material
- 5.3.1 Cotton
- 5.3.2 Polyester
- 5.3.3 Nylon
- 5.3.4 Denim
- 5.3.5 Other Fabric Types
- 5.4 Category
- 5.4.1 Mass
- 5.4.2 Premium
- 5.5 Distribution Channel
- 5.5.1 Third-Party Retailer Platform
- 5.5.2 Company-Owned Platform
- 5.6 Geography
- 5.6.1 North America
- 5.6.1.1 United States
- 5.6.1.2 Canada
- 5.6.1.3 Mexico
- 5.6.1.4 Rest of North America
- 5.6.2 Europe
- 5.6.2.1 Germany
- 5.6.2.2 United Kingdom
- 5.6.2.3 Italy
- 5.6.2.4 France
- 5.6.2.5 Spain
- 5.6.2.6 Netherlands
- 5.6.2.7 Poland
- 5.6.2.8 Belgium
- 5.6.2.9 Sweden
- 5.6.2.10 Rest of Europe
- 5.6.3 Asia-Pacific
- 5.6.3.1 China
- 5.6.3.2 India
- 5.6.3.3 Japan
- 5.6.3.4 Australia
- 5.6.3.5 Indonesia
- 5.6.3.6 South Korea
- 5.6.3.7 Thailand
- 5.6.3.8 Singapore
- 5.6.3.9 Rest of Asia-Pacific
- 5.6.4 South America
- 5.6.4.1 Brazil
- 5.6.4.2 Argentina
- 5.6.4.3 Colombia
- 5.6.4.4 Chile
- 5.6.4.5 Peru
- 5.6.4.6 Rest of South America
- 5.6.5 Middle East and Africa
- 5.6.5.1 South Africa
- 5.6.5.2 Saudi Arabia
- 5.6.5.3 United Arab Emirates
- 5.6.5.4 Nigeria
- 5.6.5.5 Egypt
- 5.6.5.6 Morocco
- 5.6.5.7 Turkey
- 5.6.5.8 Rest of Middle East and Africa
- 5.6.1 North America
6 COMPETITIVE LANDSCAPE
- 6.1 Market Concentration
- 6.2 Strategic Moves
- 6.3 Market Share Analysis
- 6.4 Company Profiles (includes Global level Overview, Market level overview, Core Segments, Financials as available, Strategic Information, Market Rank/Share for key companies, Products and Services, and Recent Developments)
- 6.4.1 VF Corporation
- 6.4.2 H&M Group
- 6.4.3 Fast Retailing Co., Ltd.
- 6.4.4 Nike, Inc.
- 6.4.5 Adidas AG
- 6.4.6 Roadget Business Pte. Ltd.
- 6.4.7 Inditex
- 6.4.8 Puma SE
- 6.4.9 Kering SA
- 6.4.10 LVMH Moet Hennessy Louis Vuitton SE
- 6.4.11 PVH Corp.
- 6.4.12 Levi Strauss & Co.
- 6.4.13 Gap Inc.
- 6.4.14 Lululemon Athletica Inc.
- 6.4.15 Ralph Lauren Corporation
- 6.4.16 American Eagle Outfitters, Inc.
- 6.4.17 Hanesbrands Inc.
- 6.4.18 Under Armour, Inc.
- 6.4.19 Hugo Boss AG
- 6.4.20 Columbia Sportswear Company


