

|
시장보고서
상품코드
2073369
모바일 액세서리 : 시장 점유율 분석, 업계 동향 및 통계, 성장 예측(2026-2031년)Mobile Accessories - Market Share Analysis, Industry Trends & Statistics, Growth Forecasts (2026 - 2031) |
||||||
 Mordor Intelligence
Mordor Intelligence에 의하면, 모바일 액세서리 시장 규모는 2026년에 1,131억 9,000만 달러에 달하고, 2031년에는 1,647억 8,000만 달러에 이를 것으로 예상되며, 예측 기간 CAGR 7.8%로 성장할 전망입니다.
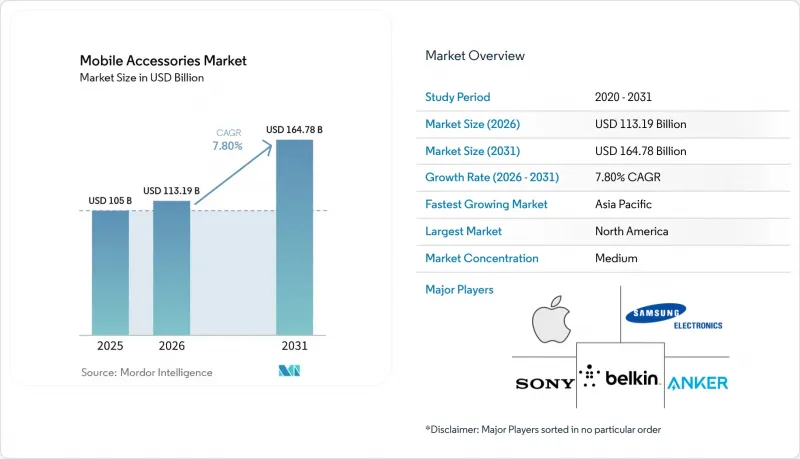
본 보고서는 제품 유형(헤드폰/이어폰, 충전기, 휴대용 배터리, 보호 케이스 등), 판매 채널(온라인 소매, 오프라인 소매 등), 가격대(저가대(20달러 이하), 중가대(21-50달러), 고가대(51달러 이상)), 호환 기종(Android 전용, iOS 전용, 범용/멀티플랫폼), 지역별로 분류되어 있습니다. 시장 전망은 금액(달러) 기준으로 제시되어 있습니다.
세계의 모바일 액세서리 시장 동향 및 인사이트
GaN 기술을 도입함으로써 초소형 급속 충전기를 구현했습니다.
갈륨 질화물(GaN) 소자는 실리콘보다 10배 높은 주파수에서 스위칭을 수행하기 때문에 설계자는 자기 부품을 40% 소형화하면서도 최대 240W까지의 USB Power Delivery 3.1 확장 전력 범위를 지원할 수 있게 됩니다. 2024년에 출시된 Anker의 ‘GaNPrime"는 기존의 실리콘 소재 동급 제품보다 30% 더 작은 크기의 전원 어댑터로 150W를 공급하며, 동봉형 충전기 시장에서 프리미엄 점유율을 확보했습니다. 2024년에 승인된 ITU의 L.1004 상호운용성 표준 덕분에 인증 비용이 20% 절감되었으며, 이는 각 제조업체가 여러 대의 기기를 보유한 가정을 대상으로 한 시장 확대를 추진하는 데 일조했습니다. 여행객과 항공사들은 하나의 콘센트로 노트북, 태블릿, 스마트폰을 충전할 수 있는 가벼운 어댑터를 높이 평가했습니다. 또한, 수율 향상으로 인해 GaN 제품의 부품 원가가 연간 15-18% 절감되어, 평균 판매 가격이 하락하는 상황에서도 이익률을 유지하고 있습니다.
액세서리 제조에 지속 가능한 소재 도입
유럽연합(EU)의 ‘지속 가능한 제품을 위한 친환경 설계 규정"에서는 2027년까지 액세서리에 대한 재활용 플라스틱 사용률 25% 요건이 단계적으로 도입됨에 따라, 사용 후 수지를 중심으로 한 공급망의 재설계가 시급해지고 있습니다. Apple의 “FineWoven MagSafe"케이스는 68%의 재생 소재를 함유하고 있으며 탄소 발자국을 45% 줄였지만, 초기 피드백에 따르면 내구성에 문제가 있는 것으로 나타났습니다. 피크 디자인은 2024년에 “페어트레이드 USA"의 노동 인증을 취득하여, 가격에 민감한 카테고리에서 사회적 준수를 전면에 내세웠습니다. 매출액이 5,000만 달러 미만인 브랜드는 다국적 기업보다 3배나 높은 단위당 시험 비용에 직면해 있으며, 이로 인해 대규모 기업에 구조적인 우위가 주어지고, 소재 구성에 따라 유해물질 규제(RoHS) 준수가 요구되는 사례나 케이블 분야의 업계 재편이 가속화되고 있습니다.
위조 모바일 액세서리의 만연
미국 세관·국경수비국은 2025년 1분기에 2,070만 달러 상당의 위조 액세서리를 압수했는데, 그중 62%는 애플의 케이블과 이어폰을 모방한 제품이었습니다. EU 지적재산청(EUIPO)의 추산에 따르면, 2024년 회원국 전체의 매출 손실은 13억 유로(14억 7,000만 달러)에 달할 것으로 보입니다. 아마존의 ‘브랜드 레지스트리"는 불만 발생률을 25% 줄였지만, 그 대신 연간 5만-20만 달러에 달하는 감시 비용을 브랜드 측에 전가하게 되었습니다. 위조품은 소비자의 가격 기대치를 정품보다 60-70% 낮게 고정시키고 있지만, 정품 기업은 매출의 8-12%를 진위 확인 도구에 투자하고 있어 자사 운영 웹 채널로 판매를 전환하고 있으며, 현재 매출의 35-40%를 해당 채널에서 확보하고 있습니다.
부문별 분석
2025년, 보호 케이스는 모바일 액세서리 시장 점유율의 26.11%를 차지하며, 단말기 구매 후 가장 먼저 구매하는 추가 아이템으로서의 입지를 확고히 다졌습니다. 한편, 무선 충전기는 Qi2의 ‘Magnetic Power Profile" 덕분에 출력이 15W에서 25W로 향상되고, 코일 정렬이 보장되어 에너지 손실을 30% 줄일 수 있게 됨에 따라, 모바일 액세서리 시장의 기준치를 약간 밑도는 6.96%의 연평균 성장률(CAGR)을 보일 것으로 전망됩니다. 헤드폰과 이어폰은 과거에는 프리미엄 모델에만 탑재되었던 TWS 기능의 인기에 힘입어 두 번째로 큰 시장 점유율을 차지하고 있습니다.
모바일 배터리의 경우, 배터리 제조업체들이 전기차를 우선시하고 있어 셀 공급에 어려움을 겪고 있으며, 이로 인해 대용량화를 위한 혁신이 저해되고 있습니다. 한편, 스크린 보호 필름과 차량용 홀더는 저성장 분야에서 정체 상태가 이어지고 있습니다. 스마트 워치 스트랩은 웨어러블 기기가 스마트폰보다 더 자주 교체되기 때문에 새로운 수익원으로 부상하고 있으며, 브랜드들은 40-60%의 매출총이익률을 확보하고 있습니다. 따라서 카테고리의 동향은 규모의 경제가 우세한 상품화된 보호 및 충전 용품과, 기술적 차이는 제한적이지만 프리미엄 가격을 유지하고 있는 MagSafe 충전기와 같은 생태계에 뿌리를 둔 SKU로 양극화되고 있습니다.
온라인 스토어는 2025년 매출의 54.22%를 차지했으며, 각 브랜드가 매장 임대료와 인건비를 절감하고 데이터와 이익률을 추구하는 가운데 연평균 성장률(CAGR) 7.67%를 나타낼 것으로 전망됩니다. 최종 구매가 다른 곳에서 이루어지더라도 아마존은 여전히 가장 큰 상품 발견의 장이며, 판매자들에게는 15-20%의 수수료를 수용하도록 압력이 가해지고 있습니다. 45.78%의 점유율을 차지하는 오프라인 매장은 방문객 수 감소와 임대료 급등으로 어려움을 겪고 있으며, 생산성은 1제곱피트당 400달러 미만에 그치고 있습니다.
통신사의 직영점은 단말기 보조금 제도가 축소되고, 소비자들이 액세서리를 별도로 구매하게 되면서 그 중요성을 점차 잃어가고 있습니다. 브랜드 직영점은 쇼룸으로서의 매력과 프리미엄 감성을 훌륭하게 조화시켜, 매출의 5분의 1에 불과한 액세서리 부문에서 매출총이익의 35-40%를 창출하고 있습니다. 신흥 시장에서는 도매 채널이 여전히 중요하지만, 브랜드들이 Flipkart나 Noon과 같은 플랫폼과 직접 제휴를 맺으면서 이익률이 압박받고 있습니다. EU의 디지털 서비스법(DSA)에 따라 플랫폼의 법적 책임 비용은 12-15% 증가했으나, 한편으로는 온라인 소비자의 신뢰도가 높아지면서 프리미엄 자사 웹사이트 판매와 가치 지향적 마켓플레이스 간의 채널 양극화가 가속화되고 있습니다.
지역별 분석
아시아태평양은 선전의 공장 네트워크와 인도의 1만 7,000 크롤(20억 4,000만 달러)에 달하는 생산 연계형 인센티브(부품 생산의 현지화 촉진)에 힘입어, 2025년 시장 가치의 39.75%를 차지했습니다. 북미 시장 점유율은 28%이지만, 휴대전화 제품 수명 주기의 장기화와 시장 포화 현상에 직면해 있습니다. 그럼에도 불구하고, 대형 브랜드들은 소규모 경쟁사들이 충족할 수 없는 규제 요건의 혜택을 누리고 있습니다. 유럽 시장의 약 22% 점유율은 USB-C 규격 및 전자 폐기물 관련 규제로 인해 재편되고 있으며, 이로 인해 기기당 0.11-0.57달러의 수수료가 추가됨에 따라 자체적으로 재활용을 수행하는 기업이 유리한 입장에 서게 되었습니다.
중동 시장 규모는 한 자릿수에 그치지만, 스마트폰 보급률이 95%에 달하며, 게다가 “사우디 비전 2030"에 따른 5,000억 달러 규모의 디지털 인프라 투자와 맞물려, 연평균 성장률(CAGR) 7.77%의 궤도에 올라 있습니다. 남미는 최대 60%에 달하는 수입 관세의 장벽으로 인해 한 자릿수 중반의 성장에 그치고 있지만, 메르코수르(Mercosur)의 관세 우대 조치를 활용하기 위한 현지 조립이 진행되고 있습니다. 아프리카에서는 전력망의 신뢰성이 브랜드보다 더 중요하게 여겨지기 때문에 솔라뱅크와 같은 전원 지속성 제품에 초점이 맞추어지고 있습니다.
지역 전체를 살펴보면, 성숙한 시장에서는 프리미엄급 생태계 기기를 통해 수익화가 진행되는 반면, 신흥 경제국에서는 20달러 미만의 기본형 제품이 선호되기 때문에 양극화된 전망을 보이고 있습니다. 아시아태평양은 계속해서 판매량의 중심지가 될 것으로 보이지만, 중동 및 동남아시아에서는 전자상거래 물류 서비스가 지방 도시로 확산됨에 따라 타 지역을 압도하는 성장을 이룰 전망입니다.
기타 혜택 :
- 엑셀 형식 시장 예측(ME) 시트
- 3개월간의 애널리스트 지원
자주 묻는 질문
목차
제1장 서론
제2장 조사 방법
제3장 주요 요약
제4장 시장 구도
제5장 시장 규모 및 성장 예측
제6장 경쟁 구도
제7장 시장 기회 및 향후 전망
KTH 26.07.08According to Mordor Intelligence, the mobile accessories market size stands at USD 113.19 billion in 2026 and is projected to reach USD 164.78 billion in 2031, advancing at a 7.8% CAGR over the forecast period.
This report is Segmented by Product Type (Headphones/Earbuds, Chargers, Power Banks, Protective Cases, and More), Distribution Channel (Online Retail, Offline Retail, and More), Price Range (Low (Up To USD 20), Mid (USD 21-50), Premium (USD 51 and Above)), Compatibility (Android-Specific, IOS-Specific, and Universal/Multi-platform), and Geography. The Market Forecasts are Provided in Terms of Value (USD).
Global Mobile Accessories Market Trends and Insights
Adoption of GaN Technology Enabling Ultra-Compact Fast Chargers
Gallium-nitride devices switch at frequencies 10-times higher than silicon, allowing designers to shrink magnetic components by 40% while supporting USB Power Delivery 3.1 Extended Power Range up to 240 W. Anker's GaNPrime, launched in 2024, delivers 150 W in a brick 30% smaller than legacy silicon equivalents and captured premium share from bundled chargers. ITU's L.1004 interoperability standard, ratified in 2024, cut certification costs by 20%, helping makers pursue multi-device households. Travelers and airlines value lighter adapters that power laptops, tablets, and phones from one outlet, while yield gains are trimming GaN bill-of-materials by 15-18% per year, protecting margins even as average selling prices soften.
Integration of Sustainable Materials in Accessory Manufacturing
The European Union's Ecodesign for Sustainable Products Regulation phases in a 25% recycled-plastic requirement for accessories by 2027, forcing redesign of supply chains around post-consumer resin. Apple's FineWoven MagSafe case contains 68% recycled content and cuts carbon footprint 45%, yet feedback shows early durability compromises. Peak Design added Fair Trade USA labor certification in 2024, spotlighting social compliance in a price-sensitive category. Brands under USD 50 million sales face per-unit testing costs triple those of multinationals, granting scale players a structural edge and accelerating consolidation in cases and cables where composition dictates Restriction of Hazardous Substances compliance.
Prevalence of Counterfeit Mobile Accessories
US Customs and Border Protection seized USD 20.7 million in fake accessories in Q1 2025, 62% of which imitated Apple cables and earbuds. EUIPO estimates EUR 1.3 billion (USD 1.47 billion) in lost sales across member states in 2024. Amazon's Brand Registry cut complaint rates 25% yet shifted the USD 50 000-200 000 annual policing burden onto brands. Counterfeits anchor consumer price expectations 60-70% lower than genuine items, while legitimate firms divert 8-12% of revenue to authentication tools, nudging them toward owned-web channels where they now capture 35-40% of sales.
Other drivers and restraints analyzed in the detailed report include:
- Growing Adoption of Wireless Audio
- Increasing Smartphone Penetration
- Stricter E-waste Regulations Raising Compliance Costs
For complete list of drivers and restraints, kindly check the Table Of Contents.
Segment Analysis
Protective cases controlled 26.11% of the mobile accessories market share in 2025, confirming their role as the first add-on after a handset purchase. Wireless chargers, however, are projected to post a 6.96% CAGR that is slightly below the mobile accessories market size baseline, driven by Qi2's Magnetic Power Profile that lifts power from 15 W to 25 W and guarantees coil alignment, trimming energy loss 30%. Headphones and earbuds form the next-largest slice, propelled by TWS features once found only in premium models.
Power banks struggle with cell supply as battery makers prioritize electric vehicles, curbing high-capacity innovation, while screen protectors and car mounts plateau in low-growth territory. Smartwatch bands emerge as a fresh value pool because wearables refresh more often than phones, letting brands levy 40-60% gross margins. Category dynamics thus bifurcate into commoditized protection-and-charging goods where scale wins, versus ecosystem-anchored SKUs such as MagSafe chargers that sustain premium pricing despite limited technical gaps.
Online storefronts captured 54.22% of 2025 revenue and are slated for 7.67% CAGR as brands hunt data and margin by bypassing store rent and staffing costs. Amazon remains the top discovery venue even where final purchase occurs elsewhere, pressuring sellers to accept 15-20% commissions. Physical outlets, holding 45.78% share, fight falling foot traffic and rising rents that drag productivity below USD 400 per square foot.
Carrier shops lose relevance because device subsidies faded and consumers decouple accessory purchases. Brand-owned stores blend showroom flair with premium attachment, generating 35-40% of gross profit from accessories though they supply only a fifth of sales. In emerging markets, wholesale channels still matter but see margins squeezed as brands partner directly with platforms such as Flipkart and Noon. The EU Digital Services Act raised platform liability costs 12-15% yet boosted shopper trust online, accelerating channel polarization between premium owned-web sales and value-driven marketplaces.
Complete Report Scope:
- By Product Type
- Headphones / Earbuds
- Chargers
- Power Banks
- Protective Cases
- Screen Protectors
- Car Mounts
- Selfie Sticks and Gimbals
- Smartwatch Bands and Straps
- Other Product Types
- By Distribution Channel
- Online Retail
- Offline Retail
- Carrier Stores
- Brand-exclusive Stores
- Wholesale and Distributors
- By Price Range
- Low (Greater than or equal to USD 20)
- Mid (USD 21-50)
- Premium (Less than or equal USD 51)
- By Compatibility
- Android-specific Accessories
- iOS-specific Accessories
- Universal / Multi-platform Accessories
- By Geography
- North America
- United States
- Canada
- Mexico
- South America
- Brazil
- Argentina
- Rest of South America
- Europe
- Germany
- United Kingdom
- France
- Italy
- Spain
- Russia
- Rest of Europe
- Asia-Pacific
- China
- India
- Japan
- South Korea
- Southeast Asia
- Rest of Asia-Pacific
- Middle East
- Saudi Arabia
- United Arab Emirates
- Turkey
- Rest of Middle East
- Africa
- South Africa
- Nigeria
- Kenya
- Rest of Africa
- North America
Geography Analysis
Asia-Pacific contributed 39.75% of 2025 value, anchored by Shenzhen's factory network and India's INR 17 000 crore (USD 2.04 billion) production-linked incentives that localize component output. North America's 28% share faces lengthening handset cycles and category saturation, yet large brands benefit from regulatory demands that smaller rivals cannot meet. Europe's roughly 22% slice is reshaped by USB-C and e-waste rules that add USD 0.11-0.57 per unit in fees, favoring firms with in-house recycling.
The Middle East, though single-digit in size, is on track for a 7.77% CAGR as 95% smartphone penetration collides with USD 500 billion digital-infrastructure outlays under Saudi Vision 2030. South America grows mid-single-digits hindered by import duties up to 60%, triggering local assembly to tap Mercosur tariff breaks. Africa focuses on power continuity products like solar banks because grid reliability trumps brand.
Across regions, mature markets monetize through premium ecosystem gear, whereas emerging economies favor sub-USD 20 basics, creating a dual-speed outlook. Asia-Pacific will stay the volume hub while the Middle East and Southeast Asia capture outsized growth as e-commerce fulfillment penetrates secondary cities.
- Apple Inc.
- Samsung Electronics Co., Ltd.
- Sony Group Corporation
- Belkin International, Inc.
- Anker Innovations Ltd.
- Logitech International S.A.
- Western Digital Corporation
- Aukey Technology Co., Ltd.
- Bose Corporation
- Xiaomi Corporation
- Huawei Technologies Co., Ltd.
- BBK Electronics Corporation Ltd.
- ZAGG Inc.
- Otter Products LLC
- Skullcandy Inc.
- GN Audio A/S (Jabra)
- Plantronics, Inc. (Poly)
- Baseus Technology Co., Ltd.
- Ugreen Group Limited
- TP-Link Technology Co., Ltd.
Additional Benefits:
- The market estimate (ME) sheet in Excel format
- 3 months of analyst support
TABLE OF CONTENTS
1 INTRODUCTION
- 1.1 Study Assumptions and Market Definition
- 1.2 Scope of the Study
2 RESEARCH METHODOLOGY
3 EXECUTIVE SUMMARY
4 MARKET LANDSCAPE
- 4.1 Market Overview
- 4.2 Market Drivers
- 4.2.1 Increasing Smartphone Penetration
- 4.2.2 Expansion of E-commerce Channels
- 4.2.3 Growing Adoption of Wireless Audio
- 4.2.4 Rising Consumer Spending on Mobile Gaming Accessories
- 4.2.5 Adoption of GaN Technology Enabling Ultra-Compact Fast Chargers
- 4.2.6 Integration of Sustainable Materials in Accessory Manufacturing
- 4.3 Market Restraints
- 4.3.1 Prevalence of Counterfeit Mobile Accessories
- 4.3.2 Saturation in Replacement Accessory Cycles
- 4.3.3 Stricter E-waste Regulations Raising Compliance Costs
- 4.3.4 Supply Constraints in Advanced Battery Cells for High-Capacity Power Banks
- 4.4 Industry Value Chain Analysis
- 4.5 Impact of Macroeconomic Factors on the Market
- 4.6 Regulatory Landscape
- 4.7 Technological Outlook
- 4.8 Porter's Five Forces Analysis
- 4.8.1 Bargaining Power of Suppliers
- 4.8.2 Bargaining Power of Consumers
- 4.8.3 Threat of New Entrants
- 4.8.4 Threat of Substitute Products
- 4.8.5 Intensity of Competitive Rivalry
5 MARKET SIZE AND GROWTH FORECASTS (VALUE)
- 5.1 By Product Type
- 5.1.1 Headphones / Earbuds
- 5.1.2 Chargers
- 5.1.3 Power Banks
- 5.1.4 Protective Cases
- 5.1.5 Screen Protectors
- 5.1.6 Car Mounts
- 5.1.7 Selfie Sticks and Gimbals
- 5.1.8 Smartwatch Bands and Straps
- 5.1.9 Other Product Types
- 5.2 By Distribution Channel
- 5.2.1 Online Retail
- 5.2.2 Offline Retail
- 5.2.3 Carrier Stores
- 5.2.4 Brand-exclusive Stores
- 5.2.5 Wholesale and Distributors
- 5.3 By Price Range
- 5.3.1 Low (Greater than or equal to USD 20)
- 5.3.2 Mid (USD 21-50)
- 5.3.3 Premium (Less than or equal USD 51)
- 5.4 By Compatibility
- 5.4.1 Android-specific Accessories
- 5.4.2 iOS-specific Accessories
- 5.4.3 Universal / Multi-platform Accessories
- 5.5 By Geography
- 5.5.1 North America
- 5.5.1.1 United States
- 5.5.1.2 Canada
- 5.5.1.3 Mexico
- 5.5.2 South America
- 5.5.2.1 Brazil
- 5.5.2.2 Argentina
- 5.5.2.3 Rest of South America
- 5.5.3 Europe
- 5.5.3.1 Germany
- 5.5.3.2 United Kingdom
- 5.5.3.3 France
- 5.5.3.4 Italy
- 5.5.3.5 Spain
- 5.5.3.6 Russia
- 5.5.3.7 Rest of Europe
- 5.5.4 Asia-Pacific
- 5.5.4.1 China
- 5.5.4.2 India
- 5.5.4.3 Japan
- 5.5.4.4 South Korea
- 5.5.4.5 Southeast Asia
- 5.5.4.6 Rest of Asia-Pacific
- 5.5.5 Middle East
- 5.5.5.1 Saudi Arabia
- 5.5.5.2 United Arab Emirates
- 5.5.5.3 Turkey
- 5.5.5.4 Rest of Middle East
- 5.5.6 Africa
- 5.5.6.1 South Africa
- 5.5.6.2 Nigeria
- 5.5.6.3 Kenya
- 5.5.6.4 Rest of Africa
- 5.5.1 North America
6 COMPETITIVE LANDSCAPE
- 6.1 Market Concentration
- 6.2 Strategic Moves
- 6.3 Market Share Analysis
- 6.4 Company Profiles (includes Global Level Overview, Market Level Overview, Core Segments, Financials as Available, Strategic Information, Market Rank/Share for Key Companies, Products and Services, and Recent Developments)
- 6.4.1 Apple Inc.
- 6.4.2 Samsung Electronics Co., Ltd.
- 6.4.3 Sony Group Corporation
- 6.4.4 Belkin International, Inc.
- 6.4.5 Anker Innovations Ltd.
- 6.4.6 Logitech International S.A.
- 6.4.7 Western Digital Corporation
- 6.4.8 Aukey Technology Co., Ltd.
- 6.4.9 Bose Corporation
- 6.4.10 Xiaomi Corporation
- 6.4.11 Huawei Technologies Co., Ltd.
- 6.4.12 BBK Electronics Corporation Ltd.
- 6.4.13 ZAGG Inc.
- 6.4.14 Otter Products LLC
- 6.4.15 Skullcandy Inc.
- 6.4.16 GN Audio A/S (Jabra)
- 6.4.17 Plantronics, Inc. (Poly)
- 6.4.18 Baseus Technology Co., Ltd.
- 6.4.19 Ugreen Group Limited
- 6.4.20 TP-Link Technology Co., Ltd.
7 MARKET OPPORTUNITIES AND FUTURE OUTLOOK
- 7.1 White-Space and Unmet-Need Assessment


