
|
시장보고서
상품코드
2073384
비즈니스 항공 서비스 : 시장 점유율 분석, 업계 동향 및 통계, 성장 예측(2026-2031년)Business Aviation Services - Market Share Analysis, Industry Trends & Statistics, Growth Forecasts (2026 - 2031) |
||||||
 Mordor Intelligence
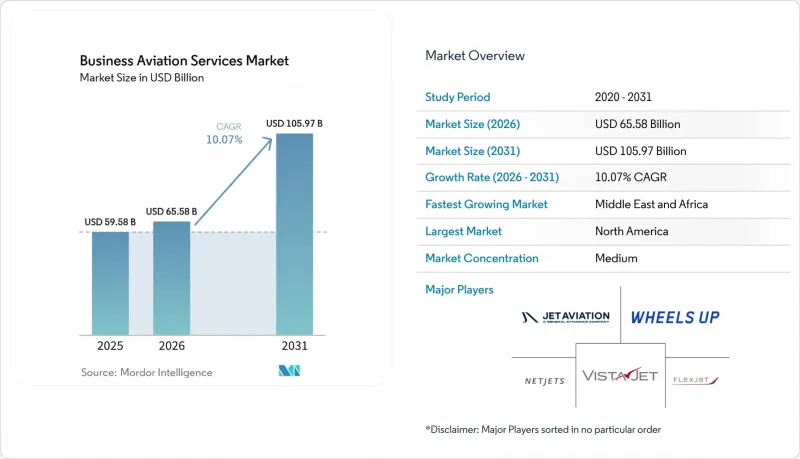
Mordor Intelligence에 의하면, 비즈니스 항공 서비스 시장 규모는 2025년에 595억 8,000만 달러로 평가되었습니다. 2026년 655억 8,000만 달러에서 2031년에는 1,059억 7,000만 달러로 확대되어 2026년부터 2031년에 걸쳐 CAGR 10.07%를 나타낼 것으로 예측됩니다.
본 보고서는 소유 형태(전세, 분양 소유, 제트 카드/회원제), 항공기 유형(라이트 제트, 미드사이즈 제트, 라지 제트, 여객기), 최종 사용자(기업 기단, 개인, 정부 및 NGO), 비행 시간(2시간 이내, 2시간 이상), 지역(북미, 유럽, 아시아태평양, 기타)별로 분류되어 있습니다. 시장 전망은 금액(달러) 기준으로 제시되어 있습니다.
세계의 비즈니스 항공 서비스 시장 동향 및 인사이트
미드사이즈 및 슈퍼미드사이즈 제트기 부문에서 코로나19 사태 이후 기업 출장의 회복
중동의 기업 출장비는 2024년에 181억 달러에 달하고, 팬데믹 이전 수준보다 19.4% 증가했습니다. 이는 미국과 유럽에서 나타난 유사한 회복 추세를 반영한 것입니다. 각 항공사들은 운항 일정을 정상화했지만, 지방 공항으로의 접근성, 당일 왕복 일정, 기내 사생활 보호와 같은 장점 덕분에 비행 시간이 2-5시간인 중형 및 초대형 제트기를 대상으로 하는 비즈니스 항공 서비스 시장은 여전히 매력적인 시장으로 남아 있습니다. 기업들은 좌석당 단가 그 자체보다 생산성 향상을 더 중요시하는 한편, '블레저(비즈니스와 레저의 융합)' 여행이 업무와 여가를 하나로 결합함에 따라, 기능성과 쾌적성의 균형을 갖춘 객실에 대한 수요가 더욱 증가했습니다. 또한, 항공사가 지속 가능한 항공 연료(SAF) 사용을 통한 탄소 상쇄를 제공함으로써 환경 관련 규제를 완화한 점도 이 부문에 호재가 되었습니다.
중소기업(SME) 사이에서 급증하는 분양 소유 및 회원제 모델
2021년, 북미의 분할 소유 항공기 운항 시간은 76만 시간을 넘어, 2019년 대비 23% 증가했습니다. 이는 NetJets가 신규 항공기에 25억 달러를 투자하고, 중소기업의 재무 부서 입장에서 매력적이고 예측 가능한 비용 구조를 추진한 데 기인합니다. 회원제 프로그램에서는 예약 수수료가 면제되고, 4-10시간 전에 알림을 받으면 항공편 확보가 보장되므로 진입 장벽이 낮아졌습니다. 그 결과, 비즈니스 항공 서비스 시장은 기존에는 정기 항공사에 한정되어 있던 고객층을 흡수함으로써, 수요를 더 빈번하고 짧은 시간의 비행으로 재편했습니다.
조종사 부족과 임금 인플레이션으로 인한 운영 비용 증가
항공사 조종사의 초임은 2000년 1만 6,000달러에서 2023년에는 10만 8,000달러로 상승했으며, 항공사들이 연간 1만 4,000명 이상의 조종사를 채용함에 따라 비즈니스 항공 업계의 인재 풀이 고갈되었습니다. 운항사는 임금을 인상하고, 사내 교육에 자금을 투입하며, 직원 정착을 촉진하기 위한 조치를 취한 결과, 가격 책정과 이익률에 더욱 큰 압박이 가해졌습니다.
부문별 분석
2025년, 전세 항공 서비스는 비즈니스 항공 서비스 시장의 51.88%를 차지하며, 비정기적인 이동 수요가 있는 고객들에게 주문형 유연성을 제공했습니다. 한편, 중소기업들이 장비 관리에 따른 간접비를 피하면서도 항공기 가용성을 확보하기 위해 지분 공유 방식을 채택함에 따라, 분할 소유(프랙셔널 오너십)는 2031년까지의 예측 기간 동안 12.18%라는 가장 높은 연평균 성장률(CAGR)을 기록했습니다. 전세 항공 모델이 번창한 이유는 항공사가 항공기를 전 세계적으로 재배치함으로써 계절적 변동을 완화하고, 변동하는 수요에 대응할 수 있었기 때문입니다. 그러나 예측 가능한 시간당 단가, 세제 혜택, 그리고 낮은 자본 지출이 분양 소유의 매력을 높였습니다.
하이브리드형 서비스 제공으로 인해 카테고리 간의 경계가 모호해졌습니다. 제트 카드는 25-100시간 단위로 고정된 시간당 요금을 제공하며, 회원제 제도에서는 취득 수수료가 면제되었습니다. Vista Global은 Jet Edge를 3억 5,000만 달러에 인수하여 북미 내 전세 사업 규모를 2배로 확대했습니다. 이는 각 모델 간 경쟁을 위해 필요한 규모를 시사하는 것입니다. 그 결과, 비즈니스 항공 서비스 시장에서는 서비스 혁신과 번들링 전략이 더욱 활발해졌습니다.
2025년, 라이트 제트는 운영 비용이 낮고, 주류를 이루는 2-5시간 비행 패턴에 적합하다는 점 때문에 비즈니스 항공 서비스 시장의 43.02%를 차지했습니다. 중형 항공기는 비용과 항속 거리의 균형을 맞추고 있었으나, 고객들이 대륙 간 직항편을 중요시함에 따라 대형 제트기는 연평균 성장률(CAGR) 11.12%로 성장할 전망입니다. 8,000해리의 항속 거리를 자랑하며, 2025년에 인증을 획득한 봄바르디아사의 '세계의 8000'는 이러한 프리미엄화 추세를 상징하는 기체입니다.
객실 기술의 향상, 정비 주기 연장, 그리고 지속가능한 항공 연료(SAF) 도입을 통해 대형 제트기의 경제성이 더욱 향상되었습니다. 수많은 제2 공항이 있는 북미에서는 라이트 제트기가 여전히 필수적이었지만, 아시아와 중동 및 아프리카 간 신규 노선이 대형 기내 공간을 갖춘 항공기를 이용한 장거리 비행에 대한 수요를 촉진했습니다.
지역별 분석
2025년, 북미는 비즈니스 항공 서비스 시장 점유율의 60.94%를 차지했습니다. 이는 1만 4,000곳 이상의 이용 가능한 공항과, 신속하고 효율적이며 투명한 운항 허가를 가능하게 하는 안정적인 규제 체계에 힘입은 것입니다. 포춘 500대 기업의 본사가 가장 많이 집중되어 있는 미국이 지역 수요를 주도하는 한편, 캐나다와 멕시코는 에너지, 광업, 제조업 등 각 부문에 국경을 초월한 연결성을 제공했습니다. 조종사 부족과 뉴욕 및 워싱턴의 허브 공항에서 발생한 혼잡 증가가 단기적인 제약 요인으로 작용했으나, 디지털 스케줄링 도구와 보조 공항 전략을 통해 혼란이 완화되었습니다.
유럽 시장은 여전히 큰 규모를 유지했으나, 각 항공사는 엄격한 환경 대책에 직면했습니다. “ReFuelEU Aviation”지침에 따라 항공사들은 지속가능한 항공유(SAF)를 혼합해야 할 의무가 부과되었으며, 이에 따라 루프트한자는 2025년부터 편당 최대 72유로의 추가 요금을 도입했습니다. 영국, 독일, 프랑스가 유럽 내 운항을 뒷받침하는 한편, 지정학적 긴장으로 인해 러시아의 활동은 제한되었습니다. 항공기 현대화, 탄소 상쇄 제도, 그리고 노선 최적화를 통해 각 항공사는 배출 규제가 강화된 상황에서도 서비스 품질을 유지할 수 있었습니다.
중동 및 아프리카는 연평균 성장률(CAGR) 11.88%를 나타낼 것으로 전망되며, 가장 빠르게 성장하는 지역으로 부상했습니다. 사우디아라비아에서는 '비전 2030' 개혁을 통해 외국 전세 항공사에 대한 시장 접근이 개방되면서, 2024년에는 1억 2,800만 명의 승객 수를 기록했습니다. 두바이와 리야드에 신설된 FBO(고정 기지 운영사) 시설에 더해, 국내 노선 운항 규제가 완화됨에 따라 지역 네트워크 확장이 촉진되었습니다. 아프리카의 광업 및 인프라 프로젝트에서는 외딴 지역으로 가는 직항편이 필요해지면서, 비즈니스 항공 서비스 시장의 가치 제안이 더욱 강화되었습니다.
기타 혜택 :
- 엑셀 형식 시장 예측(ME) 시트
- 3개월간의 애널리스트 지원
자주 묻는 질문
목차
제1장 서론
제2장 조사 방법
제3장 주요 요약
제4장 시장 구도
제5장 시장 규모 및 성장 예측
제6장 경쟁 구도
제7장 시장 기회 및 향후 전망
KTH 26.07.07According to Mordor Intelligence, the business aviation services market size in 2026 was valued at USD 59.58 billion in 2025, and is projected to grow from USD 65.58 billion in 2026 to USD 105.97 billion in 2031, growing at a 10.07% CAGR over 2026-2031.
This report is Segmented by Ownership Type (Charter, Fractional Ownership, and Jet Card/Membership), Aircraft Type (Light Jet, Mid-Size Jet, Large Jet, and Airliners), End-User (Corporate Fleet, Private Individual, and Government and NGO), Flight Duration(Upto 2 Hours, and More), and Geography (North America, Europe, Asia-Pacific, and More). The Market Forecasts are Provided in Terms of Value (USD).
Global Business Aviation Services Market Trends and Insights
Post-COVID corporate travel rebound in mid-size and super-mid jet categories
Corporate travel spending in the Middle East reached USD 18.1 billion in 2024, 19.4% above pre-pandemic levels, mirroring similar recoveries in the US and Europe. Airlines restored schedules, yet secondary-airport access, same-day itineraries, and cabin privacy kept the business aviation services market attractive for mid-size and super-mid jets that dominate the 2-5-hour mission band. Companies valued productivity gains over direct seat costs, while "bleisure" trips blended work and leisure, further supporting demand for cabins that balance function and comfort. The segment benefited as operators offered SAF burn offsets, easing environmental scrutiny.
Surging fractional-ownership and membership models among SMEs
Fractional flight hours surpassed 760,000 in North America in 2021, 23% ahead of 2019, as NetJets invested USD 2.5 billion in new aircraft and promoted predictable cost structures that appeal to SME finance teams. Membership programs removed acquisition fees and guaranteed aircraft within 4-10 hours' notice, lowering entry hurdles. Therefore, the business aviation services market captured customers previously confined to scheduled airlines, reshaping demand toward more frequent, shorter missions.
Rising operating cost base from pilot shortage wage inflation
Starting airline pilot salaries climbed from USD 16,000 in 2000 to USD 108,000 in 2023, and airlines hired more than 14,000 pilots annually, draining the business aviation talent pool. Operators raised wages, funded in-house training, and offered retention incentives, adding pressure to pricing and margins.
Other drivers and restraints analyzed in the detailed report include:
- Accelerated replacement cycle driven by SAF-ready aircraft and avionics retrofits
- Digital charter marketplaces lowering customer acquisition costs
- Airspace congestion and slot curbs at tier-1 business hub
For complete list of drivers and restraints, kindly check the Table Of Contents.
Segment Analysis
Charter services accounted for 51.88% of the business aviation services market in 2025, offering on-demand flexibility to clients with irregular travel needs. Fractional ownership, however, recorded the highest 12.18% CAGR forecast to 2031 as SMEs adopted shared equity to guarantee aircraft availability while avoiding fleet management overhead. The charter model thrived because operators could reposition aircraft globally to smooth seasonality and match variable demand. Yet predictable hourly pricing, tax incentives, and lower capital outlay strengthened the appeal of fractional shares.
Hybrid offerings blurred category lines. Jet cards offered fixed hourly rates for 25-100-hour blocks, while membership schemes eliminated acquisition fees. Vista Global doubled its North American charter footprint through a USD 350 million acquisition of Jet Edge, signaling the scale required to compete across models. As a result, the business aviation services market witnessed intensified service innovation and bundling strategies.
Light jets accounted for 43.02% of the business aviation services market in 2025, thanks to lower operating costs and their suitability for the dominant 2-5-hour mission profile. Mid-size models bridged cost and range, but large jets are set to grow at a 11.12% CAGR because clients value nonstop connectivity across continents. Bombardier's Global 8000, with an 8,000-nautical-mile range and certification planned for 2025, exemplified the premiumization trend.
Cabin technology improvements, longer maintenance intervals, and SAF compatibility further enhanced large-jet economics. Light jets remained essential in North America, where secondary airports were abundant, while new routes between Asia, the Middle East, and Africa spurred demand for large-cabin endurance.
Complete Report Scope:
- By Ownership Type
- Charter (On-Demand)
- Fractional Ownership
- Jet Card/Membership
- By Aircraft Type
- Light Jet
- Mid-Size Jet
- Large Jet
- Airliners
- By End-User
- Corporate Fleet
- Private Individual
- Government and NGO
- By Flight Duration
- Upto 2 hours
- Between 2 to 5 hours
- More than 5 Hours
- By Geography
- North America
- United States
- Canada
- Mexico
- Europe
- United Kingdom
- Germany
- France
- Russia
- Rest of Europe
- Asia-Pacific
- China
- Japan
- India
- South Korea
- Australia
- Rest of Asia-Pacific
- South America
- Brazil
- Rest of South America
- Middle East and Africa
- Middle East
- United Arab Emirates
- Saudi Arabia
- Qatar
- Rest of Middle East
- Africa
- South Africa
- Rest of Africa
- Middle East
- North America
Geography Analysis
North America held 60.94% of the business aviation services market share in 2025, supported by more than 14,000 accessible airports and stable regulatory frameworks that enabled quick, efficient, and transparent clearances. The United States, home to the largest concentration of Fortune 500 headquarters, led regional demand, while Canada and Mexico provided cross-border connectivity for energy, mining, and manufacturing sectors. Pilot shortages and increasing congestion at New York and Washington hubs posed near-term constraints, but digital scheduling tools and secondary-airport strategies mitigated disruption.
Europe remained sizable, though operators faced stringent environmental measures. The ReFuelEU Aviation mandate obliged carriers to blend SAF, prompting Lufthansa to add surcharges of up to EUR 72 per flight in 2025. The United Kingdom, Germany, and France anchored intra-European missions, whereas geopolitical tensions limited Russian activity. Fleet modernization, carbon offset schemes, and optimized routing helped operators maintain service quality under tighter emissions rules.
The Middle East and Africa emerged as the fastest-growing region with a 11.88% CAGR outlook. Saudi Arabia recorded 128 million passengers in 2024 as Vision 2030 reforms opened market access to foreign charter firms. New fixed-base operator (FBO) facilities in Dubai and Riyadh, plus relaxed cabotage rules, encouraged regional network expansion. Africa's mining and infrastructure projects demanded point-to-point connections to remote sites, reinforcing the value proposition of the business aviation services market.
- NetJets IP, LLC
- Flexjet, LLC
- VistaJet Group Holding Limited
- Wheels Up Partners Holdings LLC
- Jet Aviation AG
- ExecuJet Aviation Group AG,
- Jet Linx Aviation, LLC
- XO Global LLC
- Solairus Aviation (Sunset Aviation LLC)
- Luxaviation Management Company
- Skyservice Business Aviation Inc.
- Jetfly
- GESTAIR S.A.U.
- Air Charter Service Group
- Clay Lacy Aviation
- Deer Jet (HNA Group)
- TAG Aviation
Additional Benefits:
- The market estimate (ME) sheet in Excel format
- 3 months of analyst support
TABLE OF CONTENTS
1 INTRODUCTION
- 1.1 Study Assumptions and Market Definition
- 1.2 Scope of the Study
2 RESEARCH METHODOLOGY
3 EXECUTIVE SUMMARY
4 MARKET LANDSCAPE
- 4.1 Market Overview
- 4.2 Market Drivers
- 4.2.1 Post-COVID corporate travel rebound in mid-size and super-mid jet categories
- 4.2.2 Surging fractional-ownership and membership models among SMEs
- 4.2.3 Accelerated replacement cycle driven by SAF-ready aircraft and avionics retrofits
- 4.2.4 Digital charter marketplaces lowering customer acquisition costs
- 4.2.5 UHNW leisure demand for ultra-long-range flights to second-home destinations
- 4.2.6 Corporate sustainability credits earned via SAF book-and-claim programs
- 4.3 Market Restraints
- 4.3.1 Rising operating cost base from pilot shortage wage inflation
- 4.3.2 Airspace congestion and slot curbs at tier-1 business hubs
- 4.3.3 EU-ETS and looming ICAO CORSIA Phase 2 compliance costs
- 4.3.4 OEM delivery delays linked to lithium-ion battery certification bottlenecks
- 4.4 Value Chain Analysis
- 4.5 Regulatory Landscape
- 4.6 Technological Outlook
- 4.7 Porter's Five Forces Analysis
- 4.7.1 Threat of New Entrants
- 4.7.2 Bargaining Power of Buyers
- 4.7.3 Bargaining Power of Suppliers
- 4.7.4 Threat of Substitutes
- 4.7.5 Intensity of Competitive Rivalry
5 MARKET SIZE AND GROWTH FORECASTS (VALUE)
- 5.1 By Ownership Type
- 5.1.1 Charter (On-Demand)
- 5.1.2 Fractional Ownership
- 5.1.3 Jet Card/Membership
- 5.2 By Aircraft Type
- 5.2.1 Light Jet
- 5.2.2 Mid-Size Jet
- 5.2.3 Large Jet
- 5.2.4 Airliners
- 5.3 By End-User
- 5.3.1 Corporate Fleet
- 5.3.2 Private Individual
- 5.3.3 Government and NGO
- 5.4 By Flight Duration
- 5.4.1 Upto 2 hours
- 5.4.2 Between 2 to 5 hours
- 5.4.3 More than 5 Hours
- 5.5 By Geography
- 5.5.1 North America
- 5.5.1.1 United States
- 5.5.1.2 Canada
- 5.5.1.3 Mexico
- 5.5.2 Europe
- 5.5.2.1 United Kingdom
- 5.5.2.2 Germany
- 5.5.2.3 France
- 5.5.2.4 Russia
- 5.5.2.5 Rest of Europe
- 5.5.3 Asia-Pacific
- 5.5.3.1 China
- 5.5.3.2 Japan
- 5.5.3.3 India
- 5.5.3.4 South Korea
- 5.5.3.5 Australia
- 5.5.3.6 Rest of Asia-Pacific
- 5.5.4 South America
- 5.5.4.1 Brazil
- 5.5.4.2 Rest of South America
- 5.5.5 Middle East and Africa
- 5.5.5.1 Middle East
- 5.5.5.1.1 United Arab Emirates
- 5.5.5.1.2 Saudi Arabia
- 5.5.5.1.3 Qatar
- 5.5.5.1.4 Rest of Middle East
- 5.5.5.2 Africa
- 5.5.5.2.1 South Africa
- 5.5.5.2.2 Rest of Africa
- 5.5.5.1 Middle East
- 5.5.1 North America
6 COMPETITIVE LANDSCAPE
- 6.1 Market Concentration
- 6.2 Strategic Moves
- 6.3 Market Share Analysis
- 6.4 Company Profiles (includes Global level Overview, Market level overview, Core Segments, Financials as available, Strategic Information, Market Rank/Share for key companies, Products and Services, and Recent Developments)
- 6.4.1 NetJets IP, LLC
- 6.4.2 Flexjet, LLC
- 6.4.3 VistaJet Group Holding Limited
- 6.4.4 Wheels Up Partners Holdings LLC
- 6.4.5 Jet Aviation AG
- 6.4.6 ExecuJet Aviation Group AG,
- 6.4.7 Jet Linx Aviation, LLC
- 6.4.8 XO Global LLC
- 6.4.9 Solairus Aviation (Sunset Aviation LLC)
- 6.4.10 Luxaviation Management Company
- 6.4.11 Skyservice Business Aviation Inc.
- 6.4.12 Jetfly
- 6.4.13 GESTAIR S.A.U.
- 6.4.14 Air Charter Service Group
- 6.4.15 Clay Lacy Aviation
- 6.4.16 Deer Jet (HNA Group)
- 6.4.17 TAG Aviation
7 MARKET OPPORTUNITIES AND FUTURE OUTLOOK
- 7.1 White-space and Un-met Need Assessment