

|
시장보고서
상품코드
2073385
인공지능(AI) 공급망 : 시장 점유율 분석, 업계 동향 및 통계, 성장 예측(2026-2031년)Artificial Intelligence Supply Chain - Market Share Analysis, Industry Trends & Statistics, Growth Forecasts (2026 - 2031) |
||||||
 Mordor Intelligence
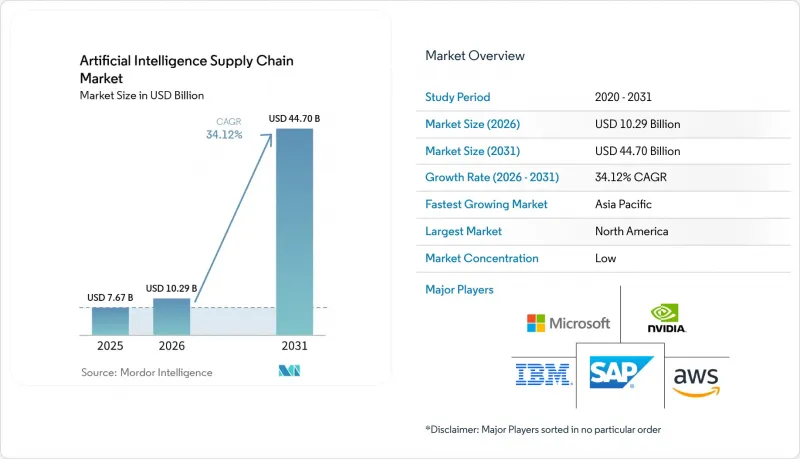
Mordor Intelligence에 의하면, 인공지능(AI) 공급망 시장 규모는 2025년 76억 7,000만 달러로 평가되었습니다. 2026년에는 102억 9,000만 달러로 확대되어 2026년부터 2031년에 걸쳐 CAGR 34.12%로 성장을 지속하여, 2031년에는 447억 달러에 이를 것으로 예측됩니다.
본 보고서에서는 업계를 "제공 형태"(하드웨어, 소프트웨어, 서비스), "기술"(머신러닝, 컴퓨터 비전 등), "용도"(공급망 계획 및 S&OP, 창고·재고 관리 등), '최종 사용자 업계'(제조업, 자동차 업계 등) 및 "지역"별로 분류하고 있습니다. 시장 전망은 금액(달러) 기준으로 제시되어 있습니다.
세계의 인공지능(AI) 공급망 시장 동향 및 인사이트
운영 비용 절감 및 오류 감소
예지 유지보수, 동적 경로 설정, 지능형 할당에 AI를 도입한 기업들은 15-20%의 비용 절감과 거의 완벽한 주문 정확도를 달성하고 있으며, 이를 통해 확보된 여유 자금을 추가적인 AI 프로젝트에 투자할 수 있게 되었습니다. 컴퓨터 비전을 활용하고 있는 자동차 제조업체들은 불량률을 30% 줄였으며, 이러한 재정적 이점이 이산형 및 공정형 산업 전반에 걸쳐 플랫폼 도입을 가속화하는 요인이 되고 있습니다. 여러 시설에 걸쳐 규모의 경제 효과가 시너지 효과를 내며 확대됨에 따라, AI는 경제 변동 속에서도 이익률을 유지하는 중요한 수단으로 자리매김하고 있습니다.
자율 주행 로봇을 통한 창고 처리 능력 향상
생산성이 25-50% 향상되고 사고 건수가 최대 60% 감소한 것은 로봇 시스템의 즉각적인 투자 수익률(ROI)을 입증하고 있습니다. 또한, 새롭게 등장하고 있는 휴머노이드형 로봇은 대규모 시설 개조가 필요 없이, 작업 내용에 구애받지 않는 유연성을 보장합니다. 도입이 가장 활발한 곳은 인건비가 높은 지역이며, 2030년까지 영국의 물류 센터 대부분이 로봇을 도입할 것으로 예측됩니다. 이러한 성과를 통해 투자 회수 기간이 단축되어, 급증하는 전자상거래 수요에 대응할 수 있게 됩니다.
AI 가속기용 GPU공급 부족과 집중화
최고급 GPU의 리드타임은 수 주 단위로 두 자릿수에 달하며, 정가는 4만 달러에 육박하고 있어 기업들은 연산 자원을 배분하고 보다 효율적인 아키텍처를 채택해야 하는 상황에 직면해 있습니다. 기판 제조의 지리적 집중으로 인해 공급 리스크가 확대되고 있어, 기업들은 향후 수년 치 생산 능력을 미리 예약하고 AI 워크로드 배치 전략을 재검토할 수밖에 없는 상황에 처해 있습니다.
부문별 분석
2025년, 소프트웨어 플랫폼은 인공지능(AI) 공급망 시장 점유율의 47.02%를 차지했으며, 이는 기업들이 계획, 실행, 분석을 아우르는 통합 제품군을 선호하는 경향을 반영합니다. 그러나 조직들이 구현, 모델 훈련, 지속적인 최적화 업무를 전문 파트너사에 외주화함에 따라 서비스 매출은 연평균 성장률(CAGR) 18.92%로 증가하고 있습니다. 구현 및 관리형 서비스 제공업체는 기술 인력 부족과 다중 벤더 생태계의 복잡성 덕분에 이점을 얻고 있습니다.
하드웨어는 여전히 시장 점유율이 가장 낮은 분야이지만, 지속되는 GPU 병목 현상으로 인해 그 영향력은 시장 전체에 비해 매우 커지고 있습니다. 공급 부족을 배경으로 TPU나 FPGA와 같은 대체 가속기에 대한 관심이 높아지고 있으며, 이것이 코드 이식 및 모델 압축 서비스에 대한 수요를 견인하고 있습니다. 성능을 저하시키지 않으면서 이종 컴퓨팅 스택을 통합할 수 있는 기업들이 인공지능(AI) 공급망 시장 전체에서 점유율을 확대되고 있습니다.
머신러닝은 2025년에도 37.30%의 점유율을 유지하며, 수요 예측 및 재고 보충 분야에서 기본 분석 엔진으로서의 입지를 공고히 했습니다. 자연어 처리는 계약서 내용을 구조화된 정보로 변환함으로써 조달 자동화를 가속화하는 한편, 컴퓨터 비전은 품질 검사에서 로봇 내비게이션에 이르기까지 그 적용 범위를 확대되고 있습니다.
한편, IoT 텔레메트리가 실시간 최적화 엔진에 데이터를 제공함에 따라, 컨텍스트 인식형 컴퓨팅은 연평균 성장률(CAGR) 22.15%라는 가장 빠른 속도로 성장하고 있습니다. 이러한 시스템은 주변 온도, 장비 상태, 교통 패턴을 바탕으로 의사 결정을 조정하여 거의 즉각적인 경로 수정을 실현합니다. 센서 가격 하락과 엣지 AI 프레임워크의 성숙에 따라, 컨텍스트 인식형 솔루션과 관련된 인공지능(AI) 공급망 시장 규모는 급격히 확대될 것으로 전망됩니다.
지역별 분석
북미는 견조한 벤처 자금 조달과 AI, 클라우드, 엣지 서비스를 턴키 솔루션으로 통합하는 대형 기술 기업들의 존재에 힘입어, 2025년에는 41.25%라는 사상 최고 수준의 인공지능(AI) 공급망 시장 점유율을 기록했습니다. Blue Yonder가 One Network Enterprises를 8억 3,900만 달러에 인수한 사례와 같은 전략적 인수는 엔드투엔드 솔루션에 대한 고객 수요에 힘입어 플랫폼 통합의 물결이 거세지고 있음을 여실히 보여주고 있습니다. 지역 기업들도 조기 규제 명확화의 혜택을 누리고 있으며, 이를 통해 시범 사업의 신속한 시행과 규모 확대가 촉진되고 있습니다.
아시아태평양은 2031년까지 연평균 성장률(CAGR)이 17.9%로, 가장 빠르게 성장하고 있는 지역입니다. 중국, 일본, 한국에서는 국가 프로그램을 통해 AI 인프라에 대한 지원이 이루어지고 있는 반면, 제조업 강국에서는 노동력 부족 문제를 해결하기 위해 에이전트형 AI가 도입되고 있습니다. 또한, 각국 정부는 해외 GPU 공급 위험에 대한 의존도를 낮추기 위해 반도체 자급자족 프로젝트에 자금을 지원하고 있으며, 이러한 노력이 국내 AI 도입을 가속화하는 요인이 되고 있습니다.
유럽에서는 지속가능성과 신뢰성이 높은 AI에 관한 규제가 투명성이 높고 감사 가능한 AI 워크플로우에 대한 수요를 촉진하고 있어, 꾸준한 성장세를 유지하고 있습니다. 기업들은 스코프 3 배출량 추적, 역물류 최적화, 그리고 EU 인공지능법 준수를 목적으로 AI에 투자하고 있습니다. 한편, 라틴아메리카나 아프리카에서의 초기 도입 단계에서는 기본적인 시각화나 수요 계획과 같은 이용 사례에 중점을 두고 있으며, 진입 장벽을 낮추는 클라우드 기반 구독 모델을 통해 제공되는 경우가 많습니다.
기타 혜택 :
- 엑셀 형식 시장 예측(ME) 시트
- 3개월간의 애널리스트 지원
자주 묻는 질문
목차
제1장 서론
제2장 조사 방법
제3장 주요 요약
제4장 시장 구도
제5장 시장 규모 및 성장 예측
제6장 경쟁 구도
제7장 시장 기회 및 향후 전망
KTH 26.07.07According to Mordor Intelligence, the artificial intelligence supply chain market size is expected to grow from USD 7.67 billion in 2025 to USD 10.29 billion in 2026 and is forecast to reach USD 44.7 billion by 2031 at 34.12% CAGR over 2026-2031.
This report Segments the Industry Into by Offering (Hardware, Software, and Services), Technology (Machine Learning, Computer Vision, and More), Application (Supply-Chain Planning and SandOP, Warehouse and Inventory Management, and More), End-User Industry (Manufacturing, Automotive, and More), and Geography. The Market Forecasts are Provided in Terms of Value (USD).
Global Artificial Intelligence Supply Chain Market Trends and Insights
Lower operating costs and error reduction
Enterprises deploying AI for predictive maintenance, dynamic routing, and intelligent allocation report 15-20% cost savings and near-perfect order accuracy, gains that free capital for additional AI projects. Automotive manufacturers using computer vision have cut defect rates by 30%, reinforcing a financial case that accelerates platform rollouts across discrete and process industries. Scaling benefits compound over multiple facilities, positioning AI as an essential lever for margin protection during economic volatility.
Enhanced warehouse throughput via autonomous mobile robots
Productivity jumps of 25-50% and incident reductions up to 60% demonstrate robotic systems' immediate ROI, while emerging humanoid designs promise task-agnostic flexibility without large facility retrofits. Uptake is strongest in high labor-cost regions, with projections that most UK fulfillment centers will add robots by 2030. These gains shorten payback periods and support the growing e-commerce demand surge.
Shortage and concentration of AI accelerator GPUs
Lead times for top-tier GPUs have reached double digits in weeks, with list prices nearing USD 40,000, prompting enterprises to ration compute and adopt more efficient architectures. Supply risk is magnified by geographic clustering of substrate manufacturing, compelling firms to pre-order capacity years ahead and rethink AI workload placement strategies.
Other drivers and restraints analyzed in the detailed report include:
- Surge in Gen-AI copilots for demand forecasting
- Agentic AI for end-to-end self-orchestration
- Expanding AI-specific cyber and model-poisoning threats at the edge
For complete list of drivers and restraints, kindly check the Table Of Contents.
Segment Analysis
Software platforms held 47.02% artificial intelligence supply chain market share in 2025, reflecting enterprises' preference for integrated suites that span planning, execution, and analytics. Yet services revenue is increasing at 18.92% CAGR as organizations outsource implementation, model training, and continuous optimization to specialized partners. Implementation and managed-service providers benefit from skills shortages and the complexity of multi-vendor ecosystems.
Hardware remains the smallest slice but exerts outsized influence due to the ongoing GPU bottleneck. Scarcity has sparked interest in alternative accelerators such as TPUs and FPGAs, which in turn drives demand for code-porting and model-compression services. Firms that can integrate heterogeneous compute stacks without sacrificing performance are capturing share across the artificial intelligence supply chain market.
Machine learning retained 37.30% share in 2025, cementing its status as the default analytic engine for demand prediction and replenishment. Natural language processing accelerates procurement automation by translating contract text into structured insights, while computer vision expands from quality inspection to robotic navigation.
Context-aware computing, however, is scaling fastest at 22.15% CAGR as IoT telemetry feeds real-time optimization engines. These systems adjust decisions based on ambient temperature, equipment health, and traffic patterns, delivering near-instant course corrections. The artificial intelligence supply chain market size linked to context-aware solutions is projected to climb sharply as sensor prices decline and edge-AI frameworks mature.
Complete Report Scope:
- By Offering
- Hardware
- AI accelerator chips (GPU, TPU, ASIC)
- Edge devices and sensors
- Robotics and AMRs
- Software
- AI supply-chain platforms
- Predictive analytics suites
- Services
- Implementation and integration
- Managed and support services
- Hardware
- By Technology
- Machine Learning
- Computer Vision
- Natural Language Processing
- Context-Aware Computing
- Other AI Techniques (Graph, GANs)
- By Application
- Supply-chain planning and SandOP
- Warehouse and inventory management
- Transportation / fleet routing
- Risk and disruption management
- Virtual assistants and chatbots
- Procurement and sourcing optimisation
- By End-User Industry
- Manufacturing
- Automotive
- Food and Beverages
- Healthcare and Life-Sciences
- Retail and E-commerce
- Aerospace and Defence
- Consumer-Packaged Goods
- Other Industries (Energy, Chemicals)
- By Geography
- North America
- United States
- Canada
- Mexico
- South America
- Brazil
- Argentina
- Rest of South America
- Europe
- United Kingdom
- Germany
- France
- Italy
- Spain
- Nordics
- Rest of Europe
- Middle East and Africa
- GCC
- Israel
- South Africa
- Rest of Middle East and Africa
- Asia-Pacific
- China
- India
- Japan
- South Korea
- ASEAN
- Australia
- New Zealand
- Rest of Asia-Pacific
- North America
Geography Analysis
North America captured the highest artificial intelligence supply chain market share at 41.25% in 2025, buoyed by robust venture funding and the presence of technology giants that bundle AI, cloud, and edge services into turnkey offerings. Strategic acquisitions such as Blue Yonder's USD 839 million purchase of One Network Enterprises illustrate a platform-consolidation wave driven by customer demand for end-to-end solutions. Regional enterprises also benefit from early regulatory clarity, supporting faster pilots and scaleouts.
Asia-Pacific is the fastest growing region with an 17.9% CAGR through 2031. National programs in China, Japan, and South Korea subsidize AI infrastructure, while manufacturing powerhouses deploy agentic AI to counter labor shortages. Governments are additionally funding semiconductor self-sufficiency projects to reduce exposure to overseas GPU supply risks, an incentive that accelerates domestic AI adoption.
Europe maintains a steady growth path as sustainability and trustworthy-AI regulations spur demand for transparent, auditable AI workflows. Enterprises invest in AI to track Scope 3 emissions, optimize reverse logistics, and comply with the EU Artificial Intelligence Act. Elsewhere, early-stage deployments in Latin America and Africa focus on basic visibility and demand-planning use cases, often delivered via cloud-based subscription models that lower entry barriers.
- Amazon Web Services, Inc.
- Microsoft Corporation
- IBM Corporation
- SAP SE
- NVIDIA Corporation
- Intel Corporation
- Oracle Corporation
- Alibaba Group Holding Limited
- Deutsche Post DHL Group
- Logility, Inc.
- Blue Yonder Group, Inc.
- Kinaxis Inc.
- C3.ai, Inc.
- Google LLC (Google Cloud)
- Palantir Technologies Inc.
- Zebra Technologies Corporation
- Llamasoft (a Coupa company)
- Salesforce, Inc.
- Accenture plc (supply-chain AI services)
- Snowflake Inc.
Additional Benefits:
- The market estimate (ME) sheet in Excel format
- 3 months of analyst support
TABLE OF CONTENTS
1 INTRODUCTION
- 1.1 Study Assumptions and Market Definition
- 1.2 Scope of the Study
2 RESEARCH METHODOLOGY
3 EXECUTIVE SUMMARY
4 MARKET LANDSCAPE
- 4.1 Market Overview
- 4.2 Market Drivers
- 4.2.1 Lower operating costs and error reduction
- 4.2.2 Enhanced warehouse throughput via autonomous mobile robots
- 4.2.3 Surge in Gen-AI copilots for demand forecasting
- 4.2.4 Agentic AI for end-to-end self-orchestration of supply chains
- 4.2.5 Synthetic data improving supply-planning accuracy
- 4.2.6 Industry-cloud platforms bundling AI and IoT for quick deployment
- 4.3 Market Restraints
- 4.3.1 Shortage and concentration of AI accelerator GPUs
- 4.3.2 Fragmented, poor-quality legacy data silos
- 4.3.3 Expanding AI-specific cyber and model-poisoning threats at the edge
- 4.3.4 Emerging global and state-level trustworthy-AI regulations
- 4.4 Evaluation of Critical Regulatory Framework
- 4.5 Technological Outlook
- 4.6 Porter's Five Forces
- 4.6.1 Bargaining Power of Suppliers
- 4.6.2 Bargaining Power of Buyers
- 4.6.3 Threat of New Entrants
- 4.6.4 Threat of Substitutes
- 4.6.5 Competitive Rivalry
- 4.7 Impact Assessment of Key Stakeholders
- 4.8 Key Use Cases and Case Studies
- 4.9 Impact on Macroeconomic Factors of the Market
- 4.10 Investment Analysis
5 MARKET SIZE AND GROWTH FORECAST (VALUE)
- 5.1 By Offering
- 5.1.1 Hardware
- 5.1.1.1 AI accelerator chips (GPU, TPU, ASIC)
- 5.1.1.2 Edge devices and sensors
- 5.1.1.3 Robotics and AMRs
- 5.1.2 Software
- 5.1.2.1 AI supply-chain platforms
- 5.1.2.2 Predictive analytics suites
- 5.1.3 Services
- 5.1.3.1 Implementation and integration
- 5.1.3.2 Managed and support services
- 5.1.1 Hardware
- 5.2 By Technology
- 5.2.1 Machine Learning
- 5.2.2 Computer Vision
- 5.2.3 Natural Language Processing
- 5.2.4 Context-Aware Computing
- 5.2.5 Other AI Techniques (Graph, GANs)
- 5.3 By Application
- 5.3.1 Supply-chain planning and SandOP
- 5.3.2 Warehouse and inventory management
- 5.3.3 Transportation / fleet routing
- 5.3.4 Risk and disruption management
- 5.3.5 Virtual assistants and chatbots
- 5.3.6 Procurement and sourcing optimisation
- 5.4 By End-User Industry
- 5.4.1 Manufacturing
- 5.4.2 Automotive
- 5.4.3 Food and Beverages
- 5.4.4 Healthcare and Life-Sciences
- 5.4.5 Retail and E-commerce
- 5.4.6 Aerospace and Defence
- 5.4.7 Consumer-Packaged Goods
- 5.4.8 Other Industries (Energy, Chemicals)
- 5.5 By Geography
- 5.5.1 North America
- 5.5.1.1 United States
- 5.5.1.2 Canada
- 5.5.1.3 Mexico
- 5.5.2 South America
- 5.5.2.1 Brazil
- 5.5.2.2 Argentina
- 5.5.2.3 Rest of South America
- 5.5.3 Europe
- 5.5.3.1 United Kingdom
- 5.5.3.2 Germany
- 5.5.3.3 France
- 5.5.3.4 Italy
- 5.5.3.5 Spain
- 5.5.3.6 Nordics
- 5.5.3.7 Rest of Europe
- 5.5.4 Middle East and Africa
- 5.5.4.1 GCC
- 5.5.4.2 Israel
- 5.5.4.3 South Africa
- 5.5.4.4 Rest of Middle East and Africa
- 5.5.5 Asia-Pacific
- 5.5.5.1 China
- 5.5.5.2 India
- 5.5.5.3 Japan
- 5.5.5.4 South Korea
- 5.5.5.5 ASEAN
- 5.5.5.6 Australia
- 5.5.5.7 New Zealand
- 5.5.5.8 Rest of Asia-Pacific
- 5.5.1 North America
6 COMPETITIVE LANDSCAPE
- 6.1 Market Concentration
- 6.2 Strategic Moves
- 6.3 Market Share Analysis
- 6.4 Company Profiles (includes Global level Overview, Market level overview, Core Segments, Financials as available, Strategic Information, Market Rank/Share for key companies, Products and Services, and Recent Developments)
- 6.4.1 Amazon Web Services, Inc.
- 6.4.2 Microsoft Corporation
- 6.4.3 IBM Corporation
- 6.4.4 SAP SE
- 6.4.5 NVIDIA Corporation
- 6.4.6 Intel Corporation
- 6.4.7 Oracle Corporation
- 6.4.8 Alibaba Group Holding Limited
- 6.4.9 Deutsche Post DHL Group
- 6.4.10 Logility, Inc.
- 6.4.11 Blue Yonder Group, Inc.
- 6.4.12 Kinaxis Inc.
- 6.4.13 C3.ai, Inc.
- 6.4.14 Google LLC (Google Cloud)
- 6.4.15 Palantir Technologies Inc.
- 6.4.16 Zebra Technologies Corporation
- 6.4.17 Llamasoft (a Coupa company)
- 6.4.18 Salesforce, Inc.
- 6.4.19 Accenture plc (supply-chain AI services)
- 6.4.20 Snowflake Inc.
7 MARKET OPPORTUNITIES AND FUTURE OUTLOOK
- 7.1 White-space and Unmet-need Assessment


