|
시장보고서
상품코드
2073466
연료전지 : 시장 점유율 분석, 업계 동향 및 통계, 성장 예측(2026-2031년)Fuel Cell - Market Share Analysis, Industry Trends & Statistics, Growth Forecasts (2026 - 2031) |
||||||
 Mordor Intelligence
Mordor Intelligence에 의하면, 연료전지 시장 규모는 2025년에 81억 9,000만 달러로 평가되었습니다. 2026년 104억 2,000만 달러에서 2031년까지 506억 4,000만 달러에 이를 것으로 예상되며, 예측 기간(2026-2031년) CAGR은 37.19%를 나타낼 전망입니다.
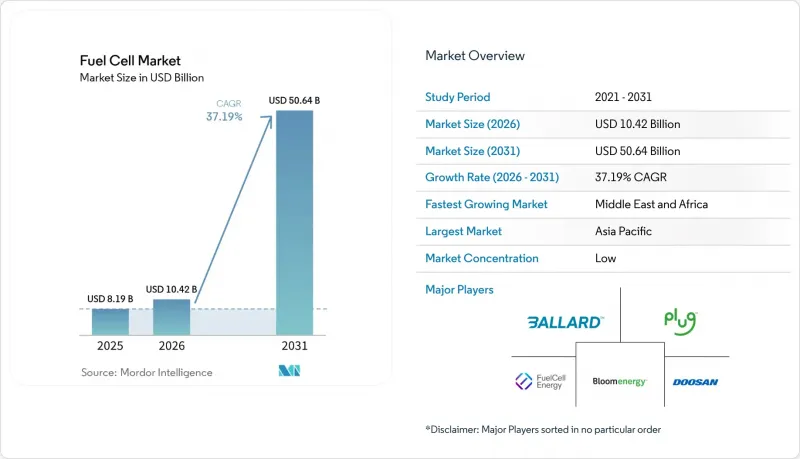
본 보고서는 기술별(고분자 전해질막형 연료전지, 고체 산화물형 연료전지, 알칼리형 연료전지, 기타), 연료 유형별(수소, 천연가스, 암모니아, 기타), 용도(자동차용 및 비자동차용), 최종 사용자 산업(운송, 유틸리티, 상업 및 산업, 기타), 지역(북미, 유럽, 아시아태평양, 남미, 중동 및 아프리카)별로 분류되어 있습니다.
세계의 연료전지 시장 동향 및 인사이트
그린 수소와 청색 수소의 제조 비용 감소
전해조의 설비 투자액은 2025년에 1kW당 2,100달러까지 하락했고, 2030년까지 1,494달러에 달할 것으로 예측되며, 이에 따라 태양광 발전이 풍부한 지역에서는 수소의 균등화 가격이 1Kg당 2달러 미만으로 떨어질 전망입니다. 이러한 추세로 인해 디젤 및 천연가스와의 가격 차이가 줄어들면서, 지게차, 통신탑, 분산형 발전과 같은 부문에 새로운 기회가 창출될 것입니다. 1Kg당 1.50-2.50달러인 블루 수소는 저비용 가스를 이용할 수 있는 지역에서는 여전히 경제성을 확보하고 있으며, 재생에너지 공급이 확대될 때까지 가교 역할을 수행합니다. 사우디아라비아의 일일 생산 능력 600톤을 갖춘 NEOM 복합 시설과 같은 정부 지원 프로젝트는 초기 단계의 기가 스케일 시설이 안고 있는 위험을 완화하고 수출의 기준을 확립합니다. 이에 더해, 재생에너지 출력 억제(캘리포니아주에서는 2024년에 2.4 TWh가 감축되었습니다)로 인해 전력 가격이 마이너스가 되는 시간대가 생겨나며, 이는 수소 비용을 더욱 낮추게 됩니다. 이러한 동향들이 맞물리면서, 모빌리티 및 고정형 이용 사례에서 연료전지 시장의 경제성이 강화될 것입니다.
아시아태평양 자동차 제조업체들의 FCEV 관련 노력
도요타는 2030년까지 연간 7만 5,000대의 수소연료전지차 생산을 목표로 하고 있으며, 현대자동차는 2027년까지 연간 3만 대 생산을 목표로 9,300억 원을 투자해 공장을 건설 중입니다. 이러한 움직임은 단기적인 소매 시장의 침체(2025년 상반기 한국의 FCEV 판매 대수는 27.2% 감소)에도 불구하고, 장기적인 자신감을 보여주고 있습니다. 도요타의 3세대 스택은 내구성을 2배인 1만 시간으로 연장하고, 백금 사용량을 30% 줄임으로써 대형 트럭의 총 소유 비용을 절감했습니다. 중국에서는 차량 1대당 최대 30만 위안 규모의 지방 정부 인센티브가 중앙 정부의 보조금 단계적 폐지를 일부 상쇄하고 있어, 버스 및 물류 분야의 자사 소유 차량 도입이 유지되고 있습니다. 전반적으로, 탄탄한 생산 능력이 공급망 투자를 뒷받침하며, 연료전지 시장 규모 확대를 촉진하고 있습니다.
일본과 한국 이외 지역의 수소 충전 인프라 부족
일본에는 160곳, 한국에는 200곳의 수소 충전소가 운영되고 있는 반면, 미국에는 고작 60곳(그중 대부분이 캘리포니아주)에 불과하며, 유럽에는 250곳(그중 40%가 독일)이 있습니다. 이러한 불균형한 인프라 구축 상황으로 인해 승용차 이용은 차량 대여 업체나 시범 지역으로 한정되어, 보다 광범위한 보급이 저해되고 있습니다. 중국에는 500곳의 기지가 있지만, 지역적으로 해안 지역의 거점에 편중되어 있어 내륙 지방에서는 서비스가 미흡합니다. 한 곳당 200만-400만 달러의 자본 비용과 높은 수소 공급 가격이 민간 투자자들의 신중한 태도를 불러일으키고 있습니다. 2024년 공급 부족 사태 당시 캘리포니아주에서 15곳의 충전소가 일시적으로 폐쇄된 것은 소비자들의 신뢰를 훼손했으며, 도입 초기 단계의 취약점을 여실히 드러냈습니다.
부문별 분석
고분자 전해질 막(PEM) 방식은 자동차 부문에서 압도적인 시장 점유율을 기록하며, 2025년 매출의 70.1%를 차지했습니다. 그러나 전력 회사들이 60%의 전기 효율과 연료의 유연성을 중시하고 있는 만큼, 고체 산화물(SOX) 방식은 2031년까지 연평균 성장률(CAGR) 48.1%를 달성할 것으로 예상되며, 이는 PEM 방식의 2배에 달하는 성장 속도입니다. 블룸 에너지(Bloom Energy)의 플랫폼은 현재 천연가스로 가동되고 있지만, 100% 수소로 전환이 가능하며, 인프라 측면의 장벽을 낮춥니다. 알칼리계 시스템은 4.2%의 시장 점유율을 차지하고 있지만, 그 용도는 항공우주 및 잠수함 프로젝트로 한정되어 있습니다. 인산형, 용융 탄산염형, 직접 메탄올형 연료전지가 나머지 시장 점유율을 차지하고 있지만, 가스 엔진 및 리튬이온 축전지와 경쟁하고 있습니다. Ceres Power의 스틸 셀 구조와 같이, 제조 비용을 40% 절감하는 혁신 기술 덕분에 연료전지 시장의 기술 선택의 폭이 점차 넓어지고 있습니다.
수소는 2025년 수요의 65.3%를 공급했으며, 기존 생산 인프라와 폭넓은 스택 호환성이 그 기반이 되었습니다. 천연가스에서 생산된 수소는 도입 건수의 26.9%를 차지하고 있으며, 그 대부분은 북미의 고정형 SOFC 어레이에 도입되어 있습니다. 이곳은 파이프라인이 잘 갖춰져 있어 공급 비용이 저렴합니다. 암모니아는 기준치에서 8%를 차지하지만, 해운사들이 탄소 제로 연료로의 전환을 추진함에 따라 연평균 성장률(CAGR) 51.8%가 예상됩니다. 일본우편선(NYK)과 삼성중공업은 전 세계 암모니아 무역 네트워크를 활용하여 2028년까지 암모니아를 연료로 사용하는 SOFC 탑재 선박을 취항시킬 예정입니다. 메탄올과 바이오가스는 틈새 시장에서 역할을 담당하고 있지만, 보다 광범위한 연료전지 시장에서 규모를 확대하기 위해서는 각각 효율성과 불순물 관련 과제를 극복해야 합니다.
지역별 분석
아시아태평양은 2025년에 매출의 57.5%를 차지했으며, 2031년까지 연평균 성장률(CAGR) 36.8%로 성장할 것으로 전망됩니다. 일본에서는 160곳의 수소 충전소와 40만 가구가 도입을 주도하고 있으며, 한국에서는 5,000억 원을 투자한 수소 로드맵이 국내 공급업체를 지원하고 있습니다. 중국에서는 500곳에 달하는 충전소 네트워크와 각 성의 보조금 덕분에, 소매 시장의 침체에도 불구하고 버스 및 물류 차량의 도입이 뒷받침되고 있습니다. 인도와 동남아시아는 인프라 면에서 뒤처져 있지만, 호주는 재생에너지의 잉여를 바탕으로 미래의 수출 거점으로서의 위상을 확립해 가고 있습니다. 토요타가 사업을 확대하는 반면 혼다는 축소하는 등, OEM 업체들의 전략이 엇갈리고 있는 점은 시장에 대한 신뢰도가 고르지 않음을 여실히 보여주고 있지만, 전반적으로는 연료전지 시장에서 지역별 리더십을 강화하고 있습니다.
북미는 2025년에 매출의 22.3%를 차지하며, 연평균 성장률(CAGR) 34.2%를 나타냈습니다. 캘리포니아주는 60곳의 충전소와 차량 1대당 24만 달러의 구매 보조금을 중심으로 인프라를 구축하고 있으며, 연방 정부가 제공하는 수소 1kg당 3달러의 세액 공제가 이를 보완하고 있습니다. 플러그파워의 지게차 생태계가 자재 운반 부문을 주도하는 반면, 니콜라는 장거리 화물 운송을 대상으로 하고 있습니다. 캐나다에서는 40%의 투자 세액 공제를 통해 수력 자원을 활용한 그린 수소 생산이 촉진되고 있지만, 밴쿠버나 토론토 이외의 지역에서는 수소 충전소 네트워크가 여전히 미비한 실정입니다. 멕시코의 초기 노력은 국경을 넘는 트럭 운송 회랑에 중점을 두고 있습니다. 정책의 지속성과 전해조의 비용 절감이 이 지역의 향후 발전 방향을 좌우할 것으로 보입니다.
2025년, 유럽의 점유율은 15.8%였습니다. 독일의 100개 충전소와 IPCEI Hy2Tech의 자금 지원이 선도적 입지를 뒷받침했으며, 규정 2024/1610에 따라 트럭 분야로의 도입이 가속화되었습니다. 북유럽 국가들은 재생에너지의 잉여 전력을 활용하여 수출 지향적인 그린 수소를 생산하고 있습니다. 니더작센주와 롬바르디아주에 운행 중인 알스톰사의 열차는 철도 견인 분야에서의 적용 가능성을 입증하고 있습니다. 영국과 프랑스는 전략의 차이를 반영하여 도입 밀도 면에서 다른 국가들에 뒤처져 있습니다. 중동 및 아프리카는 4.4%의 점유율을 차지하고 있지만, 2026-2027년 가동을 목표로 하는 84억 달러 규모의 NEOM 프로젝트와 10억 달러 규모의 마스다르·ADNOC 복합 시설에 힘입어 연평균 성장률(CAGR) 38.7%로 가장 빠르게 성장할 전망입니다. 남미는 2.5%의 점유율에 그쳐 여전히 초기 단계에 머물러 있습니다. 칠레와 브라질은 내수 소비국이라기보다는 수출 공급국으로서의 입지를 공고히 하고 있습니다.
기타 혜택
- 엑셀 형식 시장 예측(ME) 시트
- 3개월간의 애널리스트 지원
자주 묻는 질문
목차
제1장 서론
제2장 조사 방법
제3장 주요 요약
제4장 시장 구도
제5장 시장 규모 및 성장 예측
제6장 경쟁 구도
제7장 시장 기회 및 향후 전망
KTH 26.07.08According to Mordor Intelligence, the fuel cell market size was valued at USD 8.19 billion in 2025 and is estimated to grow from USD 10.42 billion in 2026 to reach USD 50.64 billion by 2031, at a CAGR of 37.19% during the forecast period (2026-2031).
This report is Segmented by Technology (Polymer Electrolyte Membrane Fuel Cell, Solid Oxide Fuel Cell, Alkaline Fuel Cell, and Others), Fuel Type (Hydrogen, Natural Gas, Ammonia, and Others), Application (Vehicular and Non-Vehicular), End-User Industry (Transportation, Utilities, Commercial and Industrial, and Others), and Geography (North America, Europe, Asia-Pacific, South America, and Middle East and Africa).
Global Fuel Cell Market Trends and Insights
Falling Costs of Green & Blue Hydrogen Generation
Electrolyzer capital expenditure declined to USD 2,100 per kilowatt in 2025 and is projected to hit USD 1,494 by 2030, pushing levelized hydrogen prices below USD 2 per kilogram in solar-rich zones. This trajectory narrows the parity gap with diesel and natural gas, unlocking new opportunities for forklifts, telecom towers, and distributed generation. Blue hydrogen at USD 1.50-2.50 per kilogram remains viable where low-cost gas is available, offering a bridge until renewable supply scales. Sovereign-backed projects such as Saudi Arabia's 600-tons-per-day NEOM complex de-risk early giga-scale facilities and create export benchmarks. Complementary renewable curtailment (California shed 2.4 TWh in 2024) provides negative-priced electricity windows that further lower hydrogen costs. Together, these trends strengthen fuel cell market economics across mobility and stationary use cases.
Automaker Commitments to FCEVs in Asia-Pacific
Toyota targets 75,000 annual fuel cell units by 2030, and Hyundai is building a KRW 930 billion plant aiming for 30,000 units a year by 2027. These moves signal long-term confidence despite near-term retail softness; South Korean FCEV sales fell 27.2% in H1 2025. Third-generation Toyota stacks doubled durability to 10,000 hours and cut platinum loadings by 30%, trimming total cost of ownership for heavy trucks. Chinese provincial incentives of up to RMB 300,000 per vehicle partially offset the national subsidy phase-out, keeping captive bus and logistics fleets in play. Overall, committed production capacity anchors supply-chain investment and propels the fuel cell market toward scale.
Scarcity of Hydrogen Refueling Infrastructure Outside Japan & South Korea
Japan operates 160 stations and South Korea 200, while the United States fields just 60, nearly all in California, and Europe tallies 250, with 40% in Germany. This uneven build-out confines passenger cars to fleet and pilot regions, suppressing broader adoption. China has 500 stations, but geography skews to coastal hubs, leaving inland provinces underserved. Capital costs of USD 2-4 million per site and high delivered hydrogen prices keep private investors cautious. California's temporary closure of 15 stations during supply shortages in 2024 damaged consumer confidence, illustrating fragility at early rollout stages.
Other drivers and restraints analyzed in the detailed report include:
- Government Zero-Emission Mandates in Heavy-Duty Transport
- Demand for Long-Duration Backup Power in Data Centers
- PGM & Nickel Price Volatility Inflating Stack Costs
For complete list of drivers and restraints, kindly check the Table Of Contents.
Segment Analysis
Polymer electrolyte membrane designs delivered 70.1% of 2025 revenue by virtue of automotive dominance. However, solid oxide solutions are expected to realize a 48.1% CAGR to 2031, twice the pace of PEM, as utilities value 60% electrical efficiency and fuel flexibility. Bloom Energy's platform operates on natural gas today and can transition to 100% hydrogen, lowering infrastructure hurdles. Alkaline systems hold a 4.2% share, confined to aerospace and submarine projects. Phosphoric acid, molten carbonate, and direct-methanol cells comprise the remainder but face competition from gas engines and lithium-ion storage. Innovations such as Ceres Power's steel-cell architecture, which reduces manufacturing cost by 40%, are widening technology choices in the fuel cell market.
Hydrogen supplied 65.3% of 2025 demand, undergirded by existing production infrastructure and broad stack compatibility. Natural-gas-derived hydrogen supports 26.9% of installations, mostly within North American stationary SOFC arrays, where pipeline availability lowers delivered costs. Ammonia, at an 8% baseline, is positioned for a 51.8% CAGR as maritime operators pivot toward zero-carbon bunkers. NYK Line and Samsung Heavy Industries expect to deploy ammonia-fueled SOFC vessels by 2028, leveraging a global ammonia trade network. Methanol and biogas occupy niche roles; each must overcome efficiency and impurity challenges before scaling within the wider fuel cell market.
Complete Report Scope:
- By Technology
- Polymer Electrolyte Membrane Fuel Cell (PEMFC)
- Solid Oxide Fuel Cell (SOFC)
- Alkaline Fuel Cell (AFC)
- Others [Phosphoric Acid Fuel Cell (PAFC), Molten Carbonate Fuel Cell (MCFC), Direct Methanol Fuel Cell (DMFC)]
- By Fuel Type
- Hydrogen
- Natural Gas/Methane
- Ammonia
- Others (Methanol, Biogas)
- By Application
- Vehicular (Passenger Cars, Buses & Coaches, Trucks, Material Handling Equipment, Rail, Marine Vessels)
- Non-Vehicular (Stationary Power, Portable Power, Micro-Combined Heat & Power)
- By End-User Industry
- Transportation
- Utilities
- Commercial and Industrial
- Others (Defense, Residential)
- By Geography
- North America
- United States
- Canada
- Mexico
- Europe
- United Kingdom
- Germany
- France
- Spain
- NORDIC Countries
- Russia
- Rest of Europe
- Asia-Pacific
- China
- India
- Japan
- South Korea
- Malaysia
- Thailand
- Indonesia
- Vietnam
- Australia
- Rest of Asia-Pacific
- South America
- Brazil
- Argentina
- Colombia
- Rest of South America
- Middle East and Africa
- United Arab Emirates
- Saudi Arabia
- South Africa
- Rest of Middle East and Africa
- North America
Geography Analysis
Asia-Pacific secured 57.5% of revenue in 2025 and is forecast to compound at a 36.8% CAGR through 2031. Japan's 160 refueling stations and 400,000 residential units spearhead adoption, while South Korea's KRW 500 billion hydrogen roadmap backs domestic suppliers. China's 500-station network and provincial subsidies sustain bus and logistics fleets amid retail softness. India and Southeast Asia trail in infrastructure, yet Australia's renewable surplus positions it as a future export hub. Divergent OEM strategies - with Toyota expanding while Honda scales back - underscore uneven market confidence but collectively reinforce regional leadership within the fuel cell market.
North America accounted for 22.3% revenue in 2025 and is expected to grow at a 34.2% CAGR. California anchors infrastructure with 60 stations and USD 240,000 vehicle vouchers, complemented by the federal USD 3-per-kilogram hydrogen production credit. Plug Power's forklift ecosystem dominates material handling, while Nikola targets long-haul freight. Canada's 40% investment credit leverages hydro resources for green hydrogen, yet station networks outside Vancouver and Toronto remain sparse. Mexico's early initiatives focus on cross-border trucking corridors. Policy continuity and electrolyzer cost declines will shape the region's trajectory.
Europe held a 15.8% share in 2025. Germany's 100 stations and IPCEI Hy2Tech funding underpin leadership, while Regulation 2024/1610 accelerates truck adoption. Nordic countries leverage renewable surpluses for export-oriented green hydrogen. Alstom's trains in Lower Saxony and Lombardy validate rail traction. The UK and France trail in deployment density, reflecting fragmented strategies. The Middle East and Africa, at 4.4% share, will grow fastest at 38.7% CAGR, propelled by the USD 8.4 billion NEOM and USD 1 billion Masdar-ADNOC complexes that target 2026-2027 commissioning. South America, at a 2.5% share, remains an early stage, with Chile and Brazil positioning as export suppliers rather than domestic consumers.
- Ballard Power Systems Inc.
- Plug Power Inc.
- FuelCell Energy Inc.
- Bloom Energy Corporation
- Doosan Fuel Cell Co., Ltd.
- Cummins Inc. (Hydrogenics)
- Toshiba Energy Systems & Solutions Corp.
- Panasonic Corporation
- Horizon Fuel Cell Technologies Pte. Ltd.
- Intelligent Energy Ltd.
- Nuvera Fuel Cells, LLC
- SFC Energy AG
- Mitsubishi Power Ltd.
- Hyundai Mobis Co., Ltd.
- Toyota Motor Corporation
- Nikola Corporation
- Ceres Power Holdings plc
- Ballard Motive Solutions Ltd.
- PowerCell Sweden AB
- AFC Energy plc
- Advent Technologies Holdings Inc.
- Gencell Ltd.
- Proton Motor Power Systems plc
Additional Benefits:
- The market estimate (ME) sheet in Excel format
- 3 months of analyst support
TABLE OF CONTENTS
1 Introduction
- 1.1 Study Assumptions & Market Definition
- 1.2 Scope of the Study
2 Research Methodology
3 Executive Summary
4 Market Landscape
- 4.1 Market Overview
- 4.2 Recent Trends & Developments
- 4.3 Market Drivers
- 4.3.1 Falling Costs of Green & Blue Hydrogen Generation
- 4.3.2 Automaker Commitments to FCEVs in Asia-Pacific
- 4.3.3 Government Zero-Emission Mandates in Heavy-Duty Transport (NA & EU)
- 4.3.4 Demand for Long-Duration Backup Power in Data Centers
- 4.3.5 Maritime Decarbonization Targets Accelerating Fuel Cell Adoption
- 4.3.6 Corporate Net-Zero Investment into On-Site Distributed Generation
- 4.4 Market Restraints
- 4.4.1 Scarcity of Hydrogen Refueling Infrastructure Outside JP & KR
- 4.4.2 PGM & Nickel Price Volatility Inflating Stack Costs
- 4.4.3 SOFC Performance Degradation in Maritime High-Sulfur Environments
- 4.4.4 Certification Gaps in US Building Codes Slowing Stationary Installations
- 4.5 Supply-Chain Analysis
- 4.6 Regulatory Outlook
- 4.7 Technological Outlook
- 4.8 Porte's Five Forces
- 4.8.1 Bargaining Power of Suppliers
- 4.8.2 Bargaining Power of Consumers
- 4.8.3 Threat of New Entrants
- 4.8.4 Threat of Substitute Products & Services
- 4.8.5 Intensity of Competitive Rivalry
5 Market Size & Growth Forecasts
- 5.1 By Technology
- 5.1.1 Polymer Electrolyte Membrane Fuel Cell (PEMFC)
- 5.1.2 Solid Oxide Fuel Cell (SOFC)
- 5.1.3 Alkaline Fuel Cell (AFC)
- 5.1.4 Others [Phosphoric Acid Fuel Cell (PAFC), Molten Carbonate Fuel Cell (MCFC), Direct Methanol Fuel Cell (DMFC)]
- 5.2 By Fuel Type
- 5.2.1 Hydrogen
- 5.2.2 Natural Gas/Methane
- 5.2.3 Ammonia
- 5.2.4 Others (Methanol, Biogas)
- 5.3 By Application
- 5.3.1 Vehicular (Passenger Cars, Buses & Coaches, Trucks, Material Handling Equipment, Rail, Marine Vessels)
- 5.3.2 Non-Vehicular (Stationary Power, Portable Power, Micro-Combined Heat & Power)
- 5.4 By End-User Industry
- 5.4.1 Transportation
- 5.4.2 Utilities
- 5.4.3 Commercial and Industrial
- 5.4.4 Others (Defense, Residential)
- 5.5 By Geography
- 5.5.1 North America
- 5.5.1.1 United States
- 5.5.1.2 Canada
- 5.5.1.3 Mexico
- 5.5.2 Europe
- 5.5.2.1 United Kingdom
- 5.5.2.2 Germany
- 5.5.2.3 France
- 5.5.2.4 Spain
- 5.5.2.5 NORDIC Countries
- 5.5.2.6 Russia
- 5.5.2.7 Rest of Europe
- 5.5.3 Asia-Pacific
- 5.5.3.1 China
- 5.5.3.2 India
- 5.5.3.3 Japan
- 5.5.3.4 South Korea
- 5.5.3.5 Malaysia
- 5.5.3.6 Thailand
- 5.5.3.7 Indonesia
- 5.5.3.8 Vietnam
- 5.5.3.9 Australia
- 5.5.3.10 Rest of Asia-Pacific
- 5.5.4 South America
- 5.5.4.1 Brazil
- 5.5.4.2 Argentina
- 5.5.4.3 Colombia
- 5.5.4.4 Rest of South America
- 5.5.5 Middle East and Africa
- 5.5.5.1 United Arab Emirates
- 5.5.5.2 Saudi Arabia
- 5.5.5.3 South Africa
- 5.5.5.4 Rest of Middle East and Africa
- 5.5.1 North America
6 Competitive Landscape
- 6.1 Market Concentration
- 6.2 Strategic Moves (M&A, Partnerships, PPAs)
- 6.3 Market Share Analysis (Market Rank/Share for key companies)
- 6.4 Company Profiles (includes Global level Overview, Market level overview, Core Segments, Financials as available, Strategic Information, Products & Services, and Recent Developments)
- 6.4.1 Ballard Power Systems Inc.
- 6.4.2 Plug Power Inc.
- 6.4.3 FuelCell Energy Inc.
- 6.4.4 Bloom Energy Corporation
- 6.4.5 Doosan Fuel Cell Co., Ltd.
- 6.4.6 Cummins Inc. (Hydrogenics)
- 6.4.7 Toshiba Energy Systems & Solutions Corp.
- 6.4.8 Panasonic Corporation
- 6.4.9 Horizon Fuel Cell Technologies Pte. Ltd.
- 6.4.10 Intelligent Energy Ltd.
- 6.4.11 Nuvera Fuel Cells, LLC
- 6.4.12 SFC Energy AG
- 6.4.13 Mitsubishi Power Ltd.
- 6.4.14 Hyundai Mobis Co., Ltd.
- 6.4.15 Toyota Motor Corporation
- 6.4.16 Nikola Corporation
- 6.4.17 Ceres Power Holdings plc
- 6.4.18 Ballard Motive Solutions Ltd.
- 6.4.19 PowerCell Sweden AB
- 6.4.20 AFC Energy plc
- 6.4.21 Advent Technologies Holdings Inc.
- 6.4.22 Gencell Ltd.
- 6.4.23 Proton Motor Power Systems plc
7 Market Opportunities & Future Outlook
- 7.1 White-space & Unmet-Need Assessment