

|
시장보고서
상품코드
2073470
방사선 검사 장비 : 시장 점유율 분석, 업계 동향 및 통계, 성장 예측(2026-2031년)Radiography Test Equipment - Market Share Analysis, Industry Trends & Statistics, Growth Forecasts (2026 - 2031) |
||||||
 Mordor Intelligence
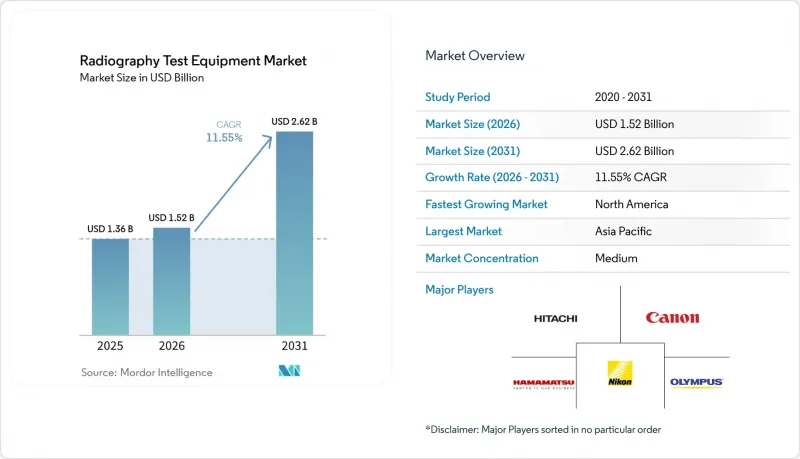
Mordor Intelligence에 의하면, 2026년 방사선 검사 장비 시장 규모는 15억 2,000만 달러에 달할 것으로 예상됩니다. 2025년 13억 6,000만 달러에서 확대해, 2031년에는 26억 2,000만 달러에 이를 것으로 예측됩니다.
2026년부터 2031년까지 연평균 성장률(CAGR) 11.55%로 성장할 것으로 전망됩니다.
본 보고서는 기술별(필름 방사선 검사, 컴퓨터 방사선 검사, 기타), 구성 요소별(하드웨어/장비, 소프트웨어, 서비스), 용도별(용접 검사, 부식·침식 모니터링, 기타), 최종 사용자 산업별(항공우주 및 방위, 에너지·발전, 기타), 지역별로 분류되어 있습니다. 시장 전망은 금액(달러) 기준으로 제시되어 있습니다.
세계의 방사선 검사 장비 시장 동향 및 인사이트
휴대용 디지털 RT 시스템의 보급 확대
휴대용 디지털 방사선 촬영은 몇 시간이 소요되는 필름 현상 대신, 현장에서 미세한 균열을 드러내는 고대비 이미지를 즉시 얻을 수 있어 현장 검사의 경제성을 획기적으로 개선하고 있습니다. 고성능 평판 검출기는 무선 연결 기능과 견고한 외장을 모두 갖추고 있어, 파이프라인 작업자와 해양 기술자들은 불과 몇 분 만에 용접부의 건전성을 확인하고, 암호화된 결과를 클라우드 서버에 업로드하여 일원적으로 검토할 수 있게 되었습니다. 암실이 필요 없어짐에 따라 유해 화학물질의 폐기도 불필요해지며, 규정 준수에 드는 총비용이 절감되고, 넷제로 의무 요건도 충족하게 됩니다. 이용 빈도가 높은 사용자의 경우 투자 회수 기간이 24개월 이하로 단축되어, 까다로운 프로젝트 일정을 소화해야 하는 도급업체에게 휴대용 시스템으로의 업그레이드는 수월한 일이 되었습니다. 부품 가격 하락과 감지기의 감도 향상에 따라, 도입은 초기 단계였던 북미 및 유럽의 사용자들로부터 물류상의 장벽이 가장 높은 라틴아메리카와 동남아시아의 에너지 회랑으로 확대되고 있습니다.
항공우주 부문에서 복합재료 검사량의 급증
민간 로켓 발사 업체와 민간 항공기 OEM 각사는 주요 하중 지지부인 탄소섬유 부품에 대한 컴퓨터 단층촬영(CT) 스캔을 표준화하고 있으며, 항공기 1대당 총 스캔 시간은 사상 최고 수준에 달하고 있습니다. 다층 적층, 벽 두께 변동, 금속 메쉬로 제작된 낙뢰 보호 장치 등에 대응하기 위해서는 서브 mm 단위의 공극을 파악할 수 있는 3D 데이터 세트가 필요합니다. 450 kV X선원을 탑재한 휴대용 CT 갠트리는 현재 조립 현장에 직접 반입되고 있어, 예약이 쇄도하고 있는 고정 설비의 일정상 병목 현상을 피하고 있습니다. 그 결과, 초기 제품 검사 처리 능력이 향상됨에 따라 OEM 각사는 안전 여유를 희생하지 않으면서도 구조 중량을 20% 줄일 수 있는 새로운 소재 시스템을 자신 있게 확대 적용할 수 있게 되었습니다. 아시아태평양에서 급성장하고 있는 복합재료 공급망 역시, 1차 공급업체의 기체 및 엔진 나셀 계약을 수주하기 위해 이러한 기준을 빠르게 도입하고 있습니다.
특히 CT 스캐너의 높은 보유 비용
고에너지 산업용 CT 장비는 일반적으로 50만 달러를 초과하며, 차폐, 교정, 숙련된 작업자의 인건비 등으로 인해 10년 동안 그 비용이 2배로 늘어날 수도 있습니다. 동남아시아와 아프리카의 소규모 검사 기관들은 위탁 검사 기관이나 이동식 서비스 제공업체를 선호하는 경향이 있으며, 이로 인해 직접 구매의 확대가 주춤하고 있습니다. 리스 모델이나 스캔당 과금 방식의 플랫폼은 비용 대비 효과의 격차를 부분적으로 해소하고 있지만, 아직 충분한 규모에 이르지 못하고 있습니다. 하드웨어와 구독형 AI 분석 서비스를 패키지로 제공하는 업체들은 현금 흐름 구조를 변화시키고 있지만, 금융 업계에서는 맞춤형 CT 캐비닛의 잔존 가치에 대한 불확실성이 여전히 지적되고 있습니다. 그 결과, 많은 중견 기업들은 감가상각 주기를 통해 자금이 확보될 때까지 업그레이드를 미루고 있습니다.
부문별 분석
2025년 기준으로, 직접 방사선 촬영(DR)은 방사선 검사 장비 시장 규모의 45.10%를 차지했으며, 이는 일상적인 용접 검증 및 부식 매핑 분야에서 DR이 확고한 역할을 하고 있음을 입증했습니다. 한편, 컴퓨터 단층촬영(CT)은 연평균 성장률(CAGR) 12.18%로 급속히 확대되고 있으며, 2차원 투영이 아닌 완전한 체적 데이터 세트가 필요한 프로젝트를 수주하고 있습니다. 따라서 방사선 검사 장비 시장은 양극화된 발전을 거듭하고 있으며, 비용 효율성이 뛰어난 DR이 기본적인 규정 준수 요건을 충족하는 한편, CT는 항공우주, 적층 가공, 복잡한 주조품 분야에서 고부가가치 검사를 실현하고 있습니다. 필름에서 디지털로의 전환은 여전히 매우 중요하며, 필름 방식 장비는 현재 신규 판매의 15% 이하를 차지할 뿐이며, 그 사용은 주로 구식 방위 관련 시설로 한정되어 있습니다.
휴대용 CT의 기술 혁신으로 인해, 고정식 납 차폐 인클로저로 인해 발생하던 기존의 장벽이 점차 해소되고 있습니다. 450 kV X선 발생원, 탄소섬유 지지 프레임, 방진 턴테이블을 통합한 장치가 발사 현장이나 파이프라인 부지 내에서 ISO 컨테이너에서 가동되고 있습니다. 해상도가 50마이크론 이하의 복셀 그리드에 도달함에 따라, CT는 측정 업무도 담당하게 되어 CAD 모델을 기반으로 적층 가공된 티타늄 부품의 검증을 수행하고 있습니다. 이러한 기능을 통해 각 OEM 업체는 초기 제품 검사 과정을 24시간 이내에 완료할 수 있으며, 비용이 많이 드는 반복 주기를 줄일 수 있습니다. 그 결과, X선 검사 장비 시장에서 CT의 점유율은 2031년까지 20%를 넘어설 것으로 예상되며, 그 증가분의 대부분은 단종되는 필름 장비에서 CT로 전환되는 데 기인할 것으로 전망됩니다.
2025년 매출액 중 하드웨어가 48.40%를 차지했습니다. 이는 모든 검사 셀에 필수적인 X선 소스, 매니퓰레이터, 검출기가 자본 집약적이라는 점을 반영하고 있습니다. 그러나 AI 엔진이 원본 이미지 스택을 정량적인 결함 평가로 변환하고 해석 작업을 최대 60%까지 줄임에 따라, 소프트웨어 매출은 연평균 성장률(CAGR) 12.05%를 기록하며 더 빠른 속도로 증가하고 있습니다. 연간 교정부터 CT 데이터 세트의 주문형 평가에 이르는 서비스 계약은 특히 사내에 분석 담당자가 없는 제조업체를 중심으로 안정적인 한 자릿수 중반대의 성장세를 유지하고 있습니다.
방사선 검사 장비 산업은 검출기, 제어 전자 기기, 분석 기능이 공통의 펌웨어 계층을 공유하는 통합 생태계로 수렴되고 있습니다. 각 공급업체는 기공, 용접 불량, 벽 두께 편차 등을 분류하는 구독형 알고리즘을 묶어 제공하며, 품질 관리 담당자가 대시보드에서 즉시 확인할 수 있는 결과를 실시간으로 제공합니다. 이러한 긴밀한 협력을 통해 전환 비용이 증가하고, 평생 가치가 높아지고 있습니다. 예측 기간 동안 소프트웨어는 증가 성장액의 3분의 1에 가까운 비중을 차지할 것으로 예상되며, 이는 향후 조달 주기에서 소프트웨어가 갖는 전략적 중요성이 부각되고 있음을 보여줍니다.
지역별 분석
북미는 세계에서 가장 밀집된 파이프라인 네트워크와 세계 복합재 항공기 생산 능력에서 압도적인 점유율을 바탕으로, 2025년 매출의 38.50%를 차지했습니다. 해당 지역의 방사선 검사 장비 시장 규모는 FAA(미국 연방항공청)가 의무화한 복합재 기체 검사 및 노후화된 원자력 자산의 수명 연장 프로그램의 호재를 타고 꾸준히 확대되어, 2031년까지 11억 2,000만 달러에 달할 것으로 예측됩니다. 캐나다의 오일샌드 개발 확대와 멕시코의 개혁에 힘입어 중류 부문에 대한 투자도 수요를 더욱 끌어올리는 요인이 되고 있습니다.
아시아태평양은 가장 빠르게 성장하고 있는 시장으로, 중국의 수조 달러 규모 인프라 계획과 인도의 화력 발전소 현대화 수요 급증에 힘입어 연평균 성장률(CAGR) 12.30%로 성장을 지속하고, 있습니다. 톈진, 벵갈루루, 나고야 등 각 지역의 항공우주 클러스터에서는 세계 항공기 프로그램에서 Tier 1 지위를 확보하기 위해 CT 베이 설치가 진행되고 있습니다. 한국과 싱가포르 정부의 인센티브는 ‘인더스트리 4.0’의 현대화와 연계된 세액 공제를 통해 도입을 더욱 촉진하고 있습니다.
유럽에서는 균형 잡힌 성장 요인이 나타나고 있습니다. 재생에너지, 특히 해상 풍력 발전의 도입 확대에 따라 대형 부품에 대한 방사선 검사가 필요해지는 한편, 100기 이상의 원자로 운전 수명 연장이 기저부하 수요를 확보하고 있습니다. 유럽 원자력 공동체(Euratom)의 엄격한 방사선 기준에 따라, 사용자들은 디지털 방식의 피폭 선량 저감 기술로 전환해야 하는 상황에 놓여 있으며, 이는 단순히 수량 증가라기보다는 기술 업그레이드에 대한 수요가 발생하고 있음을 의미합니다. 중동 및 아프리카에서는 탄화수소 관련 메가 프로젝트가 활용되고 있지만, CT의 자본 집약성으로 인해 도입 속도는 뒤처지고 있습니다. 브라질의 심해 개발 프로젝트에 힘입어 남미는 눈부신 성장을 보이고 있지만, 여전히 틈새 수익원에 그치고 있습니다.
기타 혜택
- 엑셀 형식 시장 예측(ME) 시트
- 3개월간의 애널리스트 지원
자주 묻는 질문
목차
제1장 서론
제2장 조사 방법
제3장 주요 요약
제4장 시장 구도
제5장 시장 규모 및 성장 예측
제6장 경쟁 구도
제7장 시장 기회 및 향후 전망
KTH 26.07.08According to Mordor Intelligence, radiography test equipment market size in 2026 is estimated at USD 1.52 billion, growing from 2025 value of USD 1.36 billion with 2031 projections showing USD 2.62 billion, growing at 11.55% CAGR over 2026-2031.
This report is Segmented by Technology (Film Radiography, Computed Radiography, and More), Component (Hardware/Equipment, Software, and Services), Application (Weld Inspection, Corrosion and Erosion Monitoring, and More), End-User Industry (Aerospace and Defense, Energy and Power, and More), and Geography. The Market Forecasts are Provided in Terms of Value (USD).
Global Radiography Test Equipment Market Trends and Insights
Growing Adoption of Portable Digital RT Systems
Portable digital radiography is overturning field inspection economics by replacing hours-long film processing with immediate, high-contrast images that expose micro-cracks on site. Advanced flat-panel detectors now pair wireless connectivity with ruggedized housings, letting pipeline crews or offshore technicians validate weld integrity in minutes and upload encrypted results to a cloud server for centralized review. Eliminating darkrooms also removes hazardous chemical disposal, lowering total compliance cost and aligning with net-zero mandates. Capital payback periods are shortening to fewer than 24 months for high-duty users, making portable systems an easy upgrade for contractors chasing tight project schedules. As component prices fall and detector sensitivity rises, adoption spreads from early North American and European users to Latin American and Southeast Asian energy corridors where logistical hurdles are greatest.
Surge in Aerospace Composite-Materials Inspection Volumes
Private launch providers and commercial aircraft OEMs have standardized computed-tomography scanning for primary load-bearing carbon-fiber parts, raising total scan hours per airframe to record levels. Multi-layer lay-ups, variable wall thicknesses, and metal-mesh lightning strike protections demand 3-D datasets capable of isolating sub-millimeter voids. Portable CT gantries equipped with 450 kV sources now move directly to assembly bays, sidestepping schedule bottlenecks at overbooked fixed installations. The resulting acceleration in first-article inspection throughput gives OEMs confidence to scale novel material systems that cut 20% structural weight without sacrificing safety margins. Asia-Pacific's burgeoning composite supply chain is quickly adopting these same standards to win Tier-1 fuselage and engine nacelle contracts.
High Ownership Cost, Particularly for CT Scanners
High-energy industrial CT units routinely top USD 500,000, and shielding, calibration, and skilled labor can double that outlay over ten years. Smaller inspection houses in Southeast Asia and Africa prefer contract labs or mobile service providers, slowing the direct-purchase curve. Leasing models and pay-per-scan platforms are partially bridging the affordability gap but not yet at scale. Vendors that bundle hardware with subscription-based AI analytics are shifting cash-flow profiles, but financiers still perceive residual-value uncertainty for bespoke CT cabinets. Consequently, many mid-tier users postpone upgrades until depreciation cycles free capital.
Other drivers and restraints analyzed in the detailed report include:
- Regulatory Mandates for Weld Integrity Across Oil and Gas Pipelines
- Aging Global Energy Infrastructure Demanding Life-Extension NDT
- Radiation Exposure Risk and Tightening Safety Clearances
For complete list of drivers and restraints, kindly check the Table Of Contents.
Segment Analysis
Direct Radiography accounted for 45.10% of the radiography test equipment market size in 2025, underscoring its entrenched role in routine weld verification and corrosion mapping. Computed Tomography, however, is accelerating at 12.18% CAGR, capturing projects that require complete volumetric datasets rather than 2-D projections. The radiography test equipment market is therefore experiencing a dual-track evolution where cost-efficient DR fulfills baseline compliance while CT unlocks high-value inspections for aerospace, additive manufacturing, and complex castings. Migration from film to digital remains pivotal; film units now represent less than 15% of new sales and are largely confined to legacy defense depots.
Portable CT innovations are dissolving historical barriers tied to fixed, lead-lined enclosures. Units integrating 450 kV sources, carbon-fiber support frames, and vibration-isolated turntables are operating from ISO containers at launch sites and pipeline rights-of-way. As resolution climbs to sub-50 micron voxel grids, CT also assumes metrology duties, validating additively manufactured titanium parts against CAD models. These capabilities help OEMs close first-article inspection loops within 24 hours, reducing costly iteration cycles. Consequently, CT's share of the radiography test equipment market is expected to break the 20% threshold before 2031, with most gains drawn from retiring film installations.
Hardware captured 48.40% of 2025 revenues, reflecting the capital intensity of X-ray sources, manipulators, and detectors essential for any inspection cell. Yet software revenues are advancing faster at 12.05% CAGR as AI engines transform raw image stacks into quantified flaw assessments, cutting interpretive labor up to 60%. Service contracts, ranging from annual calibration to on-demand evaluation of CT datasets, sustain a stable mid-single-digit growth, especially among manufacturers lacking in-house analysts.
The radiography test equipment industry is converging around integrated ecosystems where detectors, control electronics, and analytics share a common firmware layer. Vendors bundle subscription-based algorithms that classify porosity, lack of fusion, or wall-thickness deviations, delivering dashboard-ready outputs to quality managers in real time. This tight coupling increases switching costs and elevates lifetime value. Over the forecast period, software is expected to account for nearly one-third of incremental dollar growth, underlining its strategic weight in future procurement cycles.
Complete Report Scope:
- By Technology
- Film Radiography
- Computed Radiography
- Direct Radiography
- Computed Tomography
- By Component
- Hardware/Equipment
- Software
- Services
- By Application
- Weld Inspection
- Corrosion and Erosion Monitoring
- Casting and Forging Inspection
- Composite Material Inspection
- Other Applications
- By End-user Industry
- Aerospace and Defense
- Energy and Power
- Oil and Gas
- Automotive
- Construction and Infrastructure
- Manufacturing and Heavy Engineering
- Other End-User Industries
- By Geography
- North America
- United States
- Canada
- Mexico
- South America
- Brazil
- Argentina
- Chile
- Rest of South America
- Europe
- Germany
- United Kingdom
- France
- Italy
- Netherlands
- Rest of Europe
- Asia-Pacific
- China
- India
- Japan
- South Korea
- Rest of Asia-Pacific
- Middle East and Africa
- Middle East
- Saudi Arabia
- United Arab Emirates
- Turkey
- Rest of Middle East
- Africa
- South Africa
- Nigeria
- Rest of Africa
- Middle East
- North America
Geography Analysis
North America held 38.50% of 2025 revenues, anchored by the world's densest pipeline network and a dominant share of global composite aircraft production capacity. The radiography test equipment market size in the region is expected to reach USD 1.12 billion by 2031, expanding steadily on the back of FAA-mandated composite airframe inspections and life-extension programs for aging nuclear assets. Canada's oil-sands expansions and Mexico's reform-driven midstream investments add incremental pull.
Asia-Pacific is the fastest-growing theater, charting a 12.30% CAGR amid China's multi-trillion-dollar infrastructure pipeline and India's surge in thermal-plant upgrades. Local aerospace clusters in Tianjin, Bengaluru, and Nagoya are installing CT bays to win Tier-1 positions on global airframe programs. Government incentives in South Korea and Singapore further drive adoption through tax credits linked to Industry 4.0 modernization.
Europe exhibits balanced drivers: renewable-energy rollouts, particularly offshore wind, necessitate large-component RT, while extending the operational life of 100-plus nuclear reactors secures base-load demand. Stringent Euratom radiation standards push users toward digital dose-reduction technologies, creating technology-upgrade pull rather than pure volume growth. Middle East and Africa leverage hydrocarbon megaprojects, though adoption rates trail due to CT's capital intensity. South America, led by Brazil's deepwater initiatives, is a rising but still niche revenue pool.
- Baker Hughes Co. (Waygate Technologies)
- GE Vernova - Measurement and Control
- Canon Inc.
- Nikon Metrology Inc.
- Comet AG (Yxlon International)
- Teledyne DALSA Inc.
- Hitachi Ltd.
- Fujifilm Holdings Corp.
- Hamamatsu Photonics K.K.
- Shimadzu Corp.
- Carestream NDT (Carestream Health)
- Rigaku Corp.
- North Star Imaging Inc.
- Vidisco Ltd.
- DURR NDT GmbH and Co. KG
- Sonatest Ltd.
- Varex Imaging Corp.
- Bosello High Technology srl
- DIONDO GmbH
- Pexraytech Oy
- Industrial Control X-Ray (ICXR) Inc.
- Mistras Group Inc.
- Olympus Corporation
- Tuboscope NDT Services (NOV Inc.)
- Zetec Inc.
Additional Benefits:
- The market estimate (ME) sheet in Excel format
- 3 months of analyst support
TABLE OF CONTENTS
1 INTRODUCTION
- 1.1 Study Assumptions and Market Definition
- 1.2 Scope of the Study
2 RESEARCH METHODOLOGY
3 EXECUTIVE SUMMARY
4 MARKET LANDSCAPE
- 4.1 Market Overview
- 4.2 Market Drivers
- 4.2.1 Growing adoption of portable digital RT systems
- 4.2.2 Surge in aerospace composite-materials inspection volumes
- 4.2.3 Regulatory mandates for weld integrity across oil and gas pipelines
- 4.2.4 Aging global energy infrastructure demanding life-extension NDT
- 4.2.5 AI-driven defect-recognition software bundled with RT hardware
- 4.2.6 SpaceX-type private launch programs spawning new RT use cases
- 4.3 Market Restraints
- 4.3.1 High ownership cost, particularly for CT scanners
- 4.3.2 Radiation exposure risk and tightening safety clearances
- 4.3.3 Deficit of certified Level-III RT personnel
- 4.3.4 Cyber-security vulnerabilities in networked RT systems
- 4.4 Industry Value Chain Analysis
- 4.5 Impact of Macro Trends on the Market
- 4.6 Regulatory Landscape
- 4.7 Technological Outlook
- 4.8 Porter's Five Forces Analysis
- 4.8.1 Bargaining Power of Suppliers
- 4.8.2 Bargaining Power of Buyers
- 4.8.3 Threat of New Entrants
- 4.8.4 Threat of Substitutes
- 4.8.5 Intensity of Competitive Rivalry
5 MARKET SIZE AND GROWTH FORECASTS (VALUE)
- 5.1 By Technology
- 5.1.1 Film Radiography
- 5.1.2 Computed Radiography
- 5.1.3 Direct Radiography
- 5.1.4 Computed Tomography
- 5.2 By Component
- 5.2.1 Hardware/Equipment
- 5.2.2 Software
- 5.2.3 Services
- 5.3 By Application
- 5.3.1 Weld Inspection
- 5.3.2 Corrosion and Erosion Monitoring
- 5.3.3 Casting and Forging Inspection
- 5.3.4 Composite Material Inspection
- 5.3.5 Other Applications
- 5.4 By End-user Industry
- 5.4.1 Aerospace and Defense
- 5.4.2 Energy and Power
- 5.4.3 Oil and Gas
- 5.4.4 Automotive
- 5.4.5 Construction and Infrastructure
- 5.4.6 Manufacturing and Heavy Engineering
- 5.4.7 Other End-User Industries
- 5.5 By Geography
- 5.5.1 North America
- 5.5.1.1 United States
- 5.5.1.2 Canada
- 5.5.1.3 Mexico
- 5.5.2 South America
- 5.5.2.1 Brazil
- 5.5.2.2 Argentina
- 5.5.2.3 Chile
- 5.5.2.4 Rest of South America
- 5.5.3 Europe
- 5.5.3.1 Germany
- 5.5.3.2 United Kingdom
- 5.5.3.3 France
- 5.5.3.4 Italy
- 5.5.3.5 Netherlands
- 5.5.3.6 Rest of Europe
- 5.5.4 Asia-Pacific
- 5.5.4.1 China
- 5.5.4.2 India
- 5.5.4.3 Japan
- 5.5.4.4 South Korea
- 5.5.4.5 Rest of Asia-Pacific
- 5.5.5 Middle East and Africa
- 5.5.5.1 Middle East
- 5.5.5.1.1 Saudi Arabia
- 5.5.5.1.2 United Arab Emirates
- 5.5.5.1.3 Turkey
- 5.5.5.1.4 Rest of Middle East
- 5.5.5.2 Africa
- 5.5.5.2.1 South Africa
- 5.5.5.2.2 Nigeria
- 5.5.5.2.3 Rest of Africa
- 5.5.5.1 Middle East
- 5.5.1 North America
6 COMPETITIVE LANDSCAPE
- 6.1 Market Concentration
- 6.2 Strategic Moves
- 6.3 Market Share Analysis
- 6.4 Vendor Ranking Analysis
- 6.5 Company Profiles (includes Global level Overview, Market level overview, Core Segments, Financials as available, Strategic Information, Market Rank/Share for key companies, Products and Services, and Recent Developments)
- 6.5.1 Baker Hughes Co. (Waygate Technologies)
- 6.5.2 GE Vernova - Measurement and Control
- 6.5.3 Canon Inc.
- 6.5.4 Nikon Metrology Inc.
- 6.5.5 Comet AG (Yxlon International)
- 6.5.6 Teledyne DALSA Inc.
- 6.5.7 Hitachi Ltd.
- 6.5.8 Fujifilm Holdings Corp.
- 6.5.9 Hamamatsu Photonics K.K.
- 6.5.10 Shimadzu Corp.
- 6.5.11 Carestream NDT (Carestream Health)
- 6.5.12 Rigaku Corp.
- 6.5.13 North Star Imaging Inc.
- 6.5.14 Vidisco Ltd.
- 6.5.15 DURR NDT GmbH and Co. KG
- 6.5.16 Sonatest Ltd.
- 6.5.17 Varex Imaging Corp.
- 6.5.18 Bosello High Technology srl
- 6.5.19 DIONDO GmbH
- 6.5.20 Pexraytech Oy
- 6.5.21 Industrial Control X-Ray (ICXR) Inc.
- 6.5.22 Mistras Group Inc.
- 6.5.23 Olympus Corporation
- 6.5.24 Tuboscope NDT Services (NOV Inc.)
- 6.5.25 Zetec Inc.
7 MARKET OPPORTUNITIES AND FUTURE OUTLOOK
- 7.1 White-space and Unmet-need Assessment


