

|
시장보고서
상품코드
2073471
스마트 전력 미터 : 시장 점유율 분석, 업계 동향 및 통계, 성장 예측(2026-2031년)Smart Electricity Meter - Market Share Analysis, Industry Trends & Statistics, Growth Forecasts (2026 - 2031) |
||||||
 Mordor Intelligence
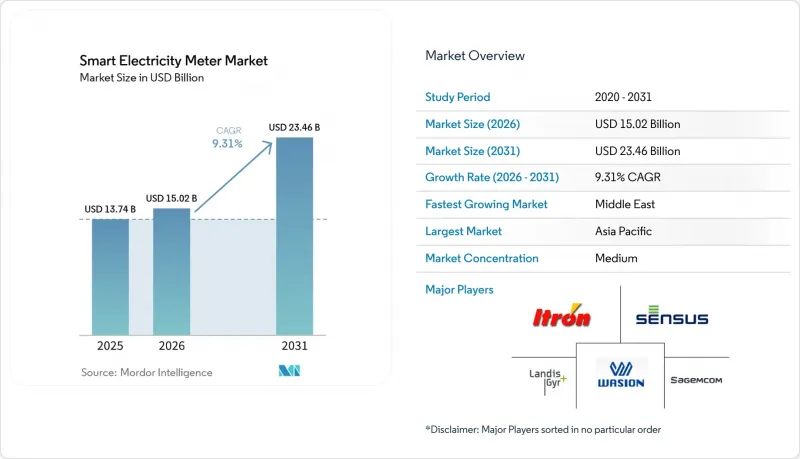
Mordor Intelligence에 의하면, 2026년 스마트 전력 미터 시장 규모는 150억 2,000만 달러에 달할 것으로 예상됩니다. 2025년 137억 4,000만 달러에서 확대해, 2031년에는 234억 6,000만 달러에 이를 것으로 예측됩니다.
2026년부터 2031년까지 연평균 성장률(CAGR) 9.31%로 성장할 것으로 전망됩니다.
본 보고서는 상(단상 및 3상), 통신 기술(전력선 통신(PLC), 기타), 기술(첨단 계량 인프라(AMI), 기타), 최종 사용자(주거용, 상업용, 산업용), 설치 형태(신규 설치 및 개보수·교체), 지역별로 분류되어 있습니다. 시장 전망은 금액(달러) 기준으로 제시되어 있습니다.
세계의 스마트 전력 미터 시장 동향 및 인사이트
EU의 2025년 3상 계량기 교체 의무화
유럽의 구형 3상 계량기를 교체하기 위한 법적 구속력이 있는 일정에 따라, 전력 사업자들은 2027년까지 수백만 대의 상업용 및 산업용 계량기를 교체해야만 합니다. 전력 사업자들은 이번 기회를 통해 상세한 계량 데이터를 수집하고, 서브미터링 서비스를 지원하는 AMI 플랫폼 도입을 추진하고 있습니다. 계량기 공급업체는 단상 계량기보다 약 3배 높은 평균 판매 가격의 혜택을 누리고 있는 반면, 소프트웨어 공급업체는 데이터 관리 계약을 통해 지속적인 수익을 얻고 있습니다. 규정 준수를 위해 배정된 설비 투자는 요금 체계 혁신과 수요 측 유연성 프로그램을 뒷받침하는 데이터 허브에 대한 투자도 가속화하고 있습니다.
중국 NB-IoT 스마트 계량기 대규모 입찰
국가전망공사가 2025년에 실시한 600만 대 규모의 듀얼 모드 NB-IoT 계량기 입찰은 셀룰러 연결이 가격 경쟁력 있는 대안임을 확고히 했습니다. 일괄 조달을 통해 전 세계 구매자의 부품 비용이 절감되고, 모뎀 공급업체의 인증 주기가 단축됩니다. 미터의 듀얼 밴드 설계는 2G 서비스 종료에 대비한 미래 지향적인 도입을 실현하며, 클라우드 네이티브 헤드엔드 시스템은 소프트웨어 업그레이드를 효율화합니다. 이러한 운영상의 장점은 비슷한 도시 인구 밀도 문제를 안고 있는 동남아시아의 전력 회사들로부터도 공감을 얻어, 중국의 설계 템플릿을 사실상 표준으로 자리 잡게 했습니다.
ASIC 공급망 부족이 BOM 비용을 끌어올리고 있습니다.
특수 프로세서의 만성적인 부족으로 인해 계기판의 제조 비용은 계속해서 15-25% 상승하고 있습니다. 소규모 공급업체들은 범용 MCU를 사용할 수 있도록 기판 재설계를 진행하고 있으며, 이로 인해 검증 주기가 길어지고 운전 자금이 증가하고 있습니다. 북미의 일부 지방 자치단체 전력 회사들은 2026년에 가동을 시작할 예정인 웨이퍼 공장이 공급 부족을 완화해 줄 것으로 기대하며, 2단계 도입을 2027년까지 연기하고 있습니다. 이러한 공급 부족은 암호화 처리 가속화 및 엣지 분석 코어가 필요한 AMI 계량기에서 가장 심각합니다.
부문별 분석
2025년에는 단상 계량기가 매출 점유율의 63.25%를 차지하며 1위를 기록했으나, 3상 장치는 2031년까지 연평균 성장률(CAGR) 9.05%로 성장할 것으로 전망됩니다. 전력 회사는 고조파가 많은 부하 프로파일링이 필요한 중전압 피더, 재생에너지용 인버터, 전기차 급속 충전기에서 3상 소자를 선호하여 채택하고 있습니다. 대조적으로, 단상 계량기는 여전히 수량 면에서 우위를 차지하고 있지만, 사이버 보안 및 펌웨어 업그레이드 요건의 영향으로 점차 교체 주기로 전환되고 있습니다. 비선형 부하 환경에서 입증된 정확도 덕분에 산업 자동화 사용자들의 기존 도입 장벽이 해소되면서, 독일, 이탈리아, 폴란드의 계량기 OEM 업체들의 수주 잔고가 증가하고 있습니다.
이 부문은 전압 강하 기록 및 통합형 차단 릴레이와 같은 고급 3상 기능을 의무화하는 EU 규제의 혜택을 받고 있습니다. 그 결과, 스마트 전력 미터 시장에서는 수익성이 높은 산업용 계약으로의 가치 전환이 뚜렷하게 진행되고 있습니다. 3상 계량기의 출하 가격은 주택용 제품의 약 2.8배에 달하는 평균 판매 가격을 기록하고 있으며, 이에 따라 상업 및 산업용 스마트 전력 미터 시장 규모가 확대되고 있습니다. 각 벤더사는 차별화를 꾀하기 위해 전력 품질 모듈이나 탄소 배출량 보고 기능을 묶어 제공하고 있으며, 전력 회사는 이에 대응하여 새로운 데이터 스트림을 수익화할 수 있는 구독형 분석 서비스를 출시하고 있습니다.
전력선 통신(PLC)은 유럽의 저압(LV) 네트워크에서 높은 보급률에 힘입어 2025년 기준 44.10%의 시장 점유율을 유지했습니다. 그러나 셀룰러 방식의 NB-IoT 및 LTE-M 모듈은 비용 격차가 점차 좁혀지고 있으며, 2031년까지 연평균 성장률(CAGR) 11.62%로 성장할 전망입니다. 중국에서 이루어진 대규모 입찰의 성공 사례에 따르면, 인구 밀도가 높은 도시 지역에서 PLC보다 6개월 앞당겨진 도입 일정이 실현되었습니다. 스마트 전력 미터 시장은 하이브리드 아키텍처로 전환되고 있으며, 교외 지역에서는 RF 메쉬가 백홀 역할을 담당하고, 고층 빌딩 밀집 지역에서는 셀룰러 기술이 커버함으로써, 리피터 군을 설치하지 않고도 연속적인 커버리지를 확보하고 있습니다.
eSIM 도입으로 인해 유틸리티자는 현장에 직접 방문하지 않고도 통신사를 변경할 수 있게 되어, 프로비저닝 절차가 간소화되고 운영 비용(OPEX)을 최대 35% 절감할 수 있습니다. 브라질에서 실시한 현장 검사를 통해, 지하실 및 계량실에서의 NB-IoT 보급률이 기존 메쉬 방식을 22% 상회하는 것으로 확인되었습니다. 이동통신의 보급 추세에 따라, 하드웨어와 관리형 접속 서비스를 번들로 제공하는 통신 사업자 중심공급업체들이 스마트 전력 미터 시장에서 점유율을 확대되고 있습니다. 로밍 비용의 감소에 따라 아프리카의 전력 사업자들은 국경을 넘는 이동통신 협정을 활용하여 AMI 형태를 표준화하고 있으며, 이를 통해 독자적인 사양의 메쉬 무선 장비와 관련된 수입 관세를 절감하고 있습니다.
지역별 분석
2025년, 아시아태평양은 스마트 전력 미터 시장에서 47.55%의 매출 점유율을 차지했으며, 같은 해 전 세계 출하량에서도 큰 비중을 차지하며 계속해서 스마트 전력 미터 시장 수요를 견인하고 있습니다. 중국에서만 26개 성에 걸쳐 5억 9,000만 대의 AMI 엔드포인트가 도입되어, 현지 공급업체에 타의 추종을 불허하는 규모의 우위를 제공합니다. 인도에서는 2027년까지 2억 5,000만 대의 선불식 스마트 계량기를 도입하겠다는 연방 정부 주도의 계획이 민관 합작 사업을 촉진하고, 제3자 자금 조달 구조의 확립을 뒷받침하고 있습니다. 일본과 한국의 고밀도 도시 지역에서는 AMI 2.0 도입이 진행되고 있으며, 1초 미만의 이벤트 데이터를 수집함으로써 지붕 위 태양광 발전 설비의 급증에 따라 전력 품질 모니터링 체계를 강화하고 있습니다.
2026년부터 2031년에 걸쳐 중동의 스마트 전력 미터 시장은 10.18%라는 견실한 성장률을 기록하며 확대될 전망입니다. 이러한 급속한 성장은 주로 걸프협력회의(GCC) 회원국의 전력 사업자들이 송전망의 디지털화를 추진하고, 시간대별 요금제를 도입하며, 수요 측 관리를 중시하고 있는 데 기인합니다. 사우디아라비아, 아랍에미리트, 오만 등의 국가에서는 첨단 계량 인프라(AMI)의 광범위한 도입으로 청구 정확도가 향상되었으며, 정전 시 상황 파악도 용이해졌습니다. 또한, 이 지역의 이러한 성장세는 옥상 태양광 발전의 보급 확대, 규제 개정, 그리고 야심 찬 효율화 목표에 힘입어 더욱 가속화되고 있습니다.
북미에서는 2024년까지 77%의 보급률을 달성했으며, 각 전력사는 현재 1세대 AMI 장비를 정전 감지 알고리즘 및 전기차 부하 예측 기능을 통합한 장치로 교체하고 있습니다. 미국 에너지부가 시행하는 105억 달러 규모의 송전망 복원력 지원금 제도는 중규모 지자체들이 계량기를 중심으로 한 고장 위치 파악 절차를 포함한 시스템 업그레이드를 도입하는 데 도움이 되고 있습니다. 해당 지역에서 Wi-SUN과 같은 개방형 표준을 고수함으로써 상호 운용이 가능한 소프트웨어 공급업체 생태계를 조성하고, 이를 통해 경쟁을 촉진하여 수명 주기 비용 절감으로 이어지고 있습니다.
유럽의 정책 주도형 상황은 엄격한 사이버 보안 및 데이터 개인정보 보호 규제가 특징입니다. 2022년 말 기준으로 고객의 56%가 이미 스마트 계량기를 도입한 이 대륙에서는 소매업체들이 국경을 넘어 유연한 요금제를 제공할 수 있도록 데이터 접근의 조화를 위한 노력이 진행되고 있습니다. 50억 유로 규모의 혁신 기금은 2027년까지 90%의 보급률을 달성하는 것을 목표로 하고 있으며, AI를 활용한 부하 예측을 중요한 성과로 꼽고 있습니다. 2025년부터 시작되는 3상 방식로의 강제 전환에 따라, 특히 독일, 스페인, 북유럽 국가들을 중심으로 산업 부문에서의 도입이 가속화되고 있습니다.
기타 혜택
- 엑셀 형식 시장 예측(ME) 시트
- 3개월간의 애널리스트 지원
자주 묻는 질문
목차
제1장 서론
제2장 조사 방법
제3장 주요 요약
제4장 시장 구도
제5장 시장 규모 및 성장 예측
제6장 경쟁 구도
제7장 시장 기회 및 향후 전망
KTH 26.07.08According to Mordor Intelligence, smart electricity meter market size in 2026 is estimated at USD 15.02 billion, growing from 2025 value of USD 13.74 billion with 2031 projections showing USD 23.46 billion, growing at 9.31% CAGR over 2026-2031.
This report is Segmented by Phase (Single-Phase and Three-Phase), Communication Technology (Power-Line Communication (PLC), and More), Technology (Advanced Metering Infrastructure (AMI) and More), End-User (Residential, Commercial, and Industrial), Installation Mode (New Installations and Retrofits / Replacements), and Geography. The Market Forecasts are Provided in Terms of Value (USD).
Global Smart Electricity Meter Market Trends and Insights
Mandatory EU-2025 Three-Phase Replacement Mandates
Europe's legally binding schedule to swap legacy three-phase meters forces utilities to replace millions of commercial and industrial units before 2027. Utilities are seizing the window to roll out AMI platforms that capture granular interval data and support sub-metering services. Meter vendors benefit from a higher average selling price, roughly triple that of single-phase units, while software providers gain recurring revenue through data-management contracts. Capital spending earmarked for compliance is also accelerating investment in data hubs that will underpin tariff innovation and demand-side flexibility programs.
China NB-IoT Smart-Meter Mega-Tenders
The State Grid Corporation's 2025 tender for 6 million dual-mode NB-IoT meters cements cellular connectivity as a price-competitive option. Bulk procurement compresses component costs for global buyers and speeds certification cycles for modem vendors. The meters' dual-band design future-proofs deployments against 2G sunsets, while cloud-native head-end systems streamline software upgrades. These operational gains resonate with Southeast Asian utilities that share similar urban density challenges, reinforcing China's design template as a de-facto standard.
ASIC Supply-Chain Shortages Inflate BOM Costs
Persistent scarcity of specialized processors continues to lift meter manufacturing expenses by 15-25%. Smaller vendors are redesigning boards to use multi-purpose MCUs, extending validation cycles and inflating working capital. Several North American municipal utilities have postponed tranche-two deployments until 2027 in the hope that wafer fabs coming online in 2026 will relieve shortages. The squeeze is most acute for AMI meters that require cryptographic acceleration and edge-analytics cores
Other drivers and restraints analyzed in the detailed report include:
- U.S.-Japan Demand-Response AMI Roll-Outs
- Prosumer Billing Surge in Oceania
- UK CPA/EU RED Cyber-Certification Delays
For complete list of drivers and restraints, kindly check the Table Of Contents.
Segment Analysis
Single-phase meters led with a 63.25% revenue share in 2025, whereas three-phase devices are projected to grow at a 9.05% CAGR through 2031. Utilities favor them for medium-voltage feeders, renewable inverters, and EV fast-chargers that demand harmonic-rich load profiling. In contrast, single-phase units, although still numerically dominant, are shifting toward replacement cycles driven by cybersecurity and firmware upgrade requirements. Field-proven accuracy in non-linear load environments has removed a historic adoption barrier for industrial automation users, boosting order backlogs among meter OEMs in Germany, Italy, and Poland.
The segment benefits from the EU mandate that forces advanced three-phase functions such as voltage sag logging and integrated disconnect relays. As a result, the smart electricity meter market is experiencing a clear shift in value towards higher-margin industrial contracts. Three-phase shipments command average selling prices roughly 2.8 times that of residential units, thereby enlarging the smart electricity meter market size for commercial and industrial applications. Vendors are bundling power-quality modules and carbon-intensity reporting to differentiate, and utilities are responding by launching subscription-based analytics that monetize the new data stream.
Power-Line Communication (PLC) retained a 44.10% share in 2025, underpinned by deep penetration in Europe's LV networks. Yet cellular NB-IoT and LTE-M modules are closing the cost gap and are on track for a 11.62% CAGR through 2031. Successful Chinese mega-tenders showcase deployment timelines that beat PLC by six months in dense urban corridors. The smart electricity meter market is shifting toward hybrid architectures, where RF mesh backhauls the outskirts while cellular technology covers high-rise clusters, ensuring contiguous coverage without the need for repeater farms.
eSIM adoption simplifies provisioning because utilities can switch carriers without truck rolls, cutting opex by up to 35%. Field trials in Brazil confirm that NB-IoT penetration into basements and meter rooms outperforms legacy mesh by 22 percentage points. The cellular uptrend expands the smart electricity meter market share of telecom-centric vendors that bundle managed connectivity with hardware. As roaming costs decline, African utilities are utilizing cross-border cellular agreements to standardize AMI formats, thereby reducing import duties associated with proprietary mesh radios.
Complete Report Scope:
- By Phase
- Single-Phase
- Three-Phase
- By Communication Technology
- Power-Line Communication (PLC)
- Radio-Frequency Mesh
- Cellular (NB-IoT / LTE-M)
- Hybrid / Others
- By Technology
- Advanced Metering Infrastructure (AMI)
- Automatic Meter Reading (AMR)
- By End-user
- Residential
- Commercial
- Industrial
- By Installation Mode
- New Installations
- Retrofits / Replacements
- By Geography
- North America
- United States
- Canada
- Mexico
- South America
- Brazil
- Chile
- Colombia
- Rest of South America
- Europe
- United Kingdom
- Germany
- France
- Spain
- Italy
- Nordics
- Benelux
- Rest of Europe
- Asia Pacific
- China
- India
- Japan
- South Korea
- Southeast Asia
- Rest of Asia Pacific
- Middle East
- GCC
- Turkey
- Israel
- Rest of Middle East
- Africa
- South Africa
- Egypt
- Rest of Africa
- North America
Geography Analysis
Asia Pacific held a revenue share of 47.55% in the smart electricity meter market in 2025 and contributed a significant share of global shipments in 2025, continuing to be the volume engine of the smart electricity meter market. China alone has deployed 590 million AMI endpoints across 26 provinces, giving local suppliers unrivaled scale advantages. India's federal push toward 250 million prepaid smart meters by 2027 is spurring public-private joint ventures and unlocking third-party financing structures. High-density urban nodes in Japan and South Korea are rolling out AMI 2.0 to capture sub-second event data, thereby enhancing their power-quality oversight amid the surge in rooftop solar installations.
From 2026 to 2031, the Middle East's smart electricity meter market is set to grow at a robust rate of 10.18%. This surge is largely driven by utilities in the Gulf Cooperation Council (GCC) pushing for grid digitalization, implementing time-of-use tariffs, and emphasizing demand-side management. In countries such as Saudi Arabia, the UAE, and Oman, extensive rollouts of Advanced Metering Infrastructure (AMI) are enhancing billing precision and visibility during power outages. Additionally, the region's momentum is bolstered by a rising adoption of rooftop solar, updates in regulations, and ambitious efficiency targets.
North America achieved 77% penetration by 2024, with utilities now swapping first-wave AMI units for devices that integrate outage-detection algorithms and EV-load forecasting. The U.S. Department of Energy's USD 10.5 billion grid-resilience grant scheme helps mid-size municipals justify upgrades that include meter-centric fault-isolation routines. The region's insistence on open-standards such as Wi-SUN cultivates an ecosystem of interoperable software vendors, thereby increasing competitive tension and driving down lifecycle costs.
Europe's policy-driven landscape stands out for its strict cybersecurity and data-privacy mandates. With 56% of customers already on smart meters by end-2022, the continent pivots toward harmonizing data access so that retailers can offer flexible tariffs across borders.A EUR 5 billion innovation fund aims for 90% coverage by 2027 and earmarks AI-enabled load forecasting as a critical deliverable. The mandatory three-phase replacement starting in 2025 is accelerating industrial uptake, especially in Germany, Spain and the Nordic bloc.
- Landis+Gyr Group AG
- Itron Inc.
- Sagemcom SAS
- Honeywell International Inc. (Elster)
- Kamstrup A/S
- Wasion Group Holdings
- Jiangsu Linyang Energy Co. Ltd
- Ningbo Sanxing Electric Co. Ltd
- Hexing Electric Company Ltd
- Holley Technology Ltd
- Nanjing Xinlian Electronics Co. Ltd
- Sensus USA Inc. (Xylem Inc.)
- ABB Ltd.
- Siemens AG
- Schneider Electric SE
- General Electric Co.
- Aclara Technologies LLC
- EDMI Ltd
- Genus Power Infrastructures Ltd
- ZENNER International GmbH and Co. KG
- Secure Meters Ltd
Additional Benefits:
- The market estimate (ME) sheet in Excel format
- 3 months of analyst support
TABLE OF CONTENTS
1 INTRODUCTION
- 1.1 Study Assumptions and Market Definition
- 1.2 Scope of the Study
2 RESEARCH METHODOLOGY
3 EXECUTIVE SUMMARY
4 MARKET LANDSCAPE
- 4.1 Market Overview
- 4.2 Market Drivers
- 4.2.1 Mandatory EU-2025 three-phase replacement mandates
- 4.2.2 China NB-IoT smart-meter mega-tenders
- 4.2.3 U.S.-Japan demand-response AMI roll-outs
- 4.2.4 Prosumer billing surge in Oceania
- 4.2.5 Grid-modernization stimulus in Southern Cone
- 4.2.6 GCC time-of-use tariff introduction
- 4.3 Market Restraints
- 4.3.1 ASIC supply-chain shortages inflate BOM costs
- 4.3.2 UK CPA/EU RED cyber-certification delays
- 4.3.3 RF-emission pushback in France and Canada
- 4.3.4 Legacy-SCADA incompatibility in Sub-Saharan utilities
- 4.4 Industry Value Chain Analysis
- 4.5 Regulatory Outlook
- 4.6 Technological Outlook
- 4.7 Porters Five Forces Analysis
- 4.7.1 Threat of New Entrants
- 4.7.2 Bargaining Power of Buyers
- 4.7.3 Bargaining Power of Suppliers
- 4.7.4 Threat of Substitutes
- 4.7.5 Competitive Rivalry
5 MARKET SIZE AND GROWTH FORECASTS (VALUE)
- 5.1 By Phase
- 5.1.1 Single-Phase
- 5.1.2 Three-Phase
- 5.2 By Communication Technology
- 5.2.1 Power-Line Communication (PLC)
- 5.2.2 Radio-Frequency Mesh
- 5.2.3 Cellular (NB-IoT / LTE-M)
- 5.2.4 Hybrid / Others
- 5.3 By Technology
- 5.3.1 Advanced Metering Infrastructure (AMI)
- 5.3.2 Automatic Meter Reading (AMR)
- 5.4 By End-user
- 5.4.1 Residential
- 5.4.2 Commercial
- 5.4.3 Industrial
- 5.5 By Installation Mode
- 5.5.1 New Installations
- 5.5.2 Retrofits / Replacements
- 5.6 By Geography
- 5.6.1 North America
- 5.6.1.1 United States
- 5.6.1.2 Canada
- 5.6.1.3 Mexico
- 5.6.2 South America
- 5.6.2.1 Brazil
- 5.6.2.2 Chile
- 5.6.2.3 Colombia
- 5.6.2.4 Rest of South America
- 5.6.3 Europe
- 5.6.3.1 United Kingdom
- 5.6.3.2 Germany
- 5.6.3.3 France
- 5.6.3.4 Spain
- 5.6.3.5 Italy
- 5.6.3.6 Nordics
- 5.6.3.7 Benelux
- 5.6.3.8 Rest of Europe
- 5.6.4 Asia Pacific
- 5.6.4.1 China
- 5.6.4.2 India
- 5.6.4.3 Japan
- 5.6.4.4 South Korea
- 5.6.4.5 Southeast Asia
- 5.6.4.6 Rest of Asia Pacific
- 5.6.5 Middle East
- 5.6.5.1 GCC
- 5.6.5.2 Turkey
- 5.6.5.3 Israel
- 5.6.5.4 Rest of Middle East
- 5.6.6 Africa
- 5.6.6.1 South Africa
- 5.6.6.2 Egypt
- 5.6.6.3 Rest of Africa
- 5.6.1 North America
6 COMPETITIVE LANDSCAPE
- 6.1 Market Concentration
- 6.2 Strategic Moves
- 6.3 Market Share Analysis
- 6.4 Company Profiles (includes Global level Overview, Market level overview, Core Segments, Financials as available, Strategic Information, Market Rank/Share for key companies, Products and Services, Recent Developments)
- 6.4.1 Landis+Gyr Group AG
- 6.4.2 Itron Inc.
- 6.4.3 Sagemcom SAS
- 6.4.4 Honeywell International Inc. (Elster)
- 6.4.5 Kamstrup A/S
- 6.4.6 Wasion Group Holdings
- 6.4.7 Jiangsu Linyang Energy Co. Ltd
- 6.4.8 Ningbo Sanxing Electric Co. Ltd
- 6.4.9 Hexing Electric Company Ltd
- 6.4.10 Holley Technology Ltd
- 6.4.11 Nanjing Xinlian Electronics Co. Ltd
- 6.4.12 Sensus USA Inc. (Xylem Inc.)
- 6.4.13 ABB Ltd.
- 6.4.14 Siemens AG
- 6.4.15 Schneider Electric SE
- 6.4.16 General Electric Co.
- 6.4.17 Aclara Technologies LLC
- 6.4.18 EDMI Ltd
- 6.4.19 Genus Power Infrastructures Ltd
- 6.4.20 ZENNER International GmbH and Co. KG
- 6.4.21 Secure Meters Ltd
7 MARKET OPPORTUNITIES AND FUTURE OUTLOOK
- 7.1 White-Space and Unmet-Need Assessment


