|
시장보고서
상품코드
2073473
액화천연가스(LNG) : 시장 점유율 분석, 업계 동향 및 통계, 성장 예측(2026-2031년)Liquefied Natural Gas (LNG) - Market Share Analysis, Industry Trends & Statistics, Growth Forecasts (2026 - 2031) |
||||||
 Mordor Intelligence
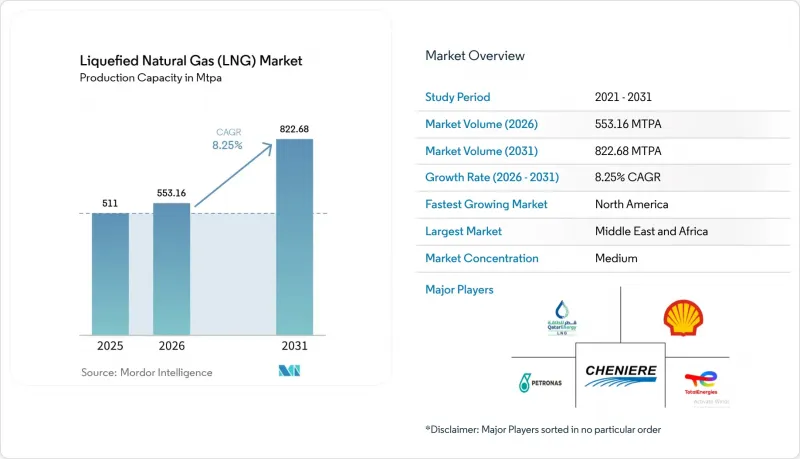
Mordor Intelligence에 의하면, 2026년 액화천연가스(LNG) 시장 규모는 553.16 MTPA에 달할 것으로 예상되고 2025년 511 MTPA로부터 확대해, 2031년에는 822.68 MTPA에 이를 것으로 예측됩니다.
2026년부터 2031년까지 연평균 성장률(CAGR) 8.25%로 성장할 것으로 전망됩니다.
본 보고서는 인프라 유형(LNG 액화 플랜트, LNG 재기화 시설, LNG 운송 선단), 최종 용도(발전, 산업 및 제조, 기타), 규모(대규모, 중규모, 소규모), 입지(육상 및 해상), 지역(북미, 유럽, 아시아태평양, 남미, 중동 및 아프리카)별로 분류되어 있습니다.
세계의 액화천연가스(LNG) 시장 동향 및 인사이트
아시아태평양의 가스 발전 프로젝트가 급증함에 따라, 중류 부문의 LNG 공급 계약이 요구되고 있습니다.
아시아태평양의 전력 사업자들은 100bcm을 넘는 새로운 재기화 설비를 확충하고 있으며, 인도는 2030년까지 가스 소비량을 60% 늘릴 계획입니다. 각국의 탈탄소화 목표에 따라 석탄에서 가스로의 전환이 가속화되고 있으며, LNG 공급과 전력 구매 계약을 직접 연계하는 통합 계약이 촉진되고 있습니다. 이러한 긴밀한 협력을 통해 자금 조달 위험이 줄어들고, 프로젝트의 은행 대출 적격성이 향상되며, 액화천연가스 시장에 대한 장기적인 수요가 강화될 것입니다.
유럽의 IMO-2020년 황 함량 규제를 계기로 한 선박용 연료로서의 LNG의 급속한 보급
세계 LNG 연료 선단은 2024년에 33% 증가해 638척에 달했으며, 2028년까지 1,200척을 넘어설 것으로 예측됩니다. 컨테이너 선사들이 LNG 추진선의 적재 중량 톤수의 60%를 차지하고 있으며, 198개 항만의 벙커 인프라 구축을 가속화하고 있습니다. 액화천연가스(LNG) 시장은 향후 배출 규제 체제를 준수할 수 있게 해주는 바이오 LNG 관련 노력 덕분에 더욱 탄력을 받고 있습니다.
EPC 비용 급등과 모듈 제조 병목 현상으로 인한 FID 지연
2024년에 최종 투자 결정(FID)에 이른 생산 능력은 고작 14.8MTPA에 그쳤으며, 비용이 20-30% 급등하고 인력 부족까지 겹치면서 대폭 감소했습니다. 설비 가격의 급등에도 불구하고 모듈식 건설이 지지를 얻고 있지만, 지연이 발생할 경우 2027년부터 2029년에 걸쳐 공급 공백이 생겨 액화천연가스 시장 전체에 변동을 초래할 가능성이 있습니다.
부문별 분석
액화 플랜트는 2025년 매출의 42.60%를 차지하여, 액화천연가스 시장 내에서 가장 높은 비중을 차지했습니다. 카타르, 미국, 호주에서의 생산 능력 확대가 2031년 연평균 성장률(CAGR) 10.75%라는 예측의 근거가 되고 있습니다. 전동 압축기 및 탄소 포집 기술로 인해 배출량이 감소함에 따라, 통합형 대기업 간의 경쟁이 더욱 치열해지고 있습니다.
이 부문의 생태계에는 현재 904척의 LNG 운반선이 포함되어 있으며, 이들 중 상당수는 온실가스 배출 강도를 억제하는 저메탄 슬립 엔진을 탑재하고 있습니다. FSRU는 특히 유럽에서 수입 증가세를 가속화하고 있으며, 2021년 이후 연간 77 MMtpy의 재기화 용량을 추가함으로써 LNG 시장에서 모듈식 도입 방식의 유효성을 입증했습니다.
발전 부문은 2025년 기준 수요의 37.70%를 차지하며, 아시아 지역의 LNG-전력 통합 프로젝트를 통해 지속적으로 확대되었습니다. 이러한 프로젝트는 터미널, 저장 시설, 발전소 등 각 자산을 통합함으로써 신용 리스크를 줄이고, LNG 시장에서의 입지를 더욱 공고히 하고 있습니다.
선박용 연료 공급 시장은 연평균 성장률(CAGR) 13.55%를 나타낼 것으로 예측되며, 용도별로는 가장 높은 성장률을 보이고 있습니다. 선대 규모, 항만 연료 공급 네트워크, 바이오 LNG 시범 사업은 지속 가능한 성장을 시사하고 있으며, 해운 산업은 액화천연가스 시장에서 역동적인 기여 요인으로서의 입지를 확립해 가고 있습니다.
지역별 분석
중동 및 아프리카는 2025년 시장 점유율의 27.60%를 차지했습니다. 카타르의 노스 필드가 2027년까지 연간 생산 능력을 77MTPA에서 126MTPA로 확대하는 것은 해당 지역의 주도적 지위를 공고히 하고, 유럽과 아시아 간 운송 경로의 유연성을 높일 것입니다. 아랍에미리트와 모리타니에서의 신규 사업이 시장의 깊이를 더하고 있지만, 호르무즈 해협을 통과하는 유조선의 보험 비용은 액화천연가스 시장에 있어 여전히 운영상의 우려 사항으로 남아 있습니다.
북미는 풍부한 셰일가스와 2025년에 가동을 시작할 연간 13.3 MTPA 규모의 수출 플랜트에 힘입어, 2031년까지의 LNG 시장에서 연평균 성장률(CAGR) 10.25%를 나타낼 것으로 전망됩니다. 캐나다 키티맷(Kitimat)의 가동 개시와 헨리 허브(Henry Hub) 연동 계약으로 인해 구매자들의 관심이 높아지고 있지만, 임시 허가 절차의 지연으로 인해 2020년대 중반의 최종 투자 결정(FID) 전망은 신중한 임베디드니다.
아시아태평양은 계속해서 LNG 시장의 최대 수입 거점으로 자리매김하고 있으며, 중국은 2024년에 7,864만 톤을 수입했습니다. 필리핀이나 베트남과 같은 신규 수입국이 고객 기반을 확대하는 한편, 도서 지역으로공급에 있어서는 소규모 LNG 유통이 활기를 띠고 있습니다. 일본과 한국의 재생에너지 성장 및 수소 시범 사업은 해당 지역의 소비에 장기적인 불확실성을 초래하고 있습니다.
유럽에서는 2021년 이후 재기화 능력을 44% 확대하고, 러시아로부터의 파이프라인 공급량을 보충하기 위해 여러 대의 FSRU를 도입했습니다. 계절적 수요 급증으로 인해 프리미엄 가격이 유지되고 있으며, EU의 메탄 규제 시행이 임박함에 따라 액화천연가스 시장 전반에서 공급망 모니터링이 강화될 전망입니다.
기타 혜택
- 엑셀 형식 시장 예측(ME) 시트
- 3개월간의 애널리스트 지원
자주 묻는 질문
목차
제1장 서론
제2장 조사 방법
제3장 주요 요약
제4장 시장 구도
제5장 시장 규모 및 성장 예측
제6장 경쟁 구도
제7장 시장 기회 및 향후 전망
KTH 26.07.08According to Mordor Intelligence, liquefied natural gas market size in 2026 is estimated at 553.16 MTPA, growing from 2025 value of 511 MTPA with 2031 projections showing 822.68 MTPA, growing at 8.25% CAGR over 2026-2031.
This report is Segmented by Infrastructure Type (LNG Liquefaction Plants, LNG Regasification Facilities, and LNG Shipping Fleet), End-Use Application (Power Generation, Industrial and Manufacturing, and Others), Scale (Large-Scale, Mid-Scale, and Small-Scale), Location (Onshore and Offshore), and Geography (North America, Europe, Asia-Pacific, South America, and Middle East and Africa).
Global Liquefied Natural Gas (LNG) Market Trends and Insights
Surge in Asia-Pacific Gas-to-Power Projects Seeking Midstream LNG Offtake Agreements
Asia-Pacific utilities are adding over 100 bcm of new regasification capacity, and India plans to lift gas consumption 60% by 2030. National decarbonization targets are accelerating coal-to-gas switching and prompting integrated contracts that link LNG supply directly to power-purchase deals. This tight coupling lowers financing risk, improves project bankability, and reinforces long-run demand for the liquefied natural gas market.
Rapid Uptake of LNG as Marine Bunker Fuel Following IMO-2020 Sulfur Cap in Europe
The global LNG-fueled fleet grew 33% in 2024 to 638 vessels and is expected to exceed 1,200 ships by 2028. Container lines represent 60% of LNG-propelled deadweight tonnage, driving accelerated bunker-infrastructure rollout in 198 ports. The liquefied natural gas market is picking up additional momentum from bio-LNG initiatives that extend compliance into future emissions-control regimes.
Prolonged FID Delays Owing to EPC-Cost Inflation & Module Fabrication Bottlenecks
Just 14.8 MTPA of capacity reached FID in 2024, down sharply amid 20-30% cost jumps and labor shortages. Modular construction is gaining favor despite higher equipment prices, yet delays could open a supply gap in 2027-2029, inducing volatility across the liquefied natural gas market.
Other drivers and restraints analyzed in the detailed report include:
- Permian Basin Associated Gas Output Unlocks Low-Cost Feedgas for U.S. Gulf-Coast Export Terminals
- Floating LNG Technology Unlocking Stranded Offshore Gas Fields in Africa
- Competitiveness of Renewable Hydrogen Eroding Long-Term LNG Contract Appetite in Northeast Asia
For complete list of drivers and restraints, kindly check the Table Of Contents.
Segment Analysis
Liquefaction plants held 42.60% of 2025 revenues, the highest within the liquefied natural gas market. Capacity boosts in Qatar, the United States, and Australia underpin a forecast 10.75% CAGR to 2031. Electrified compressors and carbon capture trim emissions and sharpen competitive edges for integrated majors.
The segment's ecosystem now includes 904 LNG carriers, many fitted with low-methane-slip engines that curb greenhouse-gas intensity. FSRUs are accelerating import growth, especially in Europe, adding 77 MMtpy of regas capacity since 2021 and validating modular deployment for the LNG market.
Power generation retained 37.70% of demand in 2025 and is expanding through integrated LNG-to-power projects in Asia. These setups consolidate terminal, storage, and generation assets, lowering credit risk and deepening the LNG market footprint.
Marine bunkering is poised for a 13.55% CAGR, the fastest among applications. Fleet counts, port bunkering networks, and bio-LNG pilots signal durable growth, positioning shipping as a dynamic contributor to the liquefied natural gas market.
Complete Report Scope:
- By Infrastructure Type
- LNG Liquefaction Plants [Onshore Liquefaction, Floating LNG (FLNG), Mid-Scale (1-5 mtpa), and Small-Scale (<1 mtpa)]
- LNG Regasification Facilities [Onshore Import Terminals, and Floating Storage & Regasification Units (FSRU)]
- LNG Shipping Fleet [LNG Carriers by Containment (Moss and Membrane), Carrier Size (Q-Max, Q-Flex and Standard), LNG Bunkering Vessels]
- By End-Use Application
- Power Generation
- Industrial and Manufacturing
- Residential and Commercial
- Transportation (Marine Bunkering, Heavy-Duty Road Transport and Rail)
- By Scale
- Large-Scale (Above 5 mtpa)
- Mid-Scale (1 to 5 mtpa)
- Small-Scale (Below 1 mtpa)
- By Location
- Onshore
- Offshore (FLNG and FSRU)
- By Geography
- North America
- United States
- Canada
- Mexico
- Europe
- United Kingdom
- Germany
- France
- Spain
- Nordic Countries
- Russia
- Rest of Europe
- Asia-Pacific
- China
- India
- Japan
- South Korea
- ASEAN Countries
- Australia
- Rest of Asia-Pacific
- South America
- Brazil
- Argentina
- Colombia
- Rest of South America
- Middle East and Africa
- United Arab Emirates
- Saudi Arabia
- Qatar
- South Africa
- Egypt
- Rest of Middle East and Africa
- North America
Geography Analysis
The Middle East & Africa held 27.60% of the 2025 market. Qatar's North Field build-out from 77 MTPA to 126 MTPA by 2027 cements regional leadership and improves routing flexibility between Europe and Asia. New UAE and Mauritanian ventures add depth, though tanker insurance costs through Hormuz remain an operational concern for the liquefied natural gas market.
North America is set for a 10.25% CAGR through 2031 in the LNG market, driven by abundant shale gas and 13.3 MTPA of export trains entering service in 2025. Canada's Kitimat start-up and Henry-Hub-linked contracts amplify buyer interest, although temporary permitting pauses temper mid-decade FID outlooks.
Asia-Pacific remains the largest import center in the LNG market, with China purchasing 78.64 million t in 2024. First-time importers in the Philippines and Vietnam broaden the customer base, while small-scale LNG distribution gains traction for archipelagic supply. Renewable energy growth and hydrogen pilots in Japan and South Korea inject longer-term uncertainty into regional consumption.
Europe expanded regas capacity by 44% since 2021, installing multiple FSRUs to replace Russian pipeline volumes. Seasonal demand spikes sustain premium pricing, and impending EU methane rules will intensify supply-chain monitoring across the liquefied natural gas market.
- QatarEnergy LNG (Qatargas)
- Shell plc
- Cheniere Energy Inc.
- TotalEnergies SE
- Petronas
- Novatek
- Chevron Corporation
- Exxon Mobil Corporation
- Woodside Energy Group
- Equinor ASA
- Sempra Infrastructure
- Venture Global LNG
- ENI SpA
- KOGAS
- Mitsui O.S.K. Lines
- Golar LNG
- BW LNG
- Technip Energies
- Bechtel Corporation
- Fluor Corporation
- KBR Inc.
Additional Benefits:
- The market estimate (ME) sheet in Excel format
- 3 months of analyst support
TABLE OF CONTENTS
1 Introduction
- 1.1 Study Assumptions & Market Definition
- 1.2 Scope of the Study
2 Research Methodology
3 Executive Summary
4 Market Landscape
- 4.1 Market Overview
- 4.2 Market Drivers
- 4.2.1 Surge in Asia-Pacific Gas-to-Power Projects Seeking Midstream LNG Offtake Agreements
- 4.2.2 Rapid Uptake of LNG as Marine Bunker Fuel Following IMO-2020 Sulfur Cap in Europe
- 4.2.3 Permian Basin Associated Gas Output Unlocks Low-Cost Feed-gas for U.S. Gulf-Coast Export Terminals
- 4.2.4 Floating LNG Technology Unlocking Stranded Offshore Gas Fields in Africa
- 4.2.5 China's Coal-to-Gas Switching Policies for Industrial Boilers Driving Spot LNG Imports
- 4.2.6 Growing Demand from Energy-Intensive Data Centres for Firm Low-Carbon Supply in OECD Markets
- 4.3 Market Restraints
- 4.3.1 Prolonged FID Delays Owing to EPC-Cost Inflation & Module Fabrication Bottlenecks
- 4.3.2 Competitiveness of Renewable Hydrogen Eroding Long-Term LNG Contract Appetite in N.E. Asia
- 4.3.3 Regulatory Moratoria on New LNG Export Permits in U.S. & Canada
- 4.3.4 Geopolitical Risk at Key Chokepoints (Hormuz, Suez) Escalating LNG Shipping Insurance Costs
- 4.4 Supply-Chain Analysis
- 4.5 Regulatory Outlook
- 4.6 Technological Outlook
- 4.7 Porter's Five Forces
- 4.7.1 Bargaining Power of Suppliers
- 4.7.2 Bargaining Power of Buyers
- 4.7.3 Threat of New Entrants
- 4.7.4 Threat of Substitutes
- 4.7.5 Competitive Rivalry
5 Market Size & Growth Forecasts
- 5.1 By Infrastructure Type
- 5.1.1 LNG Liquefaction Plants [Onshore Liquefaction, Floating LNG (FLNG), Mid-Scale (1-5 mtpa), and Small-Scale (<1 mtpa)]
- 5.1.2 LNG Regasification Facilities [Onshore Import Terminals, and Floating Storage & Regasification Units (FSRU)]
- 5.1.3 LNG Shipping Fleet [LNG Carriers by Containment (Moss and Membrane), Carrier Size (Q-Max, Q-Flex and Standard), LNG Bunkering Vessels]
- 5.2 By End-Use Application
- 5.2.1 Power Generation
- 5.2.2 Industrial and Manufacturing
- 5.2.3 Residential and Commercial
- 5.2.4 Transportation (Marine Bunkering, Heavy-Duty Road Transport and Rail)
- 5.3 By Scale
- 5.3.1 Large-Scale (Above 5 mtpa)
- 5.3.2 Mid-Scale (1 to 5 mtpa)
- 5.3.3 Small-Scale (Below 1 mtpa)
- 5.4 By Location
- 5.4.1 Onshore
- 5.4.2 Offshore (FLNG and FSRU)
- 5.5 By Geography
- 5.5.1 North America
- 5.5.1.1 United States
- 5.5.1.2 Canada
- 5.5.1.3 Mexico
- 5.5.2 Europe
- 5.5.2.1 United Kingdom
- 5.5.2.2 Germany
- 5.5.2.3 France
- 5.5.2.4 Spain
- 5.5.2.5 Nordic Countries
- 5.5.2.6 Russia
- 5.5.2.7 Rest of Europe
- 5.5.3 Asia-Pacific
- 5.5.3.1 China
- 5.5.3.2 India
- 5.5.3.3 Japan
- 5.5.3.4 South Korea
- 5.5.3.5 ASEAN Countries
- 5.5.3.6 Australia
- 5.5.3.7 Rest of Asia-Pacific
- 5.5.4 South America
- 5.5.4.1 Brazil
- 5.5.4.2 Argentina
- 5.5.4.3 Colombia
- 5.5.4.4 Rest of South America
- 5.5.5 Middle East and Africa
- 5.5.5.1 United Arab Emirates
- 5.5.5.2 Saudi Arabia
- 5.5.5.3 Qatar
- 5.5.5.4 South Africa
- 5.5.5.5 Egypt
- 5.5.5.6 Rest of Middle East and Africa
- 5.5.1 North America
6 Competitive Landscape
- 6.1 Market Concentration
- 6.2 Strategic Moves (M&A, Partnerships, PPAs)
- 6.3 Market Share Analysis (Market Rank/Share for key companies)
- 6.4 Company Profiles (includes Global level Overview, Market level overview, Core Segments, Financials as available, Strategic Information, Products & Services, and Recent Developments)
- 6.4.1 QatarEnergy LNG (Qatargas)
- 6.4.2 Shell plc
- 6.4.3 Cheniere Energy Inc.
- 6.4.4 TotalEnergies SE
- 6.4.5 Petronas
- 6.4.6 Novatek
- 6.4.7 Chevron Corporation
- 6.4.8 Exxon Mobil Corporation
- 6.4.9 Woodside Energy Group
- 6.4.10 Equinor ASA
- 6.4.11 Sempra Infrastructure
- 6.4.12 Venture Global LNG
- 6.4.13 ENI SpA
- 6.4.14 KOGAS
- 6.4.15 Mitsui O.S.K. Lines
- 6.4.16 Golar LNG
- 6.4.17 BW LNG
- 6.4.18 Technip Energies
- 6.4.19 Bechtel Corporation
- 6.4.20 Fluor Corporation
- 6.4.21 KBR Inc.
7 Market Opportunities & Future Outlook
- 7.1 White-Space & Unmet-Need Assessment