
|
시장보고서
상품코드
2073482
휴머노이드 : 시장 점유율 분석, 업계 동향 및 통계, 성장 예측(2026-2031년)Humanoids - Market Share Analysis, Industry Trends & Statistics, Growth Forecasts (2026 - 2031) |
||||||
 Mordor Intelligence
Mordor Intelligence에 의하면, 휴머노이드 시장 규모는 2026년에 39억 3,000만 달러에 달할 것으로 예상되고, 예측 기간(2026-2031년) CAGR 35.26%로 성장해 2031년에는 178억 달러에 이를 전망입니다.
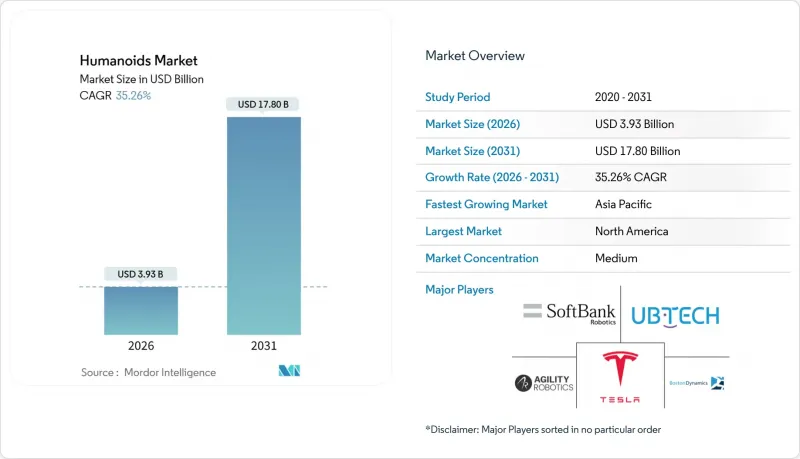
본 보고서는 동작 유형(바퀴 구동, 이족 보행, 하이브리드/다족), 구성 요소(하드웨어, 소프트웨어, 서비스), 최종 사용자 산업(의료시설, 소매·쇼핑 센터, 제조 및 창고, 기타), 폼 팩터(풀사이즈 : 140cm 초과, 미드사이즈 : 100-140cm, 스몰 : 100cm 이하, 기타), 지역별로 분류되어 있습니다. 시장 전망은 금액(달러) 기준으로 제시되어 있습니다.
세계의 휴머노이드 시장 동향 및 인사이트
고령화에 따른 돌봄 서비스의 격차가 수요를 가속화
2024년, 일본의 65세 이상 인구 비율은 29.1%에 달했으며, 2030년까지 의료 종사자 부족 규모는 240만 명을 넘어설 가능성이 있습니다. 병원에서는 환자의 지속적인 모니터링, 투약 업무, 사회적 교류를 위해 휴머노이드 로봇을 도입하여, 서비스 품질을 일정하게 유지하면서 운영 비용을 30-40% 절감하고 있습니다. 혼다의 “하루"는 현재 스페인 노인 병동에서 간호사를 지원하고 있으며, 국경을 초월한 유용성을 입증하고 있습니다. 비슷한 인력 부족 문제에 직면한 소매업 및 접객업 종사자들은 직원 수가 감소했음에도 불구하고 고객 경험을 유지하기 위해 안내 및 서비스용 로봇을 도입하고 있습니다. 한국에서는 이미 직원 1만 명당 1,102대의 로봇이 가동되고 있으며, 이는 세계 최고 수준의 로봇 밀도입니다.
AI의 비용 곡선이 대당 2만 5,000달러 미만으로 떨어집니다.
규모의 경제, 표준화된 액추에이터, 저비용 GPU 덕분에 제조 비용은 2025년의 3만 5,000달러에서 2030년까지 목표인 1만 3,000-1만 7,000달러로 낮아질 전망입니다. 테슬라는 자동차 산업 수준의 생산 능력을 반영하여, 대당 2만-3만 달러의 ‘옵티머스"를 1만 대 생산할 전망입니다. 아프로닉과 구글 딥마인드의 제휴를 통해 대규모 언어 모델의 추론 능력이 아폴로의 조작 기술과 결합되어, 과거에는 10만 달러 상당의 서버가 필요했던 처리를 엣지 프로세서에서 실행할 수 있게 되었습니다. 전기차 산업 덕분에 이미 2010년 수준보다 85% 낮아진 배터리 팩 가격은 총 소유 비용을 더욱 낮추고 있습니다.
코봇에 비해 높은 설비 투자(Capex)와 시간당 0.50달러를 초과하는 총 소유 비용(TCO)
현재 휴머노이드의 가동 비용은 시간당 0.75-1.25달러인 반면, 6축 코봇의 경우 0.35-0.50달러입니다. 고정밀 기어박스, 25개 이상의 자유도, 고도 센서 어레이로 인해 도입 비용과 유지 관리 비용 모두 급등하고 있습니다. 사람의 손이 닿는 범위나 이동 경로가 필요한 작업의 경우, 코봇을 도입하려면 시설을 대대적으로 재설계해야 하므로 시간당 비용 측면에서 갖는 이점이 상쇄되고 맙니다. 공장 평균 임금이 4만 5,000달러를 넘는 선진국에서는 휴머노이드의 연간 운영 비용인 2만 5,000-3만 5,000달러가 점점 더 경쟁력 있는 수준으로 자리 잡고 있습니다.
부문별 분석
2025년 매출액 중 바퀴 구동형이 62.40%를 차지했으며, 평평한 바닥을 가진 공장이나 물류 센터에서 에너지 효율이 높고 유지보수 부담이 적은 이동 수단이 현재 사용자들에게 선호되고 있음이 드러나고 있습니다. 이러한 압도적인 시장 점유율 덕분에, 같은 해에 바퀴 구동형이 휴머노이드 시장 점유율의 가장 큰 부분을 차지했습니다. 그러나 이족 보행 로봇 부문은 연평균 성장률(CAGR) 57.1%로 성장하고 있으며, 비용 감소에 따라 휴머노이드 시장이 인간 및 환경과의 완벽한 호환성을 지향하는 방향으로 전환될 것임을 시사하고 있습니다.
개선된 모델 예측 제어, 적응형 발목 관절, 전신 협응 알고리즘을 통해 1.5 m/s를 초과하는 정상 보행이 가능해졌으며, 동시에 에너지 소비량을 30% 절감했습니다. 하이브리드 로봇이나 다족 로봇은 잔해나 기복이 심한 지형으로 인해 바퀴 사용이 어려운 재난 대응 분야에서 여전히 틈새 솔루션으로 남아 있습니다. AI 동작 계획 알고리즘이 성숙해짐에 따라, 구매자들은 동일한 이족 보행 유닛을 여러 거점에 재배치할 것으로 예상하고 있으며, 이를 통해 고객 생애 가치(LTV)가 향상되고 소프트웨어 업데이트와 운영 성과 간의 연계가 더욱 강화될 전망입니다.
2025년에는 휴머노이드 시장 규모의 67.20%를 하드웨어가 차지했으며, 이는 액추에이터, 복합재 프레임, 고해상도 센서 스택에 대한 막대한 설비 투자를 반영한 것입니다. 그러나 소프트웨어 매출은 연평균 성장률(CAGR) 55.9%를 기록하며, 그 어떤 기계적 업그레이드 주기보다도 높은 성장세를 보이고 있습니다.
클라우드를 활용한 비전 기술, 자연어 처리 모델, 강화 학습 스택을 통해 동일한 섀시가 오전에는 키팅 작업을 수행하고, 업무 시간 외에는 컨시어지 업무를 수행할 수 있게 됩니다. 정기적인 라이선스 비용이 하드웨어의 일시적인 이익률을 상회함에 따라, 각 벤더들은 가동 시간, 보안 패치, 기능 제공을 보장하는 서비스 수준 계약(SLA)으로 전환하고 있습니다. 이러한 스마트폰 생태계를 연상시키는 움직임에 따라, 물리적 제품 카테고리 내에서도 코드가 가장 큰 차별화 요인으로 자리매김함에 따라, 구매자들은 사이버 보안 및 데이터 소유자와 관련된 조항에 더욱 주목하고 있습니다.
지역별 분석
북미는 20억 달러 규모의 벤처 자금 조달과 도입 위험을 줄여주는 초기 단계 규제 샌드박스의 지원에 힘입어, 2025년 전 세계 매출의 37.40%를 차지했습니다. 테슬라, 보스턴 다이내믹스, 애질리티 로봇 등 미국의 각 OEM 기업들은 2024년부터 2025년에 걸쳐 총 12억 달러를 확보하여, 상용화 도구 및 시범 운영의 자금원으로 활용했습니다. 캐나다의 한 대학은 컴플라이언트 액추에이터 연구를 전문으로 하고 있으며, 멕시코는 정밀 기어 케이스를 공급함으로써 NAFTA공급망 통합을 휴머노이드 경제에 접목하고 있습니다.
아시아태평양은 가장 빠르게 성장하고 있는 시장으로, 2031년까지 연평균 성장률(CAGR) 53.2%를 기록하며 확대되고 있습니다. 중국에서 100억 달러 규모의 ‘국가 휴머노이드 프로젝트"는 각 부처의 보조금, 군의 조달 및 구매 할당량을 통합한 반면, 6개 현지 기업은 2025년 생산 대수 목표로 각각 1,000대 이상을 설정했습니다. 한국에서는 3조 5,000억 원 규모의 경기 부양책을 통해 정책은행을 경유해 민간 연구소에 자금이 공급되며, 연구개발 및 국내 부품 사용률 제도가 촉진되고 있습니다. 일본은 자동차 산업의 전통을 바탕으로 고정밀 스트럿과 조인트 모듈을 생산하고 있으며, 인도는 저비용으로 클라우드 제어용 미들웨어를 공급하고 있습니다. 이러한 요인들이 복합적으로 작용하여 생산 규모를 확대하고 단위 비용을 절감함으로써, 아시아 신흥 경제권 전체의 휴머노이드 시장을 견인하고 있습니다.
유럽에서는 정책 주도형으로 꾸준한 성장이 나타나고 있습니다. 독일의 “인더스트리 4.0"관련 시설에서는 다품종 소량 생산 조립 공정을 해외로 이전하는 대신, 국내에 유지하기 위해 휴머노이드를 도입하고 있습니다. EU의 AI 책임 지침안은 엄격한 안전 장치 설계를 의무화하고 있어, 인증에 따른 부담은 늘어나겠지만 장기적인 평판 리스크는 줄어들 것입니다. 프랑스와 영국은 첨단 햅틱 센서의 연구 개발에 중점을 두고 있는 반면, 북유럽 국가들에서는 노인 돌봄 시범 사업을 통해 장기 요양 현장에서 로봇의 효과성이 검증되고 있습니다. 인증에 소요되는 기간이 길어 일부 구매자들은 도입을 미룰 수밖에 없지만, 독일과 이탈리아의 유서 깊은 자동차 부품 공급업체들이 서브어셈블리 생산에 나서면서 대서양을 가로지르는 경쟁이 치열해지고 있습니다.
기타 혜택
- 엑셀 형식 시장 예측(ME) 시트
- 3개월간의 애널리스트 지원
자주 묻는 질문
목차
제1장 서론
제2장 조사 방법
제3장 주요 요약
제4장 시장 구도
제5장 시장 규모 및 성장 예측
제6장 경쟁 구도
제7장 시장 기회 및 향후 전망
KTH 26.07.08According to Mordor Intelligence, the humanoids market size is estimated at USD 3.93 billion in 2026, and is expected to reach USD 17.80 billion by 2031, at a CAGR of 35.26% during the forecast period (2026-2031).
This report is Segmented by Motion Type (Wheel-Drive, Biped, Hybrid/Multi-leg), Component (Hardware, Software, Services), End-User Industry (Healthcare Facilities, Retail & Shopping Centres, Manufacturing & Warehousing, and More), Form Factor (Full-Size Greater Than 140cm, Mid-Size 100-140cm, Small Less Than 100cm, and More), and Geography. The Market Forecasts are Provided in Terms of Value (USD).
Global Humanoids Market Trends and Insights
Aging-Population Care Gap Intensifies Demand
Japan's population aged 65 years and older reached 29.1% in 2024, and healthcare worker deficits may exceed 2.4 million by 2030. Hospitals are turning to humanoids for continuous patient monitoring, medication rounds, and social interaction, trimming operating costs by 30-40% while keeping quality consistent. Honda's Haru units now assist nurses in Spanish geriatric wards, demonstrating cross-border relevance. Retail and hospitality operators facing similar labour gaps are introducing reception and service robots to protect customer experience despite shrinking staff levels. South Korea already operates 1,102 robots per 10,000 employees, the highest robot density worldwide.
AI Cost Curve Falling Below USD 25 k Per Unit
Economies of scale, standardised actuators, and low-cost GPUs are pushing manufactured costs down from USD 35,000 in 2025 to a targeted USD 13,000-17,000 by 2030. Tesla expects to build 10,000 Optimus units priced at USD 20,000-30,000 each, reflecting automotive-style throughput. Apptronik's partnership with Google DeepMind ties large-language-model reasoning to Apollo's manipulation skills, compressing what once required USD 100,000 servers onto edge processors. Battery pack prices, already 85% lower than 2010 levels thanks to the electric-vehicle industry, further erode total cost of ownership.
High Cap-ex & TCO Above USD 0.50/hr Compared with Cobots
Operating a humanoid costs USD 0.75-1.25 per hour today, versus USD 0.35-0.50 for six-axis cobots. Precision gearboxes, 25-plus degrees of freedom, and richer sensor arrays inflate both acquisition and maintenance outlays. Nevertheless, in tasks demanding human reach and navigation, cobots require costly re-engineering of facilities, offsetting their per-hour advantage. In developed economies where average factory wages top USD 45,000, a humanoid's USD 25,000-35,000 annual running cost is increasingly competitive.
Other drivers and restraints analyzed in the detailed report include:
- Factory Labour Shortages in G7 & China
- National "Humanoid 2025" Programmes (China, South Korea)
- Safety / Liability Regulation Uncertainty
For complete list of drivers and restraints, kindly check the Table Of Contents.
Segment Analysis
The wheel-drive class held 62.40% of 2025 revenues, underscoring current user preference for energy-efficient, low-maintenance mobility in flat-floored plants and fulfilment centres. This dominance meant the wheel cohort accounted for the largest slice of the humanoids market share that year. However, the biped category is expanding at a 57.1% CAGR, signalling that the humanoids market will pivot toward full human-environment compatibility as costs fall.
Improved model-predictive controllers, compliant ankle joints, and whole-body coordination algorithms are delivering steady-state walking above 1.5 m/s while cutting energy draw by 30%. Hybrid and multi-leg robots remain niche solutions for disaster response where debris or uneven terrain precludes wheels. As AI motion planners mature, buyers anticipate re-deploying the same biped unit across multiple sites, raising lifetime value and tightening the link between software updates and operational output.
Hardware captured 67.20% of the humanoids market size in 2025, reflecting large capital bills for actuators, composite frames, and high-resolution sensor stacks. Yet software revenue is tracking a 55.9% CAGR, outpacing any mechanical upgrade cycle.
Cloud-enhanced vision, natural-language models, and reinforcement-learning stacks enable the same chassis to perform kitting in the morning and concierge duties after hours. As recurring licence fees overtake one-off hardware margins, vendors are shifting to service-level agreements that guarantee uptime, security patches, and feature drops. This echo of the smartphone ecosystem positions code as the foremost differentiator even inside a physical-goods category, and heightens buyer focus on cybersecurity and data-ownership clauses.
Complete Report Scope:
- By Motion Type
- Wheel-drive
- Biped
- Hybrid / Multi-leg
- By Component
- Hardware
- Software
- Services
- By End-user Industry
- Healthcare Facilities
- Retail and Shopping Centres
- Manufacturing and Warehousing
- Hospitality (Hotels, Theme Parks)
- Academic and Research Institutes
- By Form Factor
- Full-size (Greater than 140 cm)
- Mid-size (100-140 cm)
- Small (Less than 100 cm)
- Upper-torso only
- By Geography
- North America
- United States
- Canada
- Mexico
- Europe
- United Kingdom
- Germany
- France
- Italy
- Rest of Europe
- Asia-Pacific
- China
- Japan
- India
- South Korea
- Rest of Asia-Pacific
- Middle East
- Israel
- Saudi Arabia
- United Arab Emirates
- Turkey
- Rest of Middle East
- Africa
- South Africa
- Egypt
- Rest of Africa
- South America
- Brazil
- Argentina
- Rest of South America
- North America
Geography Analysis
North America retained 37.40% of global 2025 revenue, catalysed by USD 2 billion in venture rounds and early regulatory sandboxes that cut deployment risk. United States OEMs such as Tesla, Boston Dynamics, and Agility Robotics collectively secured USD 1.2 billion during 2024-2025, bankrolling commercial tooling and pilot roll-outs. Canada's universities specialise in compliant-actuator research, and Mexico supplies precision gear casings, threading NAFTA supply-chain integration into humanoid economics.
Asia-Pacific is the fastest-growing theatre, advancing at a 53.2% CAGR to 2031. China's USD 10 billion National Humanoid programme aligns provincial grants, military adoption, and purchasing quotas, while six local firms target >= 1,000 units each for 2025 volume. South Korea's KRW 3.5 trillion stimulus channels funds through its policy bank to private labs, fostering R&D and domestic content rules. Japan's automotive heritage yields high-precision strut and joint modules, and India supplies cloud-control middleware at lower cost. Collectively, these forces scale output and compress unit costs, bolstering the humanoids market across emerging Asian economies.
Europe posts steady, policy-led growth. Germany's Industrie 4.0 facilities adopt humanoids to keep high-mix assembly at home rather than offshoring. The EU's draft AI liability directive compels rigorous fail-safe designs, adding qualification overhead but reducing long-run reputational risk. France and the United Kingdom emphasise advanced haptic-sensor R&D, while Nordic eldercare pilots validate robots in long-term-care settings. Although certification timelines push some buyers to slower roll-outs, established automotive suppliers in Germany and Italy are lining up to build sub-assemblies, reinforcing trans-Atlantic competition.
- Honda Motor Co., Ltd.
- Toyota Motor Corporation
- SoftBank Robotics Group Corp.
- UBTECH Robotics Inc.
- PAL Robotics SL
- Hanson Robotics Ltd.
- Kawada Robotics Corporation
- Promobot LLC
- Invento Robotics Pvt. Ltd.
- ROBOTIS Co., Ltd.
- Boston Dynamics Inc.
- Tesla, Inc. (Optimus)
- Agility Robotics LLC
- Figure AI, Inc.
- Engineered Arts Ltd.
- Unitree Robotics Co., Ltd.
- Fourier Intelligence Co., Ltd.
- Xiaomi Corp. - Robotics Lab
- Samsung Electronics Co., Ltd.
- Apptronik Inc.
Additional Benefits:
- The market estimate (ME) sheet in Excel format
- 3 months of analyst support
TABLE OF CONTENTS
1 INTRODUCTION
- 1.1 Study Assumptions and Market Definition
- 1.2 Scope of the Study
2 RESEARCH METHODOLOGY
3 EXECUTIVE SUMMARY
4 MARKET LANDSCAPE
- 4.1 Market Overview
- 4.2 Market Drivers
- 4.2.1 Aging-population care gap intensifies demand
- 4.2.2 AI cost curve falling below USD 25k per unit
- 4.2.3 Factory labor shortages in G7 and China
- 4.2.4 National "Humanoid 2025" programs (China, S-Korea)
- 4.2.5 IEC/ISO elderly-care robot safety standards
- 4.2.6 EV motor and battery supply-chain spill-overs
- 4.3 Market Restraints
- 4.3.1 High cap-ex and TCO above USD 0.50 /hr compared with cobots
- 4.3.2 Safety / liability regulation uncertainty
- 4.3.3 Rare-earth magnet supply bottlenecks
- 4.3.4 Societal acceptance and labour-union pushback
- 4.4 Value / Supply-Chain Analysis
- 4.5 Regulatory Landscape
- 4.6 Technological Outlook
- 4.7 Porter's Five Forces Analysis
- 4.7.1 Bargaining Power of Suppliers
- 4.7.2 Bargaining Power of Buyers
- 4.7.3 Threat of New Entrants
- 4.7.4 Threat of Substitutes
- 4.7.5 Intensity of Competitive Rivalry
5 MARKET SIZE AND GROWTH FORECASTS (VALUE)
- 5.1 By Motion Type
- 5.1.1 Wheel-drive
- 5.1.2 Biped
- 5.1.3 Hybrid / Multi-leg
- 5.2 By Component
- 5.2.1 Hardware
- 5.2.2 Software
- 5.2.3 Services
- 5.3 By End-user Industry
- 5.3.1 Healthcare Facilities
- 5.3.2 Retail and Shopping Centres
- 5.3.3 Manufacturing and Warehousing
- 5.3.4 Hospitality (Hotels, Theme Parks)
- 5.3.5 Academic and Research Institutes
- 5.4 By Form Factor
- 5.4.1 Full-size (Greater than 140 cm)
- 5.4.2 Mid-size (100-140 cm)
- 5.4.3 Small (Less than 100 cm)
- 5.4.4 Upper-torso only
- 5.5 By Geography
- 5.5.1 North America
- 5.5.1.1 United States
- 5.5.1.2 Canada
- 5.5.1.3 Mexico
- 5.5.2 Europe
- 5.5.2.1 United Kingdom
- 5.5.2.2 Germany
- 5.5.2.3 France
- 5.5.2.4 Italy
- 5.5.2.5 Rest of Europe
- 5.5.3 Asia-Pacific
- 5.5.3.1 China
- 5.5.3.2 Japan
- 5.5.3.3 India
- 5.5.3.4 South Korea
- 5.5.3.5 Rest of Asia-Pacific
- 5.5.4 Middle East
- 5.5.4.1 Israel
- 5.5.4.2 Saudi Arabia
- 5.5.4.3 United Arab Emirates
- 5.5.4.4 Turkey
- 5.5.4.5 Rest of Middle East
- 5.5.5 Africa
- 5.5.5.1 South Africa
- 5.5.5.2 Egypt
- 5.5.5.3 Rest of Africa
- 5.5.6 South America
- 5.5.6.1 Brazil
- 5.5.6.2 Argentina
- 5.5.6.3 Rest of South America
- 5.5.1 North America
6 COMPETITIVE LANDSCAPE
- 6.1 Market Concentration
- 6.2 Strategic Moves
- 6.3 Market Share Analysis
- 6.4 Company Profiles (includes Global level Overview, Market level overview, Core Segments, Financials as available, Strategic Information, Market Rank/Share, Products and Services, Recent Developments)
- 6.4.1 Honda Motor Co., Ltd.
- 6.4.2 Toyota Motor Corporation
- 6.4.3 SoftBank Robotics Group Corp.
- 6.4.4 UBTECH Robotics Inc.
- 6.4.5 PAL Robotics SL
- 6.4.6 Hanson Robotics Ltd.
- 6.4.7 Kawada Robotics Corporation
- 6.4.8 Promobot LLC
- 6.4.9 Invento Robotics Pvt. Ltd.
- 6.4.10 ROBOTIS Co., Ltd.
- 6.4.11 Boston Dynamics Inc.
- 6.4.12 Tesla, Inc. (Optimus)
- 6.4.13 Agility Robotics LLC
- 6.4.14 Figure AI, Inc.
- 6.4.15 Engineered Arts Ltd.
- 6.4.16 Unitree Robotics Co., Ltd.
- 6.4.17 Fourier Intelligence Co., Ltd.
- 6.4.18 Xiaomi Corp. - Robotics Lab
- 6.4.19 Samsung Electronics Co., Ltd.
- 6.4.20 Apptronik Inc.
7 MARKET OPPORTUNITIES and FUTURE OUTLOOK
- 7.1 White-space and Unmet-need Assessment