
|
시장보고서
상품코드
2073484
웹 분석 : 시장 점유율 분석, 업계 동향 및 통계, 성장 예측(2026-2031년)Web Analytics - Market Share Analysis, Industry Trends & Statistics, Growth Forecasts (2026 - 2031) |
||||||
 Mordor Intelligence
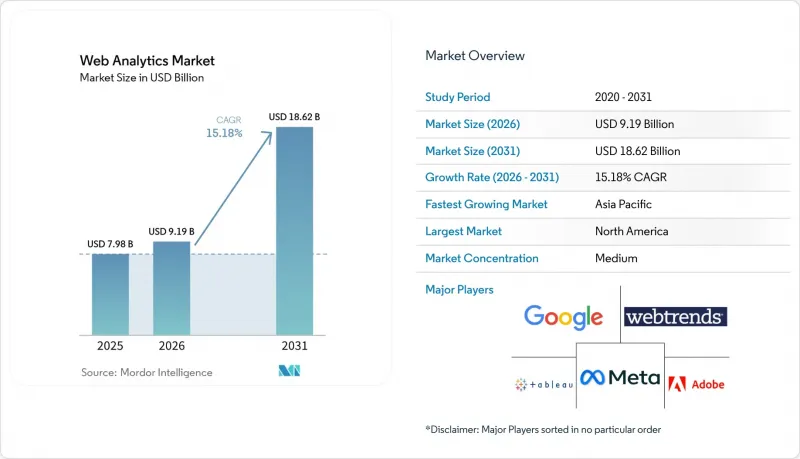
Mordor Intelligence에 의하면, 웹 분석 시장 규모는 2025년 79억 8,000만 달러로 평가되었습니다. 2026년에는 91억 9,000만 달러로 확대되어 2026년부터 2031년에 걸쳐 CAGR 15.18%로 성장을 지속하여, 2031년에는 186억 2,000만 달러에 이를 것으로 예측됩니다.
본 보고서는 용도(모바일 분석, 컨텐츠 마케팅, 소셜 미디어 관리 등), 제공 형태(솔루션 및 서비스), 도입 모델(클라우드 기반 및 On-Premise형), 기업 규모(대기업 및 중소기업), 최종 사용자 업종(소매 및 전자상거래, 제조업 등) 및 지역별로 분류되어 있습니다. 시장 전망은 금액(달러) 기준으로 제시되어 있습니다.
세계의 웹 분석 시장 동향 및 인사이트
전자상거래 거래량의 폭발적인 증가
온라인 소매 거래량은 급증하고 있으며, 분석 요구 사항은 단순한 페이지 뷰 파악에 그치지 않고, 모든 상품과의 상호작용이나 결제 과정의 세밀한 단계를 이벤트 단위로 포착하는 방향으로 진화하고 있습니다. 소매업체들은 현재 1분당 수백만 건의 이벤트를 수집하고, 1초도 채 걸리지 않는 시간 내에 개인화된 응답을 제공하는 확장 가능한 클라우드 데이터 파이프라인을 도입하고 있습니다. 세밀한 데이터 피드를 통해 마케팅 접점과 고객 생애 가치(LTV)를 연결하는 정교한 어트리뷰션 모델을 구현할 수 있게 되었습니다. 이는 중견 기업들에게 그동안 부족했던 기능입니다. 그 결과, 성수기에 자동 스케일링을 수행하는 SaaS(Software-as-a-Service) 플랫폼이 신규 도입 시장에서 점유율을 확대되고 있습니다. 웹 분석 시장 데이터를 활용한 실시간 수익 대시보드는 머천다이징 팀과 공급망 팀에게 경영진 수준의 KPI로 자리 잡고 있습니다.
모바일 및 앱 기반 분석의 급속한 확산
모바일 분석은 크래시 로그에서 앱 내 이벤트와 웹 세션을 통합하는 통합된 여정 오케스트레이션으로 전환되었습니다. 이 브랜드는 앱 사용자가 장바구니를 포기하는 순간 맞춤형 브라우저 프로모션을 자동으로 제공함으로써, 채널 간의 단절 현상을 해소하고 있습니다. 기기 ID나 쿠키를 넘나드는 신원 식별은 동의를 얻은 퍼스트파티 데이터에 의존하고 있으며, 플랫폼의 개인정보 보호 규정을 준수하면서 프로파일을 대조하는 고객 데이터 플랫폼(CDP)에 대한 투자가 촉진되고 있습니다. 아시아태평양의 '모바일 우선' 경제권에서는 전환율 향상이 가장 두드러지며, 현재 북미와 유럽에도 도입되고 있는 옴니채널 예산 모델이 효과적임이 입증되었습니다. 기업들은 코드를 수정할 필요 없이 지역 규정에 맞춘 개인정보 보호 안내를 통합할 수 있는 SDK의 유연성을 우선시하고 있습니다.
엄격한 데이터 보호 및 개인정보 보호 규정
규제 당국은 동의 배너 설정 오류나 불법 데이터 전송에 대해 기업에 벌금을 부과하고 있으며, 규정 위반은 중대한 위험 요인이 되고 있습니다. 이에 대응해 기업들은 분석 데이터를 가져오기 전에 개인 식별자를 삭제하는 서버 측 게이트웨이를 도입하고 있지만, 아키텍처가 복잡해짐에 따라 프로젝트 공수와 서비스 비용이 증가하고 있습니다. 중소기업은 개인정보 보호를 중시하는 턴키형 벤더를 선호하는 반면, 다국적 기업들은 사내에 개인정보 보호 엔지니어링 팀을 구성하고 있습니다. 성숙도의 편차로 인해 성과 격차가 확대되고 있으며, 규정 준수를 기반으로 한 퍼스트 파티 데이터 전략이 웹 분석 시장에서 경쟁 우위로 부상하고 있습니다.
부문별 분석
온라인 마케팅 및 마케팅 자동화는 2025년 매출의 40.65%를 차지하며, 웹 분석 시장의 핵심 활용 사례로서의 역할을 부각시켰습니다. 이 부문은 예산이 수익 성과와 직접적으로 연계된다는 이점을 누리고 있으며, 기업의 지속 이용률을 높이고 있습니다. 한편, 브랜드들이 고객 획득 비용을 절감하기 위한 멀티 터치 어트리뷰션을 모색하는 가운데, 고객 여정 매핑은 15.95%라는 가장 높은 연평균 성장률(CAGR)을 기록하고 있습니다. 이러한 전환에 따라 경로 분석, 세션 재현 및 신원 통합에 대한 수요가 증가하고 있습니다.
이러한 변화는 다양한 기기에서 워크플로를 개인화하는 AI 기반 실험 도구에 대한 업셀링 기회도 창출하고 있습니다. 고객 데이터 플랫폼(CDP)은 이메일, 소셜 미디어, 콜센터의 이벤트를 통합하여 성장 및 고객 유지 팀이 활용할 수 있는 통합 대시보드에 정보를 제공합니다. 개인정보 보호 규제가 강화되는 가운데, 각 벤더사는 모든 고객 여정에 동의 상태 플래그를 포함시켜 차별화를 꾀하고 있으며, 이러한 접근 방식은 규정 준수를 중시하는 업계에서 지지를 얻고 있습니다.
2025년 지출 중 솔루션이 63.85%를 차지했으며, 그 주된 부분은 데이터 수집, 시각화, 예측 모듈의 라이선스 비용이었습니다. 한편, 서비스 부문은 연평균 성장률(CAGR) 16.05%를 기록했는데, 이는 기업들이 서버 측 태깅, 스키마 설계, 동의 워크플로우 구축을 위해 컨설턴트를 기용하고 있기 때문입니다. 고도의 프로젝트에서는 데이터 사이언스자와 개인정보 보호 전문 변호사가 협력하여 모델이 실제 적용되기 전에 그 기능을 검증하고 있으며, 이러한 학제 간 수요가 높은 단가를 이끌고 있습니다.
매니지드 서비스는 사내에 필요한 기술을 보유하지 않은 중견 기업들로부터 지지를 받고 있으며, 인프라, 모니터링, 규정 업데이트를 월정액으로 통합하여 제공합니다. 마케팅 팀이 AI를 활용한 인사이트 도출 역량을 향상시켜 감에 따라, 교육 수요도 급증하고 있습니다. 이러한 동향들이 맞물리면서, 파트너 생태계는 벤더 시장 진출 전략에서 핵심적인 요소로서 그 중요성이 커지고 있습니다.
지역별 분석
북미는 성숙한 광고 생태계, 높은 클라우드 도입률, 그리고 풍부한 분석 인력에 힘입어 2025년 매출의 37.75%를 차지했습니다. 기업들은 분석 기능을 CRM, 전자상거래, 워크플로우 도구와 연동하는 통합 제품군을 활용하고 있습니다. 캘리포니아주의 CPRA(캘리포니아주 개인정보 보호법)와 관련된 규제 집행이 강화되는 가운데, 규정 준수 관련 투자는 여전히 높은 수준을 유지하고 있으며, 동의 거버넌스 모듈의 업그레이드가 진행되고 있습니다.
유럽에서는 GDPR(EU 개인정보보호규정)에 따른 감독 강화로 인해 기업들이 퍼스트파티 데이터 전략으로 전환하는 가운데, 10%대 중반의 성장이 예상됩니다. 서버 측 태깅이 점차 보편화되면서, 애널리틱스 관련 지출은 마케팅 예산에서 개인정보 보호 및 IT 예산으로 전환되고 있습니다. 독일이나 프랑스 등의 국가들은 국내 데이터센터를 우선시하고 있으며, 국경을 넘는 데이터 전송이 승인된 로컬 호스팅 옵션을 제공하는 업체에 대한 수요가 증가하고 있습니다. EU 내에서 호스팅되는 도입 프로젝트의 웹 분석 시장 규모는 2030년까지 꾸준히 확대될 전망입니다.
아시아태평양은 가장 성장세가 두드러진 지역으로, 연평균 성장률(CAGR)은 15.70%로 성장을 지속하고 있습니다. 동남아시아와 인도의 '모바일 우선' 경제 분야에서는 대역폭 제약이 있는 상황에서도 앱 이벤트를 포착할 수 있는 경량 SDK의 도입을 장려하고 있습니다. 소셜 커머스의 통합이 구매 프로세스 분석을 촉진하고 있으며, 지역 슈퍼 앱 생태계에서는 내장형 결제, 차량 공유, 메시징을 단일 퍼널에서 처리할 수 있는 분석 엔진이 요구되고 있습니다. 인도네시아와 태국에서 정부가 주도하는 '디지털 국가'가 이니셔티브를 통해 공공 부문 포털 사이트에서의 도입이 더욱 확대되고 있습니다.
중동 및 아프리카에서는 광대역 인터넷의 보급이 확대됨에 따라 새로운 활기가 나타나고 있습니다. 투자는 걸프협력회의(GCC) 회원국에 집중되어 있으며, 이 지역에서는 금융 서비스 및 여행 업체들이 고객 참여 추적 시스템의 현대화를 추진하고 있습니다. 남미에서는 브라질의 전자상거래 붐과 아르헨티나의 핀테크 확대를 견인력으로 삼아 꾸준한 성장세를 보이고 있으며, 기존 인프라를 우회하는 비용 효율적인 클라우드 분석에 대한 수요가 증가하고 있습니다.
기타 혜택 :
- 엑셀 형식 시장 예측(ME) 시트
- 3개월간의 애널리스트 지원
자주 묻는 질문
목차
제1장 서론
제2장 조사 방법
제3장 주요 요약
제4장 시장 구도
제5장 시장 규모 및 성장 예측
제6장 경쟁 구도
제7장 시장 기회 및 향후 전망
KTH 26.07.07According to Mordor Intelligence, the web analytics market size is expected to grow from USD 7.98 billion in 2025 to USD 9.19 billion in 2026 and is forecast to reach USD 18.62 billion by 2031 at 15.18% CAGR over 2026-2031.
This report is Segmented by Application ( Mobile Analytics, Content Marketing, Social Media Management, and More), Offering (Solutions, and Services), Deployment Model (Cloud-Based, and On-Premises), Organization Size (Large Enterprises, and Small and Medium Enterprises), End-User Vertical (Retail and E-Commerce, Manufacturing, and More), and Geography. The Market Forecasts are Provided in Terms of Value (USD).
Global Web Analytics Market Trends and Insights
Explosion of E-commerce Transaction Volumes
Online retail volumes have soared, pushing analytics requirements beyond page views toward event-level capture of every product interaction and checkout micro-step. Retailers now deploy elastic cloud data pipelines that ingest millions of events per minute and return sub-second personalization responses. Granular data feeds empower sophisticated attribution models that link marketing touchpoints to lifetime value, a capability mid-market merchants previously lacked. As a result, Software-as-a-Service platforms that auto-scale during holiday peaks command increased share of new deployments. Real-time revenue dashboards using web analytics market data have become board-level KPIs for merchandising and supply-chain teams alike.
Rapid Adoption of Mobile and App-Based Analytics
Mobile analytics has shifted from crash logs to unified journey orchestration that stitches in-app events with web sessions. Brands trigger personalized browser offers the moment app users abandon carts, dissolving channel silos. Identity resolution across device IDs and cookies relies on consented first-party data, prompting investment in Customer Data Platforms that reconcile profiles while honoring platform privacy rules. Asia Pacific's mobile-first economies showcase highest conversion uplifts, validating omnichannel budgeting models now rolling into North America and Europe. Enterprises prioritize SDK flexibility that lets them embed privacy prompts tailored to regional regulation without code rewrites.
Stringent Data Protection and Privacy Regulations
Regulators fine companies for misconfigured consent banners and illegal data transfers, turning compliance lapses into material risk. Enterprises respond by deploying server-side gateways that strip personal identifiers before analytics ingestion, yet architecture complexity inflates project timelines and services spend. Smaller firms gravitate toward turnkey privacy-centric vendors, while multinationals create internal privacy engineering teams. The uneven maturity widens performance gaps, with compliant first-party data strategies emerging as competitive moats in the web analytics market.
Other drivers and restraints analyzed in the detailed report include:
- Shift Toward Data-Driven Marketing Automation
- Rising Investment in Customer Experience Optimization
- Cookie Deprecation Reducing Third-Party Tracking Capabilities
For complete list of drivers and restraints, kindly check the Table Of Contents.
Segment Analysis
Online Marketing and Marketing Automation accounted for 40.65% of 2025 revenue, underscoring its role as the baseline use case for the web analytics market. The segment benefits from direct budget linkage to revenue outcomes, driving enterprise retention rates. Customer Journey Mapping, on the other hand, posts the highest 15.95% CAGR as brands seek multi-touch attribution that lowers acquisition costs. This transition elevates demand for path analysis, session replay, and identity stitching.
The shift also unlocks upsell for AI-driven experimentation tools that personalize flows across devices. Customer Data Platforms integrate email, social, and call-center events, feeding unified dashboards consumed by growth and retention teams. As privacy rules tighten, vendors differentiate by embedding consent status flags into every journey visualization, an approach resonating with compliance-heavy sectors.
Solutions represented 63.85% of 2025 spending, anchored by licensing of data collection, visualization, and predictive modules. However, services display a 16.05% CAGR as enterprises engage consultants for server-side tagging, schema design, and consent workflow engineering. Advanced projects pair data scientists with privacy attorneys to validate model features before deployment, a multidisciplinary demand driving premium bill rates.
Managed services appeal to mid-market firms lacking internal skills, bundling infrastructure, monitoring, and regulatory updates into fixed monthly fees. Training engagements spike as marketing teams upskill on AI-assisted insight generation. Collectively, these trends elevate partner ecosystems as core components of vendor go-to-market strategies.
Complete Report Scope:
- By Application
- Online Marketing and Marketing Automation
- Mobile Analytics
- Content Marketing
- Social Media Management
- Email Marketing
- Multichannel Campaign Analysis
- Personalization and A/B Testing
- Customer Journey Mapping and Other Applications
- By Offering
- Solutions
- Services
- By Deployment Model
- Cloud-Based
- On-Premises
- By Organization Size
- Large Enterprises
- Small and Medium Enterprises
- By End-User Vertical
- Retail and E-commerce
- Manufacturing
- Information Technology and Telecom
- Banking Financial Services and Insurance
- Healthcare and Life Sciences
- Transportation and Logistics
- Media and Entertainment and Other End-User Verticals
- By Geography
- North America
- United States
- Canada
- Mexico
- South America
- Brazil
- Argentina
- Rest of South America
- Europe
- Germany
- United Kingdom
- France
- Italy
- Spain
- Rest of Europe
- Asia Pacific
- China
- Japan
- India
- South Korea
- Australia and New Zealand
- Rest of Asia Pacific
- Middle East
- United Arab Emirates
- Saudi Arabia
- Turkey
- Rest of Middle East
- Africa
- South Africa
- Egypt
- Nigeria
- Rest of Africa
- North America
Geography Analysis
North America generated 37.75% of 2025 revenue, supported by mature ad ecosystems, high cloud adoption, and a deep bench of analytics talent. Enterprises exploit integrated suites that synchronize analytics with CRM, commerce, and workflow tools. Compliance investment remains high as enforcement around California's CPRA intensifies, prompting upgrades to consent governance modules.
Europe experiences mid-teen growth as GDPR scrutiny pushes organizations toward first-party data strategies. Server-side tagging gains traction, and analytics spending shifts from marketing to privacy and IT budgets. Countries such as Germany and France favor domestic data centers, steering demand to vendors that offer local hosting options sanctioned for cross-border transfers. The web analytics market size for EU-hosted deployments is set to rise steadily through 2030.
Asia Pacific is the fastest-growing territory, clocking a 15.70% CAGR. Mobile-first economies in Southeast Asia and India spur adoption of lightweight SDKs that capture app events despite bandwidth constraints. Social commerce integration fuels path-to-purchase analysis, and regional super-app ecosystems require analytics engines capable of handling embedded payments, ride-sharing, and messaging in one funnel. Government digital-nation initiatives across Indonesia and Thailand further uplift adoption among public-sector portals.
The Middle East and Africa sees emerging momentum as broadband penetration widens. Investments cluster in Gulf Cooperation Council states, where financial services and travel operators modernize engagement tracking. South America posts steady gains, led by Brazil's e-commerce boom and Argentina's fintech expansion, fostering demand for cost-effective cloud analytics that circumvent legacy infrastructure.
- Google LLC
- Adobe Inc.
- Microsoft Corporation
- Meta Platforms Inc.
- Webtrends Inc.
- Yahoo Inc.
- comScore Inc.
- Splunk Inc.
- MicroStrategy Incorporated
- Tableau Software LLC
- SAS Institute Inc.
- Teradata Corporation
- Applied Technologies Internet SA
- Hootsuite Inc.
- SimilarWeb Ltd.
- Mixpanel Inc.
- InnoCraft Ltd. (Matomo)
- Contentsquare SAS
- Hotjar Ltd.
- Piwik PRO SA
Additional Benefits:
- The market estimate (ME) sheet in Excel format
- 3 months of analyst support
TABLE OF CONTENTS
1 INTRODUCTION
- 1.1 Study Assumptions and Market Definition
- 1.2 Scope of the Study
2 RESEARCH METHODOLOGY
3 EXECUTIVE SUMMARY
4 MARKET LANDSCAPE
- 4.1 Market Overview
- 4.2 Market Drivers
- 4.2.1 Explosion of E-commerce Transaction Volumes
- 4.2.2 Rapid Adoption of Mobile and App-Based Analytics
- 4.2.3 Shift Toward Data-Driven Marketing Automation
- 4.2.4 Rising Investment in Customer Experience Optimization
- 4.2.5 Emergence of Server-Side Tagging to Preserve First-Party Data
- 4.2.6 Integration of Privacy-Preserving Differential Privacy Techniques
- 4.3 Market Restraints
- 4.3.1 Stringent Data Protection and Privacy Regulations
- 4.3.2 Cookie Deprecation Reducing Third-Party Tracking Capabilities
- 4.3.3 Growing Popularity of Walled-Garden Ecosystems Limiting Cross-Domain Tracking
- 4.3.4 Shortage of Skilled Digital Analytics Professionals
- 4.4 Industry Ecosystem Analysis
- 4.5 Regulatory Landscape
- 4.6 Technological Outlook
- 4.7 Porter's Five Forces Analysis
- 4.7.1 Bargaining Power of Buyers
- 4.7.2 Bargaining Power of Suppliers
- 4.7.3 Threat of New Entrants
- 4.7.4 Threat of Substitute Products
- 4.7.5 Intensity of Competitive Rivalry
- 4.8 Impact of Macroeconomic Factors
5 MARKET SIZE AND GROWTH FORECASTS (VALUE)
- 5.1 By Application
- 5.1.1 Online Marketing and Marketing Automation
- 5.1.2 Mobile Analytics
- 5.1.3 Content Marketing
- 5.1.4 Social Media Management
- 5.1.5 Email Marketing
- 5.1.6 Multichannel Campaign Analysis
- 5.1.7 Personalization and A/B Testing
- 5.1.8 Customer Journey Mapping and Other Applications
- 5.2 By Offering
- 5.2.1 Solutions
- 5.2.2 Services
- 5.3 By Deployment Model
- 5.3.1 Cloud-Based
- 5.3.2 On-Premises
- 5.4 By Organization Size
- 5.4.1 Large Enterprises
- 5.4.2 Small and Medium Enterprises
- 5.5 By End-User Vertical
- 5.5.1 Retail and E-commerce
- 5.5.2 Manufacturing
- 5.5.3 Information Technology and Telecom
- 5.5.4 Banking Financial Services and Insurance
- 5.5.5 Healthcare and Life Sciences
- 5.5.6 Transportation and Logistics
- 5.5.7 Media and Entertainment and Other End-User Verticals
- 5.6 By Geography
- 5.6.1 North America
- 5.6.1.1 United States
- 5.6.1.2 Canada
- 5.6.1.3 Mexico
- 5.6.2 South America
- 5.6.2.1 Brazil
- 5.6.2.2 Argentina
- 5.6.2.3 Rest of South America
- 5.6.3 Europe
- 5.6.3.1 Germany
- 5.6.3.2 United Kingdom
- 5.6.3.3 France
- 5.6.3.4 Italy
- 5.6.3.5 Spain
- 5.6.3.6 Rest of Europe
- 5.6.4 Asia Pacific
- 5.6.4.1 China
- 5.6.4.2 Japan
- 5.6.4.3 India
- 5.6.4.4 South Korea
- 5.6.4.5 Australia and New Zealand
- 5.6.4.6 Rest of Asia Pacific
- 5.6.5 Middle East
- 5.6.5.1 United Arab Emirates
- 5.6.5.2 Saudi Arabia
- 5.6.5.3 Turkey
- 5.6.5.4 Rest of Middle East
- 5.6.6 Africa
- 5.6.6.1 South Africa
- 5.6.6.2 Egypt
- 5.6.6.3 Nigeria
- 5.6.6.4 Rest of Africa
- 5.6.1 North America
6 COMPETITIVE LANDSCAPE
- 6.1 Market Concentration
- 6.2 Strategic Moves
- 6.3 Market Share Analysis
- 6.4 Company Profiles (includes Global level Overview, Market level overview, Core Segments, Financials as available, Strategic Information, Market Rank/Share for key companies, Products and Services, and Recent Developments)
- 6.4.1 Google LLC
- 6.4.2 Adobe Inc.
- 6.4.3 Microsoft Corporation
- 6.4.4 Meta Platforms Inc.
- 6.4.5 Webtrends Inc.
- 6.4.6 Yahoo Inc.
- 6.4.7 comScore Inc.
- 6.4.8 Splunk Inc.
- 6.4.9 MicroStrategy Incorporated
- 6.4.10 Tableau Software LLC
- 6.4.11 SAS Institute Inc.
- 6.4.12 Teradata Corporation
- 6.4.13 Applied Technologies Internet SA
- 6.4.14 Hootsuite Inc.
- 6.4.15 SimilarWeb Ltd.
- 6.4.16 Mixpanel Inc.
- 6.4.17 InnoCraft Ltd. (Matomo)
- 6.4.18 Contentsquare SAS
- 6.4.19 Hotjar Ltd.
- 6.4.20 Piwik PRO SA
7 MARKET OPPORTUNITIES AND FUTURE OUTLOOK
- 7.1 White-Space and Unmet-Need Assessment