|
시장보고서
상품코드
2073491
요로상피암 치료제 : 시장 점유율 분석, 업계 동향 및 통계, 성장 예측(2026-2031년)Urothelial Cancer Drugs - Market Share Analysis, Industry Trends & Statistics, Growth Forecasts (2026 - 2031) |
||||||
 Mordor Intelligence
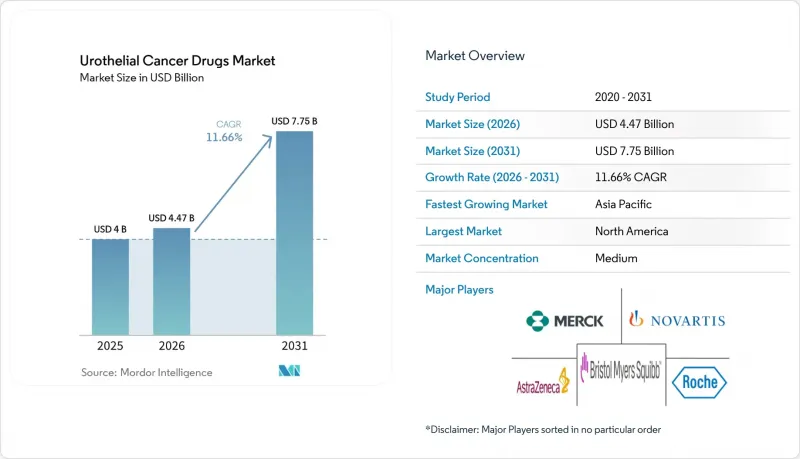
Mordor Intelligence에 의하면, 2026년 요로상피암 치료제 시장 규모는 44억 7,000만 달러에 달할 것으로 예상되고, 2025년 40억 달러에서 확대해, 2031년에는 77억 5,000만 달러에 이를 것으로 예측됩니다.
2026년부터 2031년까지의 연평균 성장률(CAGR)은 11.66%를 나타낼 것으로 전망됩니다.
본 보고서는 치료 분류(화학요법, 면역요법 등), 치료 단계(1차 치료, 2차 치료 등), 암 병기(전이성 요로상피암 등), 바이오마커 상태(FGFR2/3 돌연변이 등), 유통 채널(병원 약국 등), 지역(북미, 유럽 등)별로 분류되어 있습니다. 시장 전망은 금액(달러) 기준으로 제시되어 있습니다.
세계의 요로상피암 치료제 시장 동향 및 분석
전 세계적으로 증가하는 요로상피암 환자 수
세계 방광암 진단 건수는 계속 증가하고 있으며, 고소득 국가에서는 악성 종양 중 6위를 차지하고 있고, 신흥 경제국에서는 그 증가 속도가 가속화되고 있습니다. 환경 발암 물질, 고령화, 그리고 방광경 검사를 통한 선별 검사의 접근성 확대에 따라, 새로운 치료제의 대상 환자층이 확대되고 있습니다. 아시아태평양의 젊은 환자들 사이에서는 장기간의 병용 요법이 필요한 침습성이 높은 질환 표현형이 점점 더 많이 나타나고 있습니다. 상부 요로 상피암이 독립된 임상적 실체로 인식되게 됨에 따라, 개별화된 접근이 필요한 새로운 치료 분야가 등장하고 있습니다. 요로 종양 전문센터에 대한 의료 시스템 투자로 인해 진단부터 치료까지의 기간이 단축되면서 시장 전체 수요가 확대되고 있습니다. 그 결과, 적격 환자 수가 지속적으로 증가하고 있으며, 이해관계자들의 수익 잠재력이 직접적으로 확대되고 있습니다.
1차 치료의 표준으로서 면역관문억제제의 보급
펨브롤리주맙 및 듀르발맙과 같은 면역관문억제제는 2024년에 여러 병기에서 광범위한 1차 치료제로 승인을 획득하여, 적격 환자군에서 시스플라틴 기반 화학요법을 대체했습니다. 듀르발마브의 NIAGARA 임상시험에서는 전체 생존 기간의 연장이 확인되어, 치료 지침의 개정과 보험사의 승인을 촉진했습니다. 병용 요법, 특히 엔포르탐브 베도친과 펨브롤리주맙의 병용은 모범 사례를 재정의하고 수익원을 확대되고 있습니다. PD-L1 발현 및 종양 돌연변이 부하(TMB)를 활용한 진화하는 바이오마커 알고리즘을 통해 환자 선별이 정교해졌으며, 그 결과 반응률이 향상되고 있습니다. 피하 투여 제제는 투여의 편의성을 높여, 지역 의료 현장에의 보급을 촉진하고 있습니다. 이러한 요인들이 복합적으로 작용하여 요로상피암 치료제 시장의 성장세를 더욱 공고히 하고 있습니다.
면역요법 및 ADC의 높은 비용
선진국에서 병용 요법의 연간 치료비는 환자 1인당 20만 달러를 초과하여, 지급 기관의 예산을 압박하고 있으며, 엄격한 사전 승인 절차가 요구되고 있습니다. 고도로 전문화된 정맥 주사 투여 인프라와 집중적인 모니터링이 간접 비용을 증가시키는 반면, 보험 적용 범위의 제한으로 인해 신흥 지역에서의 보급이 제약을 받고 있습니다. 의약품 지원 프로그램은 선택적인 부담 경감을 가져오지만, 광범위한 접근성을 실현하기에는 여전히 불충분합니다. 가치 기반 계약이 점차 확산되면서, 실제 치료 성과를 보험 급여의 조건으로 삼아 제약 기업에 약제경제학적 이점을 입증하도록 요구하고 있습니다. 바이오시밀러와의 경쟁으로 인해 초기 체크포인트 억제제의 가격은 억제될 가능성이 있지만, ADC의 제조 과정이 복잡하기 때문에 단기적으로는 제네릭 의약품 시장 진입이 제한될 것이며, 합리적인 가격을 유지해야 하는 압박은 지속될 것으로 보입니다.
부문별 분석
ADC는 매출 성장률이 가장 빠르며, 미치료 전이성 질환에서 엔포르탐브 베도틴의 EV-302 임상시험 데이터가 생존율 기준을 새롭게 정립함에 따라, 2026년부터 2031년까지 연평균 성장률(CAGR) 18.21%를 나타낼 것으로 전망됩니다. 2025년에는 면역요법이 요로상피암 치료제 시장의 45.02%를 차지하며 시장을 주도했습니다. 이는 PD-1 및 PD-L1 억제제의 사용 확대에 기인한 것이지만, 단독 요법의 반응률이 정체 상태에 이르렀기 때문에 시너지 효과를 통해 종양을 사멸시키는 것을 목표로 하는 ADC 페이로드를 통합한 병용 요법에 대한 관심이 계속해서 높아지고 있습니다. 시스플라틴 적응증 환자에게는 여전히 백금 제제 기반 화학요법이 중요한 위치를 차지하고 있지만, BCG 공급 부족이 지속되는 가운데 유전자 치료와 화학온열요법이 방광 내 치료 분야의 공백을 메우고 있습니다.
파이프라인의 폭이 넓기 때문에 ADC의 성장세가 지속적으로 뒷받침되고 있습니다. 차세대 공액체에서는 새로운 항원, 최적화된 링커, 그리고 약물-항체 비율의 향상이 추구되고 있습니다. 이러한 혁신과 전 세계 규제 당국의 지원이 맞물리면서, ADC를 활용한 요로상피암 치료제 시장 규모는 기존 시장 규모를 훨씬 뛰어넘을 것으로 예측됩니다. 치료법이 점점 더 복잡해지고, 이것이 일상화됨에 따라 약국과 보험사는 재고 관리, 보험금 지급 및 투여 프로토콜을 이에 맞추어 조정해 나가야 합니다.
2025년 매출의 56.01%를 1차 치료 요법이 차지해, 초기 치료 선택이 경제적으로 매우 중요하다는 점을 여실히 보여주었습니다. 아벨마브가 주도하는 유지 요법은 연평균 성장률(CAGR) 12.66%를 기록하며 성장세를 이어가고 있으며, 이러한 지속성이 주는 이점은 무재발 기간의 가치를 중시하는 임상의와 보험사 양측 모두로부터 지지를 받고 있습니다.
2차 치료 단계는 내성이 나타나는 중요한 국면이며, ADC나 표적 억제제가 기존의 화학요법에 비해 우월성을 보여주는 분야입니다. 3차 치료 및 구제 치료 분야는 치료 규모는 작지만, 온콜로이틱 바이러스와 같은 혁신적인 치료법이 도입되면서 시장 점유율 확대가 예상됩니다. 각 치료 단계에서 약물을 전략적으로 순서대로 투여하는 것은 진화하는 실세계 데이터를 바탕으로 한 '예술' 점차 그러한 양상을 띠고 있어, 요로상피암 치료제 시장에서 보다 장기적인 시장 지배 기간을 가져올 것으로 기대됩니다.
지역별 분석
북미는 견실한 보험 환급, 탄탄한 임상시험 인프라, 그리고 획기적인 치료법으로의 조기 지정을 통해 2025년 전 세계 매출의 42.88%를 계속 차지했습니다. 미국 시장 동향은 메디케어 정책의 개편과 민간 보험사와의 협력과 밀접한 관련이 있으며, 현재 양측 모두 입증된 생존 기간 연장에 대해 보상을 제공하는 가치 기반 계약을 채택하고 있습니다. 캐나다 주 정부의 자금 지원 제도에서는 일괄 조달을 통한 가격 협상이 이루어지고 있으며, 협상된 가격을 바탕으로 예측 가능한 도입이 진행되고 있습니다. 멕시코와의 국경을 넘어 이루어지는 치료 과정은 특히 국경 인근 주에서 종양 센터가 전문적인 정맥 주사 투여 역량을 제공하고 있기 때문에 환자들의 치료 접근성을 보완하고 있습니다.
유럽은 성숙해 가면서도 체계적인 환경을 갖추고 있으며, 유럽의약품청(EMA)이 승인을 조정하고, 각국의 의료기술평가(HTA) 기관이 접근 권한을 결정하고 있습니다. 독일의 DRG(진단 관련 그룹)에 기반한 지급 개혁, 영국의 ‘암 치료제 기금’,프랑스의 ATU(임시 승인)에 따른 조기 접근 제도가 더해지면서, 경쟁력이 있는 의약품 시장 진입이 가속화되고 있지만, 정가 협상은 난항을 겪고 있습니다. 남유럽은 재정적 제약에 직면해 있어 도입이 지연되고 있지만, 수요가 사라진 것은 아닙니다. 관리형 시장 진입 계약 및 성과 연동형 리베이트를 통해 예산에 여유가 점차 생기고 있습니다. 새로운 의약품 전략에 기반한 공동 임상 평가에 대한 EU 전역의 협력을 통해, 증거 요건의 합리화가 기대되며, 이는 요로상피암 치료제 시장에 긍정적인 영향을 미칠 것입니다.
아시아태평양은 연평균 성장률(CAGR) 12.11%를 기록하며, 각국의 암 대책 계획, 보험 확대, 진단 체계 구축을 원동력으로 삼아 가장 활기찬 신흥 시장으로 부상하고 있습니다. 중국에서는 혁신을 저해하지 않으면서 가격을 억제하기 위해 수량 기준의 조달이 이루어지고 있는 반면, 일본에서는 암 치료 분야의 획기적인 발전에 대응하여 HTA(의료기술평가) 절차가 가속화되고 있습니다. 인도의 단계적 민관 협력 시스템에서는 환자 지원 파트너십을 통해 경구용 표적 치료제의 도입이 추진되고 있습니다. 호주와 한국은 체계적인 레지스트리와 실세계 데이터를 활용하여 고부가가치 의약품의 보험 적용을 신속하게 추진하고 있습니다. 그렇긴 하지만, 도시와 지방 간의 격차, 바이오마커 검사의 제한, 전문의의 불균형한 분포는 지역 전체에 걸쳐 균일하게 보급되기 위한 여전히 큰 과제로 남아 있습니다.
기타 혜택 :
- 엑셀 형식 시장 예측(ME) 시트
- 3개월간의 애널리스트 지원
자주 묻는 질문
목차
제1장 서론
제2장 조사 방법
제3장 주요 요약
제4장 시장 구도
제5장 시장 규모 및 성장 예측
제6장 경쟁 구도
제7장 시장 기회 및 향후 전망
KTH 26.07.07According to Mordor Intelligence, urothelial cancer drugs market size in 2026 is estimated at USD 4.47 billion, growing from 2025 value of USD 4.00 billion with 2031 projections showing USD 7.75 billion, growing at 11.66% CAGR over 2026-2031.
This report is Segmented by Treatment Class (Chemotherapy, Immunotherapy, and More), Line of Therapy (First-Line, Second-Line, and More), Cancer Stage (Metastatic Urothelial Carcinoma, and More), Biomarker Status (FGFR2/3 Altered, and More), Distribution Channel (Hospital Pharmacies, and More), and Geography (North America, Europe, and More). The Market Forecasts are Provided in Terms of Value (USD).
Global Urothelial Cancer Drugs Market Trends and Insights
Rising Incidence Of Urothelial Cancer Cases Globally
Global bladder cancer diagnoses continue to climb, ranking among the top six malignancies in high-income nations and accelerating in emerging economies. Environmental carcinogens, aging demographics, and wider access to cystoscopic screening enlarge the addressable pool of candidates for novel therapeutics. Younger patient cohorts in Asia-Pacific increasingly present with aggressive disease phenotypes that demand prolonged, combination treatment regimens. Recognition of upper-tract urothelial carcinomas as a distinct clinical entity is spawning new therapeutic segments requiring tailored approaches. Health-system investment in dedicated uro-oncology centers streamlines diagnosis-to-treatment intervals and enlarges total market demand. The net effect is a durable rise in eligible patients, directly expanding revenue potential for stakeholders.
Uptake Of Immune-Checkpoint Inhibitors As First-Line Standard
Checkpoint inhibitors such as pembrolizumab and durvalumab secured broad first-line approvals across multiple disease stages in 2024, displacing cisplatin-based chemotherapy for eligible populations. Durvalumab's NIAGARA study confirmed overall survival gains, catalyzing guideline revisions and payer acceptance. Combination protocols-most prominently enfortumab vedotin plus pembrolizumab-are redefining best practice and intensifying revenue streams. Evolving biomarker algorithms exploiting PD-L1 expression and tumor mutational burden refine patient selection, thus elevating response rates. Subcutaneous formulations offer logistical convenience, supporting diffusion into community settings. Collectively these factors fortify the urothelial cancer drugs market's trajectory.
High Cost Of Immunotherapies & ADCs
Annual treatment outlays for combination regimens exceed USD 200,000 per patient in developed economies, straining payer budgets and imposing strict prior-authorization hurdles. Highly specialized infusion infrastructure and intensive monitoring inflate indirect costs, while limited insurance coverage constrains uptake in emerging regions. Pharmaceutical assistance programs generate selective relief yet remain insufficient for widespread access. Value-based contracts are gaining traction, conditioning reimbursement on real-world outcomes and compelling manufacturers to document pharmacoeconomic merit. Biosimilar competition may temper pricing for early checkpoint inhibitors, but complex ADC manufacturing dampens near-term generic entry, sustaining affordability pressures.
Other drivers and restraints analyzed in the detailed report include:
- Regulatory Fast-Tracking Of Antibody-Drug Conjugates (ADCs)
- Large Pharma Partnering Boosts Launch Velocity Of FGFR Inhibitors
- Immune-Related Adverse Events Curbing Long-Term Adherence
For complete list of drivers and restraints, kindly check the Table Of Contents.
Segment Analysis
ADCs produced the fastest revenue climb, forecasting an 18.21% CAGR between 2026 and 2031 as enfortumab vedotin's EV-302 data reset survival benchmarks in untreated metastatic disease. Immunotherapy dominated 2025 with a 45.02% slice of the urothelial cancer drugs market, led by the growing adoption of PD-1 And PD-L1 Inhibitors, although plateauing single-agent response rates continue to motivate combination approaches integrating ADC payloads for synergistic tumor kill. Platinum-based chemotherapy retains relevance for cisplatin-eligible patients, whereas gene therapy and chemohyperthermia fill intravesical niches amid persistent BCG scarcity.
Pipeline breadth ensures continued ADC momentum: next-wave conjugates seek novel antigens, optimized linkers, and enhanced drug-antibody ratios. These innovations, coupled with global regulatory support, are expected to lift the urothelial cancer drugs market size for ADCs well beyond historical norms. Pharmacies and payers will need to adapt inventory, reimbursement, and administration protocols as increasingly complex regimens become routine.
First-line regimens generated 56.01% of 2025 revenues, underscoring the economic significance of initial therapeutic choice. Maintenance therapy, paced by avelumab, owns momentum through a 12.66% CAGR outlook; its durability benefits resonate with both clinicians and payers seeking progression-free value.
Second-line spaces remain pivotal arenas where resistance emerges, inviting ADCs and targeted inhibitors to demonstrate superiority over traditional chemotherapies. Third-line and salvage settings, although smaller in volume, attract disruptive modalities such as oncolytic viruses that could unlock incremental share. The strategic sequencing of agents across lines is becoming an art informed by evolving real-world data, promising longer control horizons for the urothelial cancer drugs market.
Complete Report Scope:
- By Treatment Class
- Chemotherapy
- Platinum-based
- Non-platinum
- Immunotherapy
- PD-1 / PD-L1 Inhibitors
- CTLA-4 Inhibitors
- Oncolytic Viruses & Vaccines
- Targeted Therapy
- FGFR Inhibitors
- HER2 / Nectin-4 ADCs
- Antibody-Drug Conjugates
- Enfortumab Vedotin
- Sacituzumab Govitecan
- Pipeline ADCs
- Intravesical Therapy
- BCG
- Gene/Viral Therapy
- Chemohyperthermia
- Chemotherapy
- By Line of Therapy
- First-line
- Maintenance / Consolidation
- Second-line
- Third-line & Beyond
- By Cancer Stage
- Non-Muscle Invasive Bladder Cancer (NMIBC)
- Muscle Invasive Bladder Cancer (MIBC)
- Metastatic Urothelial Carcinoma (mUC)
- By Biomarker Status
- FGFR2/3 Altered
- PD-L1 High Expression
- Nectin-4 High Expression
- HER2 Positive
- Biomarker Unselected
- By Distribution Channel
- Hospital Pharmacies
- Specialty Clinics
- Online Pharmacies
- Geography
- North America
- United States
- Canada
- Mexico
- Europe
- Germany
- United Kingdom
- France
- Italy
- Spain
- Rest of Europe
- Asia-Pacific
- China
- Japan
- India
- South Korea
- Australia
- Rest of Asia-Pacific
- Middle East and Africa
- GCC
- South Africa
- Rest of Middle East and Africa
- South America
- Brazil
- Argentina
- Rest of South America
- North America
Geography Analysis
North America maintained 42.88% of 2025 global revenue due to robust reimbursement, dense clinical-trial infrastructure, and early adoption of breakthrough designations. U.S. market evolution is closely tied to Medicare policy updates and private payer alignment, both of which now embrace value-based contracts that reward demonstrable survival gains. Canada's provincially funded systems negotiate collective procurement, fostering predictable uptake albeit at negotiated pricing. Cross-border treatment flows with Mexico supplement patient access, particularly in border states where oncology centers provide specialized infusion capability.
Europe presents a mature but methodical environment in which the European Medicines Agency coordinates approvals and national health-technology assessments (HTAs) adjudicate access. Germany's DRG payment reforms, the U.K.'s Cancer Drugs Fund, and France's ATU early-access scheme collectively accelerate entry for compelling agents, though list-price negotiations are stringent. Southern Europe faces fiscal constraints, delaying adoption but not eliminating demand; managed-entry agreements and outcomes-based rebates increasingly unlock budgetary headroom. Pan-EU collaboration on joint clinical assessment under the new Pharmaceutical Strategy promises to streamline evidence requirements, benefiting the urothelial cancer drugs market.
Asia-Pacific, registering a 12.11% CAGR, emerges as the most vibrant frontier, powered by national cancer control plans, insurance expansion, and improving diagnostic reach. China's volume-based procurement aims to tame prices without impeding innovation, while Japan's HTA process accelerates for oncology breakthroughs. India's tiered private-public system is embracing oral targeted agents through patient-assistance partnerships. Australia and South Korea leverage robust registries and real-world data to fast-track reimbursement for high-value medicines. Nonetheless, rural-urban disparities, limited biomarker testing, and uneven specialist density remain headwinds to uniform uptake across the region.
- Merck
- Roche
- Bristol-Myers Squibb
- AstraZeneca
- Novartis
- GlaxoSmithKline
- Sanofi
- Eisai
- Astellas Pharma
- UroGen Pharma Ltd.
- Pfizer
- Seagen
- Johnson & Johnson (Janssen Biotech)
- Gilead Sciences
- ImmunityBio Inc.
- CG Oncology
- QED Therapeutics Inc.
- BeiGene Ltd.
- Mirati Therapeutics Inc.
Additional Benefits:
- The market estimate (ME) sheet in Excel format
- 3 months of analyst support
TABLE OF CONTENTS
1 Introduction
- 1.1 Study Assumptions & Market Definition
- 1.2 Scope of the Study
2 Research Methodology
3 Executive Summary
4 Market Landscape
- 4.1 Market Overview
- 4.2 Market Drivers
- 4.2.1 Rising Incidence Of Urothelial Cancer Cases Globally
- 4.2.2 Uptake Of Immune-Checkpoint Inhibitors As First-Line Standard
- 4.2.3 Regulatory Fast-Tracking Of Antibody-Drug Conjugates (ADCs)
- 4.2.4 Large Pharma Partnering Boosts Launch Velocity Of FGFR Inhibitors
- 4.2.5 AI-Based Urine Biomarker Diagnostics Expanding Treatable Pool
- 4.2.6 Medicare & Private-Payer Reimbursement Expansions For ADC + IO Combos
- 4.3 Market Restraints
- 4.3.1 High Cost Of Immunotherapies & ADCs
- 4.3.2 Immune-Related Adverse Events Curbing Long-Term Adherence
- 4.3.3 Global BCG Manufacturing Shortages Prolonging NMIBC Regimens
- 4.3.4 Limited Access To Companion-Diagnostic Testing In Emerging Markets
- 4.4 Porter's Five Forces
- 4.4.1 Bargaining Power of Buyers/Consumers
- 4.4.2 Bargaining Power of Suppliers
- 4.4.3 Threat of New Entrants
- 4.4.4 Threat of Substitute Products
- 4.4.5 Intensity of Competitive Rivalry
5 Market Size & Growth Forecasts (Value, USD)
- 5.1 By Treatment Class
- 5.1.1 Chemotherapy
- 5.1.1.1 Platinum-based
- 5.1.1.2 Non-platinum
- 5.1.2 Immunotherapy
- 5.1.2.1 PD-1 / PD-L1 Inhibitors
- 5.1.2.2 CTLA-4 Inhibitors
- 5.1.2.3 Oncolytic Viruses & Vaccines
- 5.1.3 Targeted Therapy
- 5.1.3.1 FGFR Inhibitors
- 5.1.3.2 HER2 / Nectin-4 ADCs
- 5.1.4 Antibody-Drug Conjugates
- 5.1.4.1 Enfortumab Vedotin
- 5.1.4.2 Sacituzumab Govitecan
- 5.1.4.3 Pipeline ADCs
- 5.1.5 Intravesical Therapy
- 5.1.5.1 BCG
- 5.1.5.2 Gene/Viral Therapy
- 5.1.5.3 Chemohyperthermia
- 5.1.1 Chemotherapy
- 5.2 By Line of Therapy
- 5.2.1 First-line
- 5.2.2 Maintenance / Consolidation
- 5.2.3 Second-line
- 5.2.4 Third-line & Beyond
- 5.3 By Cancer Stage
- 5.3.1 Non-Muscle Invasive Bladder Cancer (NMIBC)
- 5.3.2 Muscle Invasive Bladder Cancer (MIBC)
- 5.3.3 Metastatic Urothelial Carcinoma (mUC)
- 5.4 By Biomarker Status
- 5.4.1 FGFR2/3 Altered
- 5.4.2 PD-L1 High Expression
- 5.4.3 Nectin-4 High Expression
- 5.4.4 HER2 Positive
- 5.4.5 Biomarker Unselected
- 5.5 By Distribution Channel
- 5.5.1 Hospital Pharmacies
- 5.5.2 Specialty Clinics
- 5.5.3 Online Pharmacies
- 5.6 Geography
- 5.6.1 North America
- 5.6.1.1 United States
- 5.6.1.2 Canada
- 5.6.1.3 Mexico
- 5.6.2 Europe
- 5.6.2.1 Germany
- 5.6.2.2 United Kingdom
- 5.6.2.3 France
- 5.6.2.4 Italy
- 5.6.2.5 Spain
- 5.6.2.6 Rest of Europe
- 5.6.3 Asia-Pacific
- 5.6.3.1 China
- 5.6.3.2 Japan
- 5.6.3.3 India
- 5.6.3.4 South Korea
- 5.6.3.5 Australia
- 5.6.3.6 Rest of Asia-Pacific
- 5.6.4 Middle East and Africa
- 5.6.4.1 GCC
- 5.6.4.2 South Africa
- 5.6.4.3 Rest of Middle East and Africa
- 5.6.5 South America
- 5.6.5.1 Brazil
- 5.6.5.2 Argentina
- 5.6.5.3 Rest of South America
- 5.6.1 North America
6 Competitive Landscape
- 6.1 Market Concentration
- 6.2 Market Share Analysis
- 6.3 Company Profiles (includes Global level Overview, Market level overview, Core Segments, Financials as available, Strategic Information, Market Rank/Share for key companies, Products & Services, and Recent Developments)
- 6.3.1 Merck & Co., Inc.
- 6.3.2 F. Hoffmann-La Roche AG
- 6.3.3 Bristol-Myers Squibb Company
- 6.3.4 AstraZeneca PLC
- 6.3.5 Novartis AG
- 6.3.6 GSK PLC
- 6.3.7 Sanofi SA
- 6.3.8 Eisai Co., Ltd.
- 6.3.9 Astellas Pharma Inc.
- 6.3.10 UroGen Pharma Ltd.
- 6.3.11 Pfizer Inc.
- 6.3.12 Seagen Inc.
- 6.3.13 Johnson & Johnson (Janssen Biotech)
- 6.3.14 Gilead Sciences Inc.
- 6.3.15 ImmunityBio Inc.
- 6.3.16 CG Oncology Inc.
- 6.3.17 QED Therapeutics Inc.
- 6.3.18 BeiGene Ltd.
- 6.3.19 Mirati Therapeutics Inc.
7 Market Opportunities & Future Outlook
- 7.1 White-space & Unmet-Need Assessment