

|
시장보고서
상품코드
2073517
올 플래시 어레이 : 시장 점유율 분석, 업계 동향 및 통계, 성장 예측(2026-2031년)All Flash Array - Market Share Analysis, Industry Trends & Statistics, Growth Forecasts (2026 - 2031) |
||||||
 Mordor Intelligence
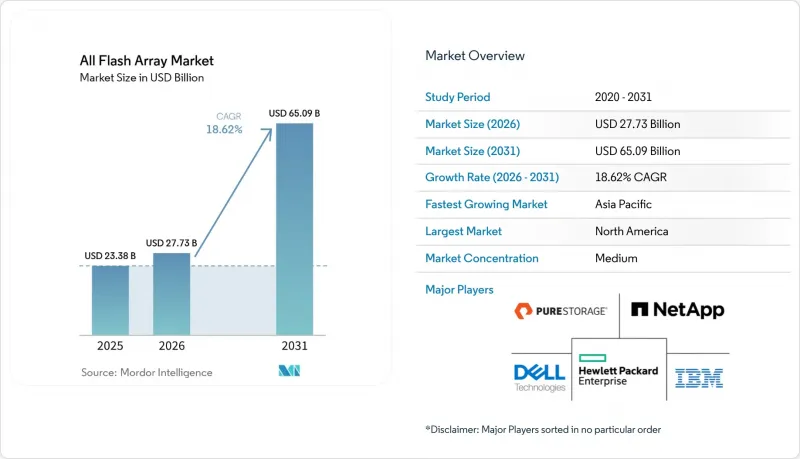
Mordor Intelligence에 의하면, 올 플래시 어레이 시장 규모는 2025년 233억 8,000만 달러로 평가되었습니다. 2026년에는 277억 3,000만 달러로 확대되어 2026년부터 2031년에 걸쳐 CAGR 18.62%로 성장을 지속하여, 2031년에는 650억 9,000만 달러에 이를 것으로 예측됩니다.
본 보고서는 아키텍처(스케일업, 스케일아웃, NVMe-OF 디어그리게이트), 용량(20TB 이하, 20-100TB, 100TB 초과), 인터페이스 프로토콜(SAS/SATA, 파이버 채널, 기타), 최종 사용자 산업(IT 및 통신, 은행, 금융서비스 및 보험(BFSI), 헬스케어 및 생명과학, 기타) 및 지역별로 분류되어 있습니다. 시장 전망은 금액(달러) 기준으로 제시되어 있습니다.
세계의 올 플래시 어레이 시장 동향 및 분석
급증하는 하이퍼스케일 및 엣지 데이터센터 구축
하이퍼스케일 클라우드 사업자들은 AI에 최적화된 캠퍼스를 위해 2025년 자본지출(CAPEX)로 총 1,300억 달러 이상을 배정했으며, 스토리지 비용이 그 지출의 약 5분의 1을 차지했습니다. 새로운 시설에서는 대규모 언어 모델의 매개변수를 처리하는 수천 대의 GPU에 데이터를 공급하기 위해 고밀도이며 지연 시간이 짧은 플래시 계층이 필요합니다. 이와 동시에, 소매점, 휴대전화 기지국, 제조 현장의 엣지 환경에서는 진동과 온도 변동에 견디면서도 일관된 처리량을 실현하는 소형 플래시 시스템이 선호되고 있습니다. 각 벤더사는 2노드 엣지 어플라이언스부터 코어 데이터센터 내의 랙 스케일 NVMe-oF 패브릭까지 확장 가능한 통합된 컨트롤러 코드를 통해 이에 대응하고 있습니다. 주요 도시권의 전력 공급 제한으로 인해, 와트당 IOPS가 높은 플래시 저장 장치로의 전환이 더욱 가속화되고 있습니다. 그 결과, 올 플래시 어레이 시장은 중앙 집중형 클라우드와 분산형 엣지 노드 전반에 걸친 수요의 연동으로 인해 혜택을 보고 있습니다.
성능이 매우 중요한 AI 및 실시간 분석 워크로드
AI 모델 훈련은 순차 쓰기로 인해 스토리지 링크를 포화시키지만, 반면 추론 워크로드는 마이크로초 단위의 무작위 읽기에 의존합니다. 이러한 두 가지 워크로드 프로파일로 인해 하이브리드 어레이의 지연 시간 및 큐 깊이 한계가 드러나면서, AI 기반 스토리지 도입이 가속화되는 한편, 은행, 보험사, 전자상거래 플랫폼이 올플래시 시스템으로 전환하는 움직임이 가속화되고 있습니다. 알고리즘 트레이딩 엔진을 도입한 금융기관들은 STAC 벤치마크를 통해 검증된 올플래시 플랫폼으로 틱 데이터 스토어를 이전한 후, 구체적인 수익 증가를 보고하고 있습니다. 병원에서는 플래시 기반 PACS 아카이브를 활용하여 AI 진단 엔진이 MRI 및 CT 스캔을 지연 없이 분석할 수 있도록 함으로써, 진단까지 걸리는 시간을 단축하고 있습니다. 제조업 분야에서는 센서의 원격 측정 데이터를 실시간으로 수집하는 엣지 호스트형 GPU에서 예측 유지보수 모델을 실행하고 있지만, 스토리지가 중단되면 이 워크플로가 작동하지 않게 됩니다. 검색 증강 생성(RAG), 그래프 쿼리, 스트리밍 분석의 융합을 통해 올 플래시 어레이 시장은 차세대 데이터 파이프라인의 기반으로서 입지를 확고히 하고 있습니다.
하이브리드 어레이와 비교했을 때 초기 설비 투자(CAPEX)가 상대적으로 비싸다는 느낌
SSD 가격이 하락하고 있음에도 불구하고, 엔트리급 올플래시 노드의 가격은 동등한 사용 가능 용량을 가진 하이브리드형 제품에 비해 여전히 40%에서 60% 더 비쌉니다. 가격에 민감한 업계의 CFO들은 5년간의 총소유비용(TCO)보다 초기 구매 비용을 우선시하는 경우가 많아, 플래시 전환 프로젝트를 미루고 있습니다. 라틴아메리카와 동남아시아의 일부 중소기업은 워크로드를 완전히 이전하는 대신 캐시를 업그레이드함으로써 디스크 기반 어레이의 수명을 연장하고 있습니다. 인플레이션 주기에 따른 경제의 불확실성으로 인해 조달 승인 절차가 장기화되고 있으며, 이로 인해 단기적인 올 플래시 어레이 시장으로의 전환이 더욱 억제되고 있습니다.
부문별 분석
스케일업형 어레이는 2025년 매출의 47.12%를 차지했으며, 올 플래시 어레이 시장에서 여전히 가장 큰 기여 요인으로 자리 잡고 있습니다. 익숙한 듀얼 컨트롤러 구성은 기존의 SAN 오케스트레이션과 통합할 수 있기 때문에 그 꾸준한 인기를 설명해 줍니다. 그러나 이 아키텍처에서는 고밀도화가 진행되고 있는 NVMe 드라이브를 충분히 활용하기 어려워, 성능을 중시하는 구매자들이 스케일아웃 방식이나 완전히 분산된 NVMe-oF 설계로 눈을 돌리고 있습니다. 각 벤더사는 스테이트리스 컴퓨팅 셸프나 캐시 계층을 추가함으로써 위험을 완화하고 있지만, 이러한 사후 개선만으로는 컨트롤러에 내재된 근본적인 제약을 해소할 수는 없습니다.
반면, NVMe-oF 디스어그리게이트 클러스터는 2031년까지 연평균 성장률(CAGR) 19.45%를 나타낼 것으로 예측되며, 이는 올 플래시 어레이 시장 내에서 가장 높은 성장률입니다. 디스어그리게이션을 통해 스토리지 로직을 선형적으로 확장하는 이더넷 연결 노드로 전환함으로써, 단일 섀시의 병목 현상이 해소됩니다. Pure Storage와 몇몇 소프트웨어 정의 신생 기업들은 이 모델을 기반으로 구축된 페타바이트 규모의 GPU 팜을 선보이며, AI 모델 체크포인트 처리 중에도 라인 레이트에 필적하는 처리량이 지속적으로 유지되었다고 강조하고 있습니다. 도입의 성패는 여전히 데이터센터 팀이 RDMA, 혼잡 제어, 그리고 고속 이더넷을 가로지르는 멀티패싱을 습득할 수 있느냐에 달려 있으며, 이러한 기술 격차가 단기적인 확장을 저해하는 요인이 되고 있습니다.
20-100 TB 대역은 2025년 도입 건수의 49.25%를 차지했으며, 데이터베이스 통합 및 VM의 무분별한 증가를 해소하는 데 가장 적합한 범위입니다. 이 범위는 가격, 랙당 전력 소비량, 재구축 주기가 균형을 이루고 있어, 중견 기업의 장비 교체 주기에서 기본 선택지로 자리 잡고 있습니다. QLC 플래시와 강력한 인라인 압축 기술을 결합함으로써, 운영 담당자에게 특수한 섀시 설계를 요구하지 않으면서도 기존 하이브리드 시스템을 훨씬 능가하는 유효 용량을 실현합니다.
100TB를 초과하는 시스템은 2031년까지 연평균 성장률(CAGR) 19.61%를 나타낼 것으로 예측되며, 이는 올 플래시 어레이 시장 전체의 성장률을 상회하는 수치입니다. 하이퍼스케일러는 국소성을 통해 동서 방향의 트래픽 비용을 절감할 수 있는 GPU 클러스터에 데이터를 공급하기 위해 이러한 고밀도 셸프를 선호하여 채택하고 있습니다. 금융 거래 허브 역시 고밀도 구성을 채택하는 경향이 있으며, 틱 기록과 백테스트 라이브러리를 단일 초저지연 풀로 통합하고 있습니다. 퓨어 스토리지와 공동 개발한 마이크론의 150 TB “DirectFlash Module"는 케이블 및 전력 소비를 줄이고, 타협 없는 대역폭을 보장하는 멀티 페타바이트급 랙을 향한 공급업체들의 노력을 상징합니다.
지역별 분석
북미는 2025년 매출의 38.24%를 차지했으며, 그 원동력은 AI 클러스터를 확장하는 미국의 하이퍼스케일러와 시장 데이터 레이크를 현대화하는 월스트리트의 거래 회사들입니다. 이 지역에서는 매년 500억 달러를 훨씬 웃도는 자금이 AI 인프라에 투자되고 있으며, 올플래시 계층은 모든 GPU 포드의 핵심을 이루고 있습니다. 또한, SEC와 FINRA의 엄격한 규제로 인해, “1회 쓰기·다수 읽기(WROM)"에 대한 규정 준수가 요구되고 있지만, 최신 플래시 어레이는 불변 스냅샷 프레임워크를 통해 이를 충족하고 있습니다.
아시아태평양은 가장 빠르게 성장하고 있는 지역으로, 공장 내 품질 관리의 자동화와 각국의 AI 전략에 따른 주권 데이터센터의 보급에 힘입어 2031년까지 연평균 성장률(CAGR)이 20.30%로 성장을 지속하고, 있습니다. 중국은 수출 규제의 영향을 상쇄하기 위해 현지 스토리지 브랜드에 보조금을 지원하고 있는 반면, 일본과 한국은 5G 에지 노드를 현장에서 동영상 분석을 처리하는 소형 플래시 셸프로 업그레이드하고 있습니다. 인도의 IT 서비스 허브에서는 차세대 코로케이션 캠퍼스 내에 올플래시 랙을 도입하여 전 세계 고객을 대상으로 용도 응답 시간을 단축하고 있습니다. 싱가포르와 홍콩에서는 결제 및 청산 신속화에 관한 규정을 준수하기 위해 금융 지구와 지역별 재해 복구용 플래시 클러스터를 연계하고 있습니다. 유럽에서는 에너지 정책과 디지털 혁신의 균형을 유지하면서, 기업들이 와트시당 전력 소비량을 줄일 수 있는 에너지 저장 장치의 도입을 장려하고 있습니다. 독일은 신속한 데이터 조회가 필요한 AI 비전 시스템을 탑재한 ‘ 인더스트리 4.0"의 시범 라인에 자금을 지원하고 있는 반면, 프랑스는 올플래시 백본 계층을 갖춘 자체 관리형 클라우드 리전에 투자하고 있습니다. 북유럽 국가들은 수력발전을 활용하는 캠퍼스에 하이퍼스케일 기업의 진출을 유치함으로써, 고밀도 플래시 트레이에 대한 새로운 수요를 확보하고 있습니다. 한편, 중동의 주요 석유 기업들은 지진파 모델링 장비에 플래시 어레이를 채택하고 있으며, 아프리카의 통신 사업자들은 지역 내 전력 공급이 불안정함에도 불구하고 연중무휴 24시간 가용성이 요구되는 플래시 기반 모바일 머니 플랫폼을 운영하고 있습니다. 이러한 지리적 다각화가 맞물려 올 플래시 어레이 시장의 견실한 성장세를 뒷받침하고 있습니다.
기타 혜택 :
- 엑셀 형식 시장 예측(ME) 시트
- 3개월간의 애널리스트 지원
자주 묻는 질문
목차
제1장 서론
제2장 조사 방법
제3장 주요 요약
제4장 시장 구도
제5장 시장 규모 및 성장 예측
제6장 경쟁 구도
제7장 시장 기회 및 향후 전망
KTH 26.07.08According to Mordor Intelligence, the all flash array market size is expected to grow from USD 23.38 billion in 2025 to USD 27.73 billion in 2026 and is forecast to reach USD 65.09 billion by 2031 at 18.62% CAGR over 2026-2031.
This report is Segmented by Architecture (Scale-Up, Scale-Out, and NVMe-OF Disaggregated), Capacity (<=20 TB, 20-100 TB, and >100 TB), Interface Protocol (SAS/SATA, Fibre Channel, and More), End-User Industry (IT and Telecom, BFSI, Healthcare and Life Sciences, and More), and Geography. The Market Forecasts are Provided in Terms of Value (USD).
Global All Flash Array Market Trends and Insights
Surging hyperscale and edge data-center buildouts
Hyperscale cloud operators collectively allocated more than USD 130 billion in 2025 capex for AI-optimized campuses, and storage now captures roughly one-fifth of that spend. New facilities require dense, low-latency flash tiers to feed thousands of GPUs that process large language model parameters. In parallel, edge deployments at retail outlets, cell towers, and manufacturing sites favor compact flash systems that tolerate vibration and temperature variations yet still deliver consistent throughput. Vendors are responding with unified controller code that scales from two-node edge appliances to rack-scale NVMe-oF fabrics inside core data centers. Utility-driven power caps in major metros further accelerate the move from hybrid drives to flash that delivers higher IOPS per watt. As a result, the All Flash Array market benefits from synchronized demand across centralized clouds and distributed edge nodes.
Performance-critical AI and real-time analytics workloads
AI model training saturates storage links with sequential writes, while inference workloads depend on microsecond random reads. These dual-workload profiles expose the latency and queue-depth limits of hybrid arrays, accelerating adoption of AI powered Storage and pushing banks, insurers, and e-commerce platforms toward all-flash systems. Financial institutions deploying algorithmic trading engines report tangible revenue gains after migrating tick-data stores to all-flash platforms validated under STAC benchmarks. Hospitals leverage flash-based PACS archives to let AI diagnostic engines review MRI and CT scans without delay, accelerating time to diagnosis. Manufacturers run predictive maintenance models on edge-hosted GPUs that ingest sensor telemetry in real time, a workflow that collapses if storage stalls. The convergence of retrieval-augmented generation, graph queries, and streaming analytics positions the All Flash Array market as foundational for next-generation data pipelines.
Up-front capex premium versus hybrid arrays
Even with falling SSD prices, an entry-level all-flash node still lists 40% to 60% higher than a hybrid alternative of equal usable capacity. CFOs in price-sensitive verticals often prioritize initial purchase cost over five-year TCO, delaying flash migration projects. SMEs in Latin America and parts of Southeast Asia extend the life of disk-based arrays by adding cache upgrades rather than shifting workloads outright. Economic uncertainty following inflationary cycles has elongated procurement approvals, further suppressing near-term All Flash Array market conversions.
Other drivers and restraints analyzed in the detailed report include:
- Rapid decline in NAND cost per bit
- Energy-efficiency mandates for enterprise IT
- Controller bottlenecks in scale-up architectures
For complete list of drivers and restraints, kindly check the Table Of Contents.
Segment Analysis
Scale-up arrays delivered 47.12% of 2025 revenue, keeping them the largest contributor to the All Flash Array market. The familiar dual-controller footprint integrates with existing SAN orchestration, explaining its staying power. Yet the same architecture struggles to utilize ever-denser NVMe drives, nudging performance-critical buyers toward scale-out or fully disaggregated NVMe-oF designs. Vendors mitigate risk by adding stateless compute shelves and caching layers, but these retrofits cannot erase fundamental controller constraints.
In contrast, NVMe-oF disaggregated clusters are projected to post a 19.45% CAGR to 2031, the fastest within the All Flash Array market. Disaggregation eliminates single-chassis bottlenecks by pushing storage logic to Ethernet-attached nodes that scale linearly. Pure Storage and several software-defined entrants showcase petabyte-scale GPU farms built on this model, citing sustained line-rate throughput figures during AI model checkpoints. Adoption still hinges on data-center teams mastering RDMA, congestion control, and multi-pathing across high-speed Ethernet, creating a skills gap that tempers near-term rollouts.
The 20-100 TB band held 49.25% of 2025 deployments, representing the sweet spot for database consolidation and VM sprawl elimination. This range balances price, rack power, and rebuild windows, making it the default for mid-sized enterprise refresh cycles. QLC flash plus aggressive inline compression yields effective capacities that dwarf predecessor hybrids without forcing operators into exotic chassis designs.
Systems above 100 TB are forecast to grow at 19.61% CAGR through 2031, outpacing the overall All Flash Array market. Hyperscalers favor these dense shelves to feed GPU clusters where locality lowers east-west traffic costs. Financial trading hubs also gravitate toward high-density builds, consolidating tick history and back-testing libraries onto singular ultra-low-latency pools. Micron's 150 TB DirectFlash Module, co-engineered with Pure Storage, exemplifies the vendor push toward multi-petabyte racks that promise fewer cables, fewer watts, and uncompromised bandwidth.
Complete Report Scope:
- By Architecture
- Scale-Up
- Scale-Out
- NVMe-oF Disaggregated
- By Capacity (Usable)
- <=20 TB
- 20 - 100 TB
- >100 TB
- By Interface Protocol
- SAS/SATA
- Fibre Channel
- iSCSI
- NVMe
- By End-User Industry
- IT and Telecom
- BFSI
- Healthcare and Life Sciences
- Government and Public Sector
- Media and Entertainment
- Manufacturing and Energy
- Other End-User Industries
- By Geography
- North America
- United States
- Canada
- Mexico
- South America
- Brazil
- Argentina
- Chile
- Rest of South America
- Europe
- Germany
- United Kingdom
- France
- Italy
- Spain
- Rest of Europe
- Asia-Pacific
- China
- Japan
- South Korea
- India
- Singapore
- Australia
- Rest of Asia-Pacific
- Middle East and Africa
- Middle East
- Saudi Arabia
- United Arab Emirates
- Turkey
- Rest of Middle East
- Africa
- South Africa
- Nigeria
- Egypt
- Rest of Africa
- Middle East
- North America
Geography Analysis
North America generated 38.24% of 2025 revenue, anchored by U.S. hyperscalers expanding AI clusters and Wall Street trading firms modernizing market-data lakes. The region allocates well over USD 50 billion each year to AI infrastructure, and all-flash tiers sit at the heart of every GPU pod. Strict SEC and FINRA rules also require write-once-read-many compliance, which modern flash arrays fulfill through immutable snapshot frameworks.
Asia-Pacific is the fastest-growing territory, registering a 20.30% CAGR to 2031 as factories automate quality control and national AI strategies proliferate sovereign data centers. China channels subsidies to local storage brands to offset export controls, while Japan and South Korea retrofit 5G edge nodes with compact flash shelves that process video analytics in place. India's IT-services hubs deploy all-flash racks inside next-generation co-location campuses to lower application response times for global clients. Singapore and Hong Kong twin their financial districts with regional disaster-recovery flash clusters to comply with faster clearing and settlement rules. Europe balances energy policy with digital innovation, driving enterprises toward storage that shrinks watt-hour footprints. Germany funds Industry 4.0 pilot lines that embed AI vision systems needing rapid data recall, while France invests in sovereign cloud regions equipped with all-flash backbone tiers. Nordic nations lure hyperscale entrants to hydro-powered campuses, securing new demand for high-density flash trays. Meanwhile, Middle East oil majors adopt flash arrays for seismic modeling rigs, and African telecoms roll out flash-backed mobile-money platforms that require 24 X 7 availability despite regional power volatility. Collectively, geographic diversification supports a resilient growth path for the All Flash Array market.
- Pure Storage Inc.
- Dell Technologies Inc.
- NetApp Inc.
- Hewlett Packard Enterprise Company
- IBM Corporation
- Huawei Technologies Co., Ltd.
- Hitachi Ltd. (Hitachi Vantara LLC)
- Western Digital Corporation
- Fujitsu Limited
- Violin Systems LLC
- Silk Platform Ltd.
- Lenovo Group Limited
- NEC Corporation
- Inspur Electronic Information Industry Co., Ltd.
- Nimbus Data Inc.
- VAST Data Ltd.
- DataDirect Networks Inc. (DDN)
- Pavilion Data Systems Inc.
- Seagate Technology Holdings plc
- AccelStor Inc.
- StorONE Inc.
Additional Benefits:
- The market estimate (ME) sheet in Excel format
- 3 months of analyst support
TABLE OF CONTENTS
1 INTRODUCTION
- 1.1 Study Assumptions and Market Definition
- 1.2 Scope of the Study
2 RESEARCH METHODOLOGY
3 EXECUTIVE SUMMARY
4 MARKET LANDSCAPE
- 4.1 Market Overview
- 4.2 Market Drivers
- 4.2.1 Surging hyperscale and edge data-centre buildouts
- 4.2.2 Rapid decline in NAND cost per bit
- 4.2.3 Performance-critical AI and real-time analytics workloads
- 4.2.4 Energy-efficiency mandates for enterprise IT
- 4.2.5 Tier-0 database consolidation in financial trading hubs
- 4.2.6 Cyber-recovery architectures demanding immutable flash snapshots
- 4.3 Market Restraints
- 4.3.1 Up-front capex premium versus hybrid arrays
- 4.3.2 Controller bottlenecks in scale-up architectures
- 4.3.3 Supply-chain volatility for high-density NAND
- 4.3.4 Limited endurance for write-intensive logging use-cases
- 4.4 Industry Value Chain Analysis
- 4.5 Regulatory Landscape
- 4.6 Technological Outlook
- 4.7 Impact of Macroeconomic Factors
- 4.8 Porter's Five Forces Analysis
- 4.8.1 Threat of New Entrants
- 4.8.2 Bargaining Power of Suppliers
- 4.8.3 Bargaining Power of Buyers
- 4.8.4 Threat of Substitutes
- 4.8.5 Intensity of Competitive Rivalry
5 MARKET SIZE AND GROWTH FORECASTS (VALUES)
- 5.1 By Architecture
- 5.1.1 Scale-Up
- 5.1.2 Scale-Out
- 5.1.3 NVMe-oF Disaggregated
- 5.2 By Capacity (Usable)
- 5.2.1 <=20 TB
- 5.2.2 20 - 100 TB
- 5.2.3 >100 TB
- 5.3 By Interface Protocol
- 5.3.1 SAS/SATA
- 5.3.2 Fibre Channel
- 5.3.3 iSCSI
- 5.3.4 NVMe
- 5.4 By End-User Industry
- 5.4.1 IT and Telecom
- 5.4.2 BFSI
- 5.4.3 Healthcare and Life Sciences
- 5.4.4 Government and Public Sector
- 5.4.5 Media and Entertainment
- 5.4.6 Manufacturing and Energy
- 5.4.7 Other End-User Industries
- 5.5 By Geography
- 5.5.1 North America
- 5.5.1.1 United States
- 5.5.1.2 Canada
- 5.5.1.3 Mexico
- 5.5.2 South America
- 5.5.2.1 Brazil
- 5.5.2.2 Argentina
- 5.5.2.3 Chile
- 5.5.2.4 Rest of South America
- 5.5.3 Europe
- 5.5.3.1 Germany
- 5.5.3.2 United Kingdom
- 5.5.3.3 France
- 5.5.3.4 Italy
- 5.5.3.5 Spain
- 5.5.3.6 Rest of Europe
- 5.5.4 Asia-Pacific
- 5.5.4.1 China
- 5.5.4.2 Japan
- 5.5.4.3 South Korea
- 5.5.4.4 India
- 5.5.4.5 Singapore
- 5.5.4.6 Australia
- 5.5.4.7 Rest of Asia-Pacific
- 5.5.5 Middle East and Africa
- 5.5.5.1 Middle East
- 5.5.5.1.1 Saudi Arabia
- 5.5.5.1.2 United Arab Emirates
- 5.5.5.1.3 Turkey
- 5.5.5.1.4 Rest of Middle East
- 5.5.5.2 Africa
- 5.5.5.2.1 South Africa
- 5.5.5.2.2 Nigeria
- 5.5.5.2.3 Egypt
- 5.5.5.2.4 Rest of Africa
- 5.5.5.1 Middle East
- 5.5.1 North America
6 COMPETITIVE LANDSCAPE
- 6.1 Market Concentration
- 6.2 Strategic Moves
- 6.3 Market Share Analysis
- 6.4 Company Profiles (includes Global level Overview, Market level overview, Core Segments, Financials as available, Strategic Information, Market Rank/Share for key companies, Products and Services, and Recent Developments)
- 6.4.1 Pure Storage Inc.
- 6.4.2 Dell Technologies Inc.
- 6.4.3 NetApp Inc.
- 6.4.4 Hewlett Packard Enterprise Company
- 6.4.5 IBM Corporation
- 6.4.6 Huawei Technologies Co., Ltd.
- 6.4.7 Hitachi Ltd. (Hitachi Vantara LLC)
- 6.4.8 Western Digital Corporation
- 6.4.9 Fujitsu Limited
- 6.4.10 Violin Systems LLC
- 6.4.11 Silk Platform Ltd.
- 6.4.12 Lenovo Group Limited
- 6.4.13 NEC Corporation
- 6.4.14 Inspur Electronic Information Industry Co., Ltd.
- 6.4.15 Nimbus Data Inc.
- 6.4.16 VAST Data Ltd.
- 6.4.17 DataDirect Networks Inc. (DDN)
- 6.4.18 Pavilion Data Systems Inc.
- 6.4.19 Seagate Technology Holdings plc
- 6.4.20 AccelStor Inc.
- 6.4.21 StorONE Inc.
7 MARKET OPPORTUNITIES AND FUTURE OUTLOOK
- 7.1 White-space and Unmet-Need Assessment


