

|
시장보고서
상품코드
2073542
로봇 비전 시장 : 점유율 분석, 업계 동향과 통계, 성장 예측(2026-2031년)Robotic Vision - Market Share Analysis, Industry Trends & Statistics, Growth Forecasts (2026 - 2031) |
||||||
 Mordor Intelligence
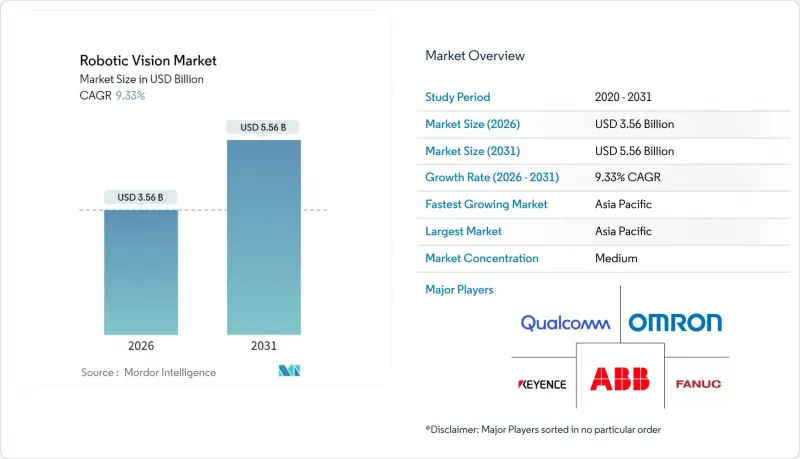
Mordor Intelligence에 의하면, 세계의 로봇 비전 시장 규모는 2026년에 35억 6,000만 달러에 이르고, 2031년까지 55억 6,000만 달러로 확대되어 CAGR은 9.33%를 나타낼 전망입니다.
본 보고서는 기술별(2D 비전 시스템, 3D 비전 시스템, 다중 스펙트럼/적외선 비전 등), 구성 요소별(하드웨어, 소프트웨어, 서비스), 로봇 유형별(산업용 로봇, 드론 등), 용도별(자재관리, 픽 앤 플레이스 등), 최종 사용 산업별(자동차, 농업 등), 지역별로 분류되어 있습니다. 시장 전망은 금액(달러) 기준으로 제시되어 있습니다.
세계 로봇 비전 시장 동향과 인사이트
복잡한 조립 공정에서 AI 기반 3D 비전 시스템의 도입이 가속화되고 있습니다.
AI 내장형 3D 비전을 통해 로봇은 깊이, 자세, 표면 질감을 실시간으로 해석할 수 있게 되어, 배터리 셀, 회로 기판, 성형 플라스틱을 유연하게 배치할 수 있게 됩니다. 독일과 미국의 자동차 공장에서는 고정 지그에서 3D 비전 기반 배치 방식으로 전환한 결과, 배터리 모듈의 불량률을 최대 50%까지 줄였습니다. 중국과 한국의 전자기기 제조업체들은 곡면 기판상의 납땜 접합부 검출 정밀도를 향상시켜 2D 카메라의 한계를 극복했습니다. Intel Movidius나 Qualcomm RB5와 같은 범용 엣지 프로세서는 현재 5와트 미만으로 신경망 추론을 수행할 수 있게 되어, 경량 코봇 내부의 방열 제약을 해소하고 있습니다. 부품 가격 하락에 따라, 과거에는 2D 시스템에 비해 2-3배의 비용이 들었던 3D 시스템도 현재는 불과 50%의 추가 비용만 들게 되어 도입 주기가 가속화되고 있습니다. 이러한 진전은 공급업체의 보너스를 ppm 단위의 결함 목표와 연계시키는 ‘무결함”의 요건에 부합합니다.
인력 부족을 배경으로 한 자동화에 대한 정부의 지원책
선진국에서는 노동 참여율이 팬데믹 이전 수준보다 낮은 상태를 유지하고 있어, 노동 인구 감소에 직면해 있습니다. 영국은 비전 기능을 탑재한 코봇을 도입하는 공장에 2억 5,000만 파운드(3억 1,200만 달러)의 보조금을 지급함으로써, 투자 회수 기간을 2년 미만으로 단축했습니다. 일본에서는 비전 시스템 도입 비용의 30%를 지원해 주는 세액 공제 제도가 식품 가공 및 의약품 제조 분야의 중소기업에 유리하게 작용했습니다. 독일은 중견 기업을 대상으로 한 비전 시스템 도입에 5억 유로(5억 6,500만 달러)의 공동 자금을 지원하며, 반복적인 수작업 과정을 대체하는 프로젝트를 우선적으로 추진했습니다. 이러한 프로그램들은 프로젝트 승인을 신속하게 처리하고, 투명성이 높은 AI 알고리즘을 장려하는 한편, 설명 가능한 비전 모델을 제공하는 업체에 보조금을 지원하고 있습니다.
기존 브라운필드 생산 라인과의 통합 비용이 높다는 점
2010년 이전에 건설된 공장에서는 카메라 클러스터나 엣지 서버에 적합한 네트워크 대역폭, 전력 배선, 물리적 레이아웃을 갖추고 있는 경우가 거의 없습니다. 2025년 조사에 따르면, 북미 자동차 부품 공급업체의 65%가 라인당 50만 달러를 초과하는 비전 시스템 통합 비용에 직면해 있으며, 그 중 거의 절반이 전기 시스템 및 안전성 업그레이드에 소요되고 있습니다. 유럽의 공장에서는 고해상도 이미지 스트림을 처리할 여력이 없는 구형 PLC가 가동되는 경우가 많아, 예산을 늘려야 하는 병렬 제어 아키텍처를 채택할 수밖에 없는 실정입니다. 카메라 및 조명용 특수 제작 브래킷으로 인해 시운전에 수 주일이 소요되고, 또한 이익률이 낮기 때문에 많은 공급업체들은 생산 라인을 전면 교체할 때까지 프로젝트를 미룰 수밖에 없는 상황에 처해 있습니다.
부문별 분석
2025년, 2D 시스템이 로봇 비전 시장 점유율의 56.73%를 차지했습니다. 이는 카메라의 가격 하락과 바코드 및 존재 감지 소프트웨어의 발전 덕분입니다. 전기차용 배터리 및 반도체 검사 수요의 급증에 따라 3D 깊이 감지 시장이 확대되고 있으며, 2031년까지 연평균 성장률(CAGR) 10.32%로 성장할 것으로 전망됩니다. 자동차 생산 라인에서는 CAD 기반 검사와 포인트 클라우드 비교를 통합함으로써 결함 감지율이 99.9%까지 향상되었습니다. 2024년 이후, 비행 시간(ToF) 센서의 가격이 급락함에 따라 3D 셀의 총 비용은 2D 대체품의 불과 1.5배 수준으로 낮아졌습니다. 다중 스펙트럼 및 적외선 옵션은 RGB로는 감지할 수 없는 오염 물질을 감지할 수 있기 때문에 제약 및 식품 안전 분야에서 점차 널리 보급되고 있습니다. 고해상도 2D 이미지를 기록하면서 3D 포인트 클라우드 데이터를 스트리밍하는 하이브리드 아키텍처 덕분에, 한 번의 스캔으로 “추천”, “검사”, “배치”를 처리할 수 있게 되어 사이클 타임을 20% 단축했습니다.
AI를 활용한 분석 기술의 보급으로 인해 성능 차이는 더욱 좁혀지고 있습니다. 기존 필터에 신경망을 결합한 시스템은 수동으로 재프로그래밍할 필요 없이 새로운 결함 유형을 학습할 수 있으므로, 가동 중지 시간을 최소화할 수 있습니다. 물류 업체는 자율 주행 로봇에 3D 비전 기술을 통합하여 팔레트의 치수를 자동으로 측정하고 돌출부를 감지함으로써 적재 오류를 60% 줄였습니다. 가격 차이가 줄어들고 AI 툴체인이 간소화됨에 따라, 3D 비전 기술은 중국, 인도, 동유럽의 중견 공장에 보급되어 로봇 비전 시장의 지속적인 성장 궤도를 확고히 다질 것입니다.
2025년 매출의 66.89%는 카메라, 광학 시스템, 프로세서를 핵심으로 하는 하드웨어가 차지했습니다. 2D 분야에서는 영역 스캔 센서가 주류를 이루는 반면, 3D 빈 피킹에서는 구조화된 빛 및 비행 시간(ToF) 방식의 장치가 활용되고 있습니다. NVIDIA Jetson과 같은 엣지 모듈은 하드웨어 지출의 20-25%를 차지하고 있습니다. 한편, 소프트웨어 시장은 구독형 라이선스, 합성 데이터를 활용한 모델 학습, 원격 보정을 결합한 ‘Vision-as-a-Service”의 보급에 힘입어, 2031년까지 연평균 성장률(CAGR) 9.92%로 성장할 전망입니다. 코그넥스(Cognex)와 같은 공급업체들은 영구 라이선스를 연간 요금제로 전환하여 도입 비용을 60% 절감하는 동시에 지속적인 업데이트를 보장하고 있습니다. 하드웨어 고유의 특성을 추상화하는 미들웨어를 통해, 통합 업체는 코드를 수정하지 않고도 센서를 교체할 수 있게 되어, 벤더 종속으로 인한 문제가 완화되고 있습니다.
서비스 부문도 이에 버금가는 기세로 시스템 설계, 운영자 교육, AI 모델 유지보수 등을 담당하고 있습니다. 소규모 공장에는 전담 데이터 사이언스자가 없기 때문에 풀 매니지드형 패키지가 시장 점유율을 확대하고 있으며, 특히 인건비가 높아 아웃소싱이 합리적인 것으로 여겨지는 북미에서 이러한 경향이 두드러집니다. 예측 기간 동안, 소프트웨어 및 서비스를 아우르는 분야는 로봇 비전 시장에서 매년 시장 점유율을 점진적으로 확대해 나갈 것으로 예상되며, 이는 하드웨어의 이익률에서 지속적인 수익으로의 전략적 전환을 시사합니다.
지역별 분석
아시아태평양은 2025년 매출의 47.91%를 차지하고 있으며, 중국의 “중국 제조 2025”목표와 한국의 반도체 설비 투자를 바탕으로, 2031년까지 연평균 성장률(CAGR) 10.37%를 나타낼 것으로 전망됩니다. 일본에서는 노동력의 고령화로 인해 식품·제약 공장에서 코봇 도입이 확대되고 있으며, 인도에서는 20억 달러 규모의 장려책을 통해 전자기기 제조업체들이 비전 기반 자동화로 전환하고 있습니다. 호주의 광업 기업들은 비전 유도형 자율 주행 트럭과 드릴을 도입하여 작업자의 위험 노출을 줄이고 있습니다.
북미는 다른 지역에 비해 뒤처져 있지만, 인플레이션 억제법에 따른 세액 공제 혜택을 받고 있으며, 이를 통해 비전 기술을 탑재한 배터리 공장에 자금이 지원되고 있습니다. 켄튀르키예주와 텍사스주에 위치한 미국의 물류 허브에서는 연말 성수기의 주문 급증에 대응하기 위해 카메라가 장착된 AMR을 도입하여 물류 센터 개보수 작업을 진행하고 있습니다. 캐나다 퀘벡주에 위치한 항공우주 산업 클러스터에서는 복합재 검사를 위해 3D 비전 기술에 투자하고 있으며, 불량률을 0.05 ppm 미만으로 낮추는 것을 목표로 하고 있습니다.
유럽은 기존 시설과의 통합이라는 과제에 직면해 있지만, 여전히 매우 중요한 역할을 담당하고 있습니다. 독일의 1차 자동차 부품 공급업체는 2024년부터 2025년까지 배터리 검사 라인에 15억 유로(17억 달러)를 투자했습니다. 영국에서는 항공우주 및 제약 업계에서 무인 비전 가이드 가공 기술을 도입함으로써 브렉시트 이후의 인력 부족을 보완하고 있습니다. 폴란드와 체코 공화국 등 중부 유럽 국가들은 자동화 도입 보조금을 저렴한 에너지 요금과 결합함으로써 니어쇼어링 계약을 유치하기 위해 노력하고 있습니다.
중동 및 아프리카, 라틴아메리카 및 소규모 지역에서는 소박한 기반에서 성장을 이루고 있습니다. 멕시코에서는 200억 달러에 달하는 니어쇼어링으로 인한 혜택이 비전 대응형 와이어 하네스 공장에 대한 자금 유입으로 이어졌습니다. 브라질의 농업 기계 제조업체는 자율형 수확기에 비전 기술을 통합하여 운영 인건비를 거의 절반으로 줄였습니다. 사우디아라비아의 “비전 2030”에서는 식품 및 석유화학 분야의 자동화에 5억 달러를 배정하고 있으며, 보조금 승인을 받으려면 비전 기술 도입이 필수 조건으로 되어 있습니다. 남아프리카에서는 비전 유도식 광석 선별기가 시범 도입되어, 광석의 품위를 높이는 동시에 안전 사고를 줄이고 있습니다.
기타 혜택:
- 엑셀 형식 시장 예측(ME) 시트
- 3개월간의 애널리스트 지원
자주 묻는 질문
목차
제1장 서론
제2장 조사 방법
제3장 주요 요약
제4장 시장 구도
제5장 시장 규모와 성장 예측
제6장 경쟁 구도
제7장 시장 기회와 향후 전망
JHS 26.07.09According to Mordor Intelligence, the global robotic vision market size reached USD 3.56 billion in 2026 and is forecast to climb to USD 5.56 billion by 2031, advancing at a 9.33% CAGR.
This report is Segmented by Technology (2D Vision Systems, 3D Vision Systems, Multispectral/Infrared Vision, and More), Component (Hardware, Software, and Services), Robot Type (Industrial Robots, Aerial Drones, and More), Application (Material Handling, Pick and Place, and More), End-User Industry (Automotive, Agriculture, and More), and Geography. The Market Forecasts are Provided in Terms of Value (USD).
Global Robotic Vision Market Trends and Insights
Accelerating adoption of AI-embedded 3D vision for complex assembly
AI-embedded 3D Vision lets robots interpret depth, pose, and surface texture in real time, enabling adaptive placement of battery cells, circuit boards, and molded plastics. Automotive plants in Germany and the United States cut battery-module scrap rates by up to 50% after switching from fixed jigs to 3D vision-guided placement. Electronics makers in China and South Korea improved solder-joint detection on curved substrates, overcoming 2D cameras. Commodity edge processors such as Intel Movidius and Qualcomm RB5 now execute neural inference at under 5 watts, eliminating heat constraints inside lightweight cobots. As component prices fall, 3D systems that once cost 2 to 3 times more than 2D alternatives now carry only a 50% premium, speeding replacement cycles. The advance aligns with zero-defect mandates that tie supplier bonuses to ppm defect targets.
Government incentives for automation amid labor shortages
Advanced economies face shrinking labor pools as participation rates remain below pre-pandemic levels. The United Kingdom awarded GBP 250 million (USD 312 million) in grants to factories integrating vision-equipped cobots, thereby trimming payback periods to under 2 years. Japan's tax credit covering 30% of vision-system outlays favored food-processing and drug-manufacturing SMEs. Germany co-funded EUR 500 million (USD 565 million) in vision deployments for Mittelstand firms, prioritizing projects that replace repetitive manual tasks. These programs accelerate project approvals, incentivize transparent AI algorithms, and channel subsidies to vendors offering explainable vision models.
High integration costs with legacy brown-field production lines
Plants built before 2010 seldom feature network bandwidth, power routing, or physical layouts suitable for camera clusters and edge servers. A 2025 survey showed that 65% of North American automotive suppliers face vision integration costs above USD 500,000 per line, with electrical and safety upgrades accounting for nearly half. European factories often run legacy PLCs that lack the headroom to ingest high-resolution image streams, forcing parallel control architectures that inflate budgets. Custom brackets for cameras and lighting add weeks to commissioning, while tight margins push many suppliers to defer projects until full line replacements.
Other drivers and restraints analyzed in the detailed report include:
- Rapid scale-up of vision-enabled cobots in Tier-2 hubs
- Edge-AI chips slashing latency below 10 ms
- Shortage of vision-system integration talent
For complete list of drivers and restraints, kindly check the Table Of Contents.
Segment Analysis
2D systems accounted for 56.73% of the robotic vision market share in 2025, supported by low camera costs and mature barcode and presence-detection software. The surge of electric-vehicle battery and semiconductor inspection is lifting 3D depth sensing, which is set to grow at a 10.32% CAGR through 2031. Automotive lines merging CAD-driven inspections with point-cloud comparison raised defect-detection rates to 99.9%. Time-of-flight sensor pricing fell sharply after 2024, bringing the total cost of 3D cells to just 1.5 times that of a 2D alternative. Multispectral and infrared options are gaining traction in pharma and food safety, where they detect contaminants invisible to RGB. Hybrid architectures that record high-resolution 2D images while streaming 3D point clouds now handle pick, inspect, and place in a single scan, cutting cycle time by 20%.
The diffusion of AI-powered analytics further narrows the performance gap. Systems overlaying neural networks on traditional filters learn new defect classes without manual reprogramming, minimizing downtime. Logistics providers integrate 3D Vision into autonomous mobile robots to automatically measure pallet dimensions and detect overhang, slashing loading errors by 60%. As the price premium narrows and AI toolchains simplify, 3D Vision will penetrate mid-tier factories across China, India, and Eastern Europe, locking in a durable growth runway for the robotic vision market.
Hardware generated 66.89% of 2025 revenue, anchored by cameras, optics, and processors. Area-scan sensors dominate 2D, while structured-light and time-of-flight devices power 3D bin-picking. Edge modules such as NVIDIA Jetson carry 20-25% of hardware spend. Yet software is on track for a 9.92% CAGR to 2031 as vision-as-a-service bundles subscription licenses, synthetic-data model training, and remote calibration. Vendors like Cognex converted perpetual licenses to annual plans, slashing entry cost by 60% and guaranteeing continuous updates. Middleware that abstracts hardware idiosyncrasies lets integrators swap sensors without rewriting code, easing vendor lock-in pain.
Services trail closely, covering system design, operator training, and AI model maintenance. As small factories lack resident data scientists, fully managed packages are gaining market share, particularly in North America, where labor rates justify outsourcing. Over the forecast window, software and services combined are set to capture incremental points of market share in the robotic vision market each year, signaling a strategic pivot from hardware margins to recurring revenue.
Complete Report Scope:
- By Technology
- 2D Vision Systems
- 3D Vision Systems
- AI-Powered Vision
- Multispectral / Infrared Vision
- Hybrid Vision Architectures
- By Component
- Hardware
- Cameras
- Sensors
- Processors and Edge Modules
- Optics and Lighting
- Communication Modules
- Software
- Image-Processing Algorithms
- AI/ML Models
- Vision Middleware
- Calibration and Simulation Tools
- Services
- Integration and Engineering
- Training and Support
- Maintenance and Upgrades
- Vision-as-a-Service
- Hardware
- By Robot Type
- Industrial Robots
- Collaborative Robots (Cobots)
- Mobile Robots (AMR/AGV)
- Humanoid Robots
- Aerial Drones
- By Application
- Material Handling
- Assembly and Disassembly
- Inspection and Quality Assurance
- Guidance and Navigation
- Packaging and Palletizing
- Pick and Place
- Welding and Soldering
- Surface Finishing and Painting
- Adaptive Tasks and Emerging Use Cases
- By End-User Industry
- Automotive
- Electronics and Semiconductor
- Food and Beverage
- Pharmaceutical and Healthcare
- Aerospace and Defense
- Logistics and Warehousing
- E-commerce and Retail
- Agriculture
- Energy and Utilities
- By Geography
- North America
- United States
- Canada
- Mexico
- Europe
- Germany
- United Kingdom
- France
- Russia
- Rest of Europe
- Asia-Pacific
- China
- Japan
- India
- South Korea
- Australia
- Rest of Asia-Pacific
- Middle East and Africa
- Middle East
- Saudi Arabia
- United Arab Emirates
- Rest of Middle East
- Africa
- South Africa
- Egypt
- Rest of Africa
- Middle East
- South America
- Brazil
- Argentina
- Rest of South America
- North America
Geography Analysis
Asia-Pacific retained 47.91% of 2025 revenue and is on course for a 10.37% CAGR to 2031, buoyed by China's Made in China 2025 targets and South Korea's semiconductor capital outlays. Japan's aging workforce pushes cobot adoption in food and pharma factories, while India's USD 2 billion incentive steers electronics makers toward vision-driven automation. Australia's mining firms deploy vision-guided autonomous trucks and drills, cutting operator exposure to hazards.
North America trails but benefits from the Inflation Reduction Act tax credits that fund vision-enabled battery plants. U.S. logistics hubs in Kentucky and Texas are retrofitting distribution centers with camera-equipped AMRs to handle holiday peak orders. Canada's aerospace corridor in Quebec invests in 3D Vision for composite inspection, aiming to achieve defect rates below 0.05 ppm.
Europe faces brownfield integration hurdles yet remains pivotal. Germany's automotive Tier-1s spent EUR 1.5 billion (USD 1.7 billion) on battery inspection lines across 2024-2025. The United Kingdom offsets post-Brexit labor shortages with lights-out vision-guided machining in aerospace and pharma. Central European nations such as Poland and the Czech Republic lure near-shoring contracts by bundling automation rebates with low energy tariffs.
Middle East and Africa, Latin America, and smaller regions grow from modest bases. Mexico's USD 20 billion near-shoring windfall channeled funds to vision-ready wiring harness plants. Brazil's ag-equipment makers integrate Vision into autonomous harvesters, slashing operator costs nearly in half. Saudi Arabia's Vision 2030 earmarks USD 500 million for food and petrochemical automation, with Vision a prerequisite for subsidy approval. South Africa trials vision-guided ore sorters that uplift grade while curbing safety incidents.
- Cognex Corporation
- Keyence Corporation
- FANUC Corporation
- ABB Ltd.
- Omron Corporation
- Sick AG
- Teledyne DALSA Inc.
- Hexagon AB
- Basler AG
- Yaskawa Electric Corporation
- KUKA AG
- Denso Wave Incorporated
- Universal Robots A/S
- LMI Technologies Inc.
- Intel Corporation
- Qualcomm Technologies Inc.
- Nikon Metrology NV
- Matrox Imaging
- ISRA Vision AG
Additional Benefits:
- The market estimate (ME) sheet in Excel format
- 3 months of analyst support
TABLE OF CONTENTS
1 INTRODUCTION
- 1.1 Study Assumptions and Market Definition
- 1.2 Scope of the Study
2 RESEARCH METHODOLOGY
3 EXECUTIVE SUMMARY
4 MARKET LANDSCAPE
- 4.1 Market Overview
- 4.2 Market Drivers
- 4.2.1 Accelerating Adoption of AI-Embedded 3D Vision for Complex Assembly
- 4.2.2 Government Incentives for Automation Amid Labor Shortages
- 4.2.3 Rapid Scale-Up of Vision-Enabled Cobots in Tier-2 Manufacturing Hubs
- 4.2.4 Edge-AI Chips Slashing Latency Below 10 ms Enabling Precision Tasks
- 4.2.5 Post-2025 ESG Mandates Pushing Zero-Defect Manufacturing
- 4.2.6 Vision-as-a-Service Subscription Models Lower Upfront Costs
- 4.3 Market Restraints
- 4.3.1 High Integration Costs With Legacy Brown-Field Production Lines
- 4.3.2 Shortage of Vision-System Integration Talent Outside Major Tech Clusters
- 4.3.3 Fragmented Sensor and Software Standards Hindering Interoperability
- 4.3.4 Rising Cyber-Security Compliance Costs for Vision-Rich Factories
- 4.4 Industry Value Chain Analysis
- 4.5 Regulatory Landscape
- 4.6 Technological Outlook
- 4.7 Impact of Macroeconomic Factors on the Market
- 4.8 Porter's Five Forces Analysis
- 4.8.1 Threat of New Entrants
- 4.8.2 Bargaining Power of Buyers
- 4.8.3 Bargaining Power of Suppliers
- 4.8.4 Threat of Substitute Products
- 4.8.5 Intensity of Competitive Rivalry
5 MARKET SIZE AND GROWTH FORECASTS (VALUE)
- 5.1 By Technology
- 5.1.1 2D Vision Systems
- 5.1.2 3D Vision Systems
- 5.1.3 AI-Powered Vision
- 5.1.4 Multispectral / Infrared Vision
- 5.1.5 Hybrid Vision Architectures
- 5.2 By Component
- 5.2.1 Hardware
- 5.2.1.1 Cameras
- 5.2.1.2 Sensors
- 5.2.1.3 Processors and Edge Modules
- 5.2.1.4 Optics and Lighting
- 5.2.1.5 Communication Modules
- 5.2.2 Software
- 5.2.2.1 Image-Processing Algorithms
- 5.2.2.2 AI/ML Models
- 5.2.2.3 Vision Middleware
- 5.2.2.4 Calibration and Simulation Tools
- 5.2.3 Services
- 5.2.3.1 Integration and Engineering
- 5.2.3.2 Training and Support
- 5.2.3.3 Maintenance and Upgrades
- 5.2.3.4 Vision-as-a-Service
- 5.2.1 Hardware
- 5.3 By Robot Type
- 5.3.1 Industrial Robots
- 5.3.2 Collaborative Robots (Cobots)
- 5.3.3 Mobile Robots (AMR/AGV)
- 5.3.4 Humanoid Robots
- 5.3.5 Aerial Drones
- 5.4 By Application
- 5.4.1 Material Handling
- 5.4.2 Assembly and Disassembly
- 5.4.3 Inspection and Quality Assurance
- 5.4.4 Guidance and Navigation
- 5.4.5 Packaging and Palletizing
- 5.4.6 Pick and Place
- 5.4.7 Welding and Soldering
- 5.4.8 Surface Finishing and Painting
- 5.4.9 Adaptive Tasks and Emerging Use Cases
- 5.5 By End-User Industry
- 5.5.1 Automotive
- 5.5.2 Electronics and Semiconductor
- 5.5.3 Food and Beverage
- 5.5.4 Pharmaceutical and Healthcare
- 5.5.5 Aerospace and Defense
- 5.5.6 Logistics and Warehousing
- 5.5.7 E-commerce and Retail
- 5.5.8 Agriculture
- 5.5.9 Energy and Utilities
- 5.6 By Geography
- 5.6.1 North America
- 5.6.1.1 United States
- 5.6.1.2 Canada
- 5.6.1.3 Mexico
- 5.6.2 Europe
- 5.6.2.1 Germany
- 5.6.2.2 United Kingdom
- 5.6.2.3 France
- 5.6.2.4 Russia
- 5.6.2.5 Rest of Europe
- 5.6.3 Asia-Pacific
- 5.6.3.1 China
- 5.6.3.2 Japan
- 5.6.3.3 India
- 5.6.3.4 South Korea
- 5.6.3.5 Australia
- 5.6.3.6 Rest of Asia-Pacific
- 5.6.4 Middle East and Africa
- 5.6.4.1 Middle East
- 5.6.4.1.1 Saudi Arabia
- 5.6.4.1.2 United Arab Emirates
- 5.6.4.1.3 Rest of Middle East
- 5.6.4.2 Africa
- 5.6.4.2.1 South Africa
- 5.6.4.2.2 Egypt
- 5.6.4.2.3 Rest of Africa
- 5.6.4.1 Middle East
- 5.6.5 South America
- 5.6.5.1 Brazil
- 5.6.5.2 Argentina
- 5.6.5.3 Rest of South America
- 5.6.1 North America
6 COMPETITIVE LANDSCAPE
- 6.1 Market Concentration
- 6.2 Strategic Moves
- 6.3 Market Share Analysis
- 6.4 Company Profiles (includes Global Level Overview, Market Level Overview, Core Segments, Financials as available, Strategic Information, Market Rank/Share for key companies, Products and Services, and Recent Developments)
- 6.4.1 Cognex Corporation
- 6.4.2 Keyence Corporation
- 6.4.3 FANUC Corporation
- 6.4.4 ABB Ltd.
- 6.4.5 Omron Corporation
- 6.4.6 Sick AG
- 6.4.7 Teledyne DALSA Inc.
- 6.4.8 Hexagon AB
- 6.4.9 Basler AG
- 6.4.10 Yaskawa Electric Corporation
- 6.4.11 KUKA AG
- 6.4.12 Denso Wave Incorporated
- 6.4.13 Universal Robots A/S
- 6.4.14 LMI Technologies Inc.
- 6.4.15 Intel Corporation
- 6.4.16 Qualcomm Technologies Inc.
- 6.4.17 Nikon Metrology NV
- 6.4.18 Matrox Imaging
- 6.4.19 ISRA Vision AG
7 MARKET OPPORTUNITIES AND FUTURE OUTLOOK
- 7.1 White-Space and Unmet-Need Assessment


