

|
시장보고서
상품코드
2073605
인산 비료 : 시장 점유율 분석, 업계 동향 및 통계, 성장 예측(2026-2031년)Phosphatic Fertilizer - Market Share Analysis, Industry Trends & Statistics, Growth Forecasts (2026 - 2031) |
||||||
 Mordor Intelligence
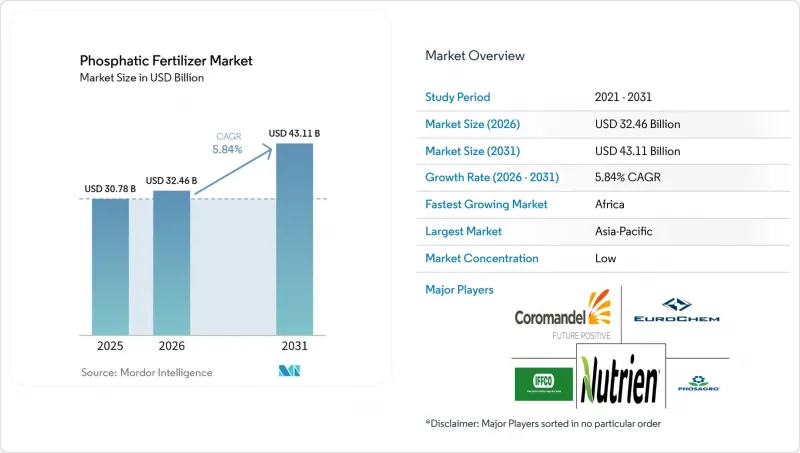
Mordor Intelligence에 의하면, 인산 비료 시장 규모는 2025년 307억 8,000만 달러로 평가되었습니다. 2026년에는 324억 6,000만 달러로 확대되어 2026년부터 2031년에 걸쳐 CAGR 5.8%로 성장을 지속하여, 2031년에는 431억 1,000만 달러에 이를 것으로 예측됩니다.
본 보고서는 유형(단일 비료), 시비 방법(시비 관개, 엽면 시비 등), 작물 유형(밭작물, 원예작물 등) 및 지역(아시아태평양, 유럽, 남미, 북미 등)별로 분류되어 있습니다. 시장 전망은 금액(달러) 및 수량(미터톤) 단위로 제시되어 있습니다.
세계의 인산 비료 시장 동향 및 인사이트
고농도 비료(DAP/MAP)의 사용이 급증하고 있습니다.
현재, 외딴 지역으로의 비료 배송 비용 중 운송비가 최대 20%를 차지하게 되었으며, 이로 인해 생산자들은 단일 과인산석회보다 톤당 P2O5 함량이 1.7-2.0배 많은 DAP나 MAP로 전환할 수밖에 없는 상황에 처해 있습니다. 브라질의 대두 벨트 지역에서는 협동조합이 운송비를 절감하기 위해 고농도 등급의 제품을 중심으로 보관 거점을 통합하고 있으며, 이러한 변화가 뚜렷하게 나타나고 있습니다. 디젤 가격 상승으로 인해 물류 비용 절감 효과가 더욱 커지고 있을 뿐만 아니라, 고농도 등급은 포장 폐기물 감축으로도 이어집니다. 이는 많은 지역에서 강화되고 있는 환경 규제를 준수할 수 있다는 장점이기도 합니다. 트레이더들은 변동이 심한 운임 시장에 대한 헤지 수단으로 DAP 선물 계약을 체결하는 사례가 증가하고 있으며, 판매업체 측에서는 고농도 제품으로 전환함으로써 재고 보유 비용이 두 자릿수 감소했다고 보고하고 있습니다. 인광석 자산을 수직 통합하고 있는 전 세계 생산자들은 프리미엄 수요를 확보하기 위해 제품 라인업을 신속하게 전환할 수 있어 비용 면에서 우위를 점하고 있습니다. 그 결과, 인산비료 시장에서는 총 톤수 증가세가 시사하는 것 이상으로 DAP/MAP의 판매량이 견조하게 증가하고 있으며, 이는 단순한 소비 확대가 아니라 제품 구성의 지속적인 변화를 시사하고 있습니다.
아시아태평양의 정부 보조금 재검토
인도의 DBT 프로그램에서는 제품별 보조금에서 농가 중심의 지급금으로 연간 144억 달러가 전환되고 있으며, 이를 통해 인 함량이 높은 경우가 많은 균형 잡힌 NPK 복합비료의 사용이 촉진되고 있습니다. 중국의 '제14차 5개년 계획'이 제도에 따른 인센티브는 지급액이 리튬 이용 효율 목표와 연동되어 있으며, 정밀 기기나 저카드뮴 자재를 도입하는 생산자에게 보상이 지급됩니다. 이러한 정책들은 국제 공급업체들이 DAP나 TSP 등 아시아태평양에서 선호되는 등급에 맞추어 생산 능력을 재조정해야 하기 때문에 전 세계 수급 동향에 영향을 미치고 있습니다. 각 보조금이 지급될 때마다 단기적인 판매량이 급증하는 현상이 나타나고 있어, 수입업체들은 주기의 초기 단계에서 재고를 확보할 수밖에 없는 상황입니다. 장기적으로는 농가들이 일률적인 가격 지원 대신 지속 가능한 농업 실천에 대해 직접 현금을 받게 됨에 따라, 서방형 또는 생물학적 첨가제가 함유된 프리미엄 제품의 가격 결정력이 강화될 것입니다. 제조업체 입장에서는 아시아태평양의 정책이 근본적으로 재검토됨에 따라, 기술력을 활용한 제품군의 수익성 개선 여지가 확대되고, 그 결과 인산비료 시장 전반에 걸친 연구개발 투자가 가속화될 것입니다.
인광석 가격의 변동
세계 인광석 거래의 대부분을 장악하고 있는 모로코와 중국 두 나라가 시행한 수출 규제로 인해, 2024년에는 분기 대비 40-60%의 가격 변동이 발생했습니다. 모로코의 OCP 그룹은 확인된 매장량의 75%를 장악하고 있으며, 국내 정제 파이프라인의 균형을 맞추기 위해 재량에 따라 출하 속도를 조절하고 있습니다. 한편, 중국은 국내 식량 안보라는 우선순위를 지키기 위해 할당제를 시행하고 있습니다. 브라질이나 인도와 같이 수입 의존도가 높은 지역에서는 입고 비용의 급등으로 인해 농가 수익이 압박을 받고, 수요가 막판에 미뤄지는 상황이 발생하고 있습니다. 인광석 선물 시장은 여전히 유동성이 낮아, 가공업체들은 현물 가격 변동과 단기적인 신용 위험에 노출되어 있습니다. 제조업체들은 조달처 다각화를 통해 리스크 헤지를 도모하고 있지만, 물류 병목 현상이나 광석 품질의 편차로 인해 대체품의 유연한 활용이 제한되고 있습니다. 그 결과 발생하는 불확실성은 선물 계약 체결을 저해하고 재고 자금 조달을 제약할 뿐만 아니라, 단기적으로는 인산비료 시장의 연평균 성장률(CAGR)을 1.4포인트 하락시키고 있습니다.
부문별 분석
DAP(인산이암모늄)은 2025년 인산 비료 시장에서 39.4%를 차지하며 최대 점유율을 유지했습니다. 이러한 경쟁력은 질소와 인의 균형 잡힌 조성, 다양한 작물에 대한 폭넓은 적용성, 그리고 주요 농업 시장에서 확립된 유통망에 기인합니다. DAP는 영양분 농도가 높고 비용 대비 효과가 뛰어난 영양 공급이 가능하기 때문에 곡물, 유지종자 및 상업 작물에서 널리 사용되고 있습니다. 또한, 인산일암모늄 및 기타 인산계 제품 역시, 특히 작물의 정착과 수확량 최적화를 위해 효율적인 인 관리가 필수적인 집약형 농업 시스템에서 계속해서 수요를 주도하고 있습니다.
삼중과인산석회(TSP)는 2026년부터 2031년까지 연평균 성장률(CAGR) 8.2%를 나타낼 것으로 예측되며, 가장 빠르게 성장하는 부문이 될 것으로 전망됩니다. 이러한 성장은 높은 인 농도, 정밀한 영양 관리 프로그램과의 적합성, 그리고 인 결핍 토양이 있는 지역에서의 도입 확대에 힘입어 이루어지고 있습니다. 환경 규제가 강화되는 가운데, TSP는 고효율 비료의 배합이나 특수 작물 시비에 적합하기 때문에 인기가 높아지고 있습니다. 또한, 폴리인산암모늄 용액, 미량영양소가 강화된 인산염, 코팅 인산 비료 등의 신제품들이 생산자가 이용할 수 있는 인 공급 수단의 폭을 넓혀주고 있습니다. 예측 기간 동안 제조업체들은 분석 정밀도가 높고 부가가치가 높은 인산 제품에 주력하여, 영양소 이용 효율 향상, 시비량 절감 및 작물 생산성 향상을 통해 시장 성장을 가속할 것으로 예측됩니다.
지역별 분석
아시아태평양은 중국과 인도 등 주요 농업국의 활발한 수요에 힘입어 2025년에는 인산비료 시장 점유율의 46.5%를 차지하며 최대 점유율을 기록했습니다. 정부가 지원하는 영양 관리 프로그램, 균형 잡힌 비료 시비 방식의 보급 확대, 그리고 작물 생산성에 대한 요구 증가가 해당 지역 전체의 인산비료 소비를 지속적으로 견인하고 있습니다. 동남아시아 국가들도 수요에 크게 기여하고 있는데, 이는 쌀, 팜유, 원예작물 생산자들이 수확량과 영양분 이용 효율을 높이기 위해 고효율 인 비료를 점점 더 많이 채택하고 있기 때문입니다. 그 결과, 아시아태평양은 여전히 인산 비료의 최대 지역 시장으로 자리 잡고 있습니다.
아프리카는 2026년부터 2031년까지 연평균 성장률(CAGR) 7.4%를 나타낼 것으로 전망되며, 가장 빠르게 성장하는 지역 시장이 될 것으로 예측됩니다. 이러한 성장은 상업 농업의 확대, 식량 안보에 대한 투자 증가, 비료 사용량 증가, 그리고 곡물, 원예 작물, 수출 지향적 현금 작물의 재배 확대에 힘입어 이루어지고 있습니다. 중동은 비료 생산 능력에 대한 지속적인 투자, 농업 현대화 프로그램, 그리고 관개 농업 시스템에 힘입어 계속해서 지역 수요의 주요 견인차 역할을 하고 있습니다. 이러한 요인들은 예측 기간 동안 해당 지역 전체의 인산비료 소비를 촉진할 것으로 예측됩니다.
북미에서는 정밀 농업 기술의 광범위한 도입과 대규모 옥수수·대두 생산 시스템에 대한 지속적인 수요에 힘입어 꾸준한 성장이 예상됩니다. 유럽에서는 농업 시장의 성숙, 엄격한 환경 규제, 그리고 영양분 이용 최적화를 위한 노력에 힘입어 비교적 완만한 속도로 성장할 것으로 예측됩니다. 한편, 남미에서는 특히 브라질과 아르헨티나에서 대두, 옥수수, 사탕수수 재배가 확대됨에 따라 계속해서 매력적인 성장 기회가 예상되며, 이는 지역 전체의 인산 비료에 대한 장기적인 수요를 뒷받침하고 있습니다.
기타 혜택 :
- 엑셀 형식 시장 예측(ME) 시트
- 3개월간의 애널리스트 지원
자주 묻는 질문
목차
제1장 서론
제2장 보고서의 내용
제3장 주요 요약 및 주요 조사 결과
제4장 주요 업계 동향
제5장 시장 규모 및 성장 예측
제6장 경쟁 구도
제7장 비료 업계 CEO가 직면하는 중요 전략적 과제
KTH 26.07.07According to Mordor Intelligence, the phosphatic fertilizer market size is projected to grow from USD 30.78 billion in 2025 to USD 32.46 billion in 2026 and is forecast to reach USD 43.11 billion by 2031 at 5.8% CAGR over 2026-2031.
This report is Segmented by Type (Straight), Application Mode (Fertigation, Foliar, and More), Crop Type (Field Crops, Horticultural Crops, and More), and Geography (Asia-Pacific, Europe, South America, North America, and More). The Market Forecasts are Provided in Terms of Value (USD) and Volume (Metric Tons).
Global Phosphatic Fertilizer Market Trends and Insights
Surge in High-Analysis Fertilizer (DAP/MAP) Adoption
Transportation now accounts for up to 20% of delivered fertilizer cost in remote areas, pushing growers toward DAP and MAP that pack 1.7-to-2.0-times more P2O5 per ton than single superphosphate. Brazil's soybean belt illustrates the shift as cooperatives consolidate storage around highly concentrated grades to reduce freight charges. Rising diesel prices amplify logistics savings, while concentrated grades also reduce packaging waste -a benefit that aligns with tightening environmental regulations in many regions. Traders increasingly lock forward contracts for DAP to hedge against volatile freight markets, and distributors report double-digit drops in inventory carrying costs after pivoting to high-analysis products. Global producers with vertically integrated phosphate rock assets enjoy a cost advantage because they can switch product slates quickly to capture premium demand. As a result, the phosphatic fertilizer market registers stronger volume gains for DAP/MAP than total tonnage growth suggests, indicating an ongoing shift in composition rather than mere consumption expansion.
Government Subsidy Realignment in Asia-Pacific
India's DBT program redirects USD 14.4 billion annually from product-specific subsidies to farmer-centric transfers, driving adoption of balanced NPK formulations that often include higher phosphorus shares. Chinese incentives under the 14th Five-Year Plan tie payments to phosphorus use efficiency targets, rewarding growers who deploy precision equipment and low-cadmium inputs. These policies affect global flows because international suppliers must recalibrate capacity toward Asia-Pacific-preferred grades such as DAP and TSP. Short-term volume spikes follow each subsidy tranche, compelling importers to secure inventory earlier in the cycle. Longer term, premium products with controlled release or biological additives gain pricing power as farmers receive direct cash for sustainable practices rather than blanket price supports. For manufacturers, the Asia-Pacific policy overhaul magnifies revenue upside for technology-rich offerings, thereby accelerating R&D investment across the phosphatic fertilizer market.
Phosphate Rock Price Volatility
Export restrictions from Morocco and China-the two nations controlling the bulk of globally traded phosphate rock triggered 40-60% quarter-on-quarter price swings during 2024. Morocco's OCP Group dominates 75% of known reserves and uses discretionary shipment pacing to balance its internal upgrade pipeline, while China imposes quotas to shield domestic food-security priorities. Import-dependent regions such as Brazil and India experience landing-cost spikes that compress farm profits and prompt last-minute demand deferrals. Futures markets for phosphate rock remain thin, leaving processors exposed to spot volatility and short-cycle credit risks. Manufacturers hedge by diversifying sources, yet logistics bottlenecks and ore-quality differentials limit substitution flexibility. The resulting uncertainty undermines forward contracting, constrains inventory financing, and subtracts 1.4 percentage points from the phosphatic fertilizer market CAGR in the immediate term.
Other drivers and restraints analyzed in the detailed report include:
- Rising Food-Grade Phosphate Demand for Specialty Crops
- Precision Farming Enabling Phosphorus Use Efficiency
- Stringent European Union Cadmium Limits Increasing Costs
For complete list of drivers and restraints, kindly check the Table Of Contents.
Segment Analysis
DAP (Diammonium Phosphate) held the largest share of the phosphatic fertilizer market, accounting for 39.4% in 2025. This dominance is attributed to its balanced nitrogen-phosphorus composition, broad applicability across various crops, and a well-established distribution network in major agricultural markets. DAP is extensively used in cereals, oilseeds, and commercial crops due to its high nutrient concentration and cost-effective nutrient delivery. Additionally, monoammonium phosphate and other phosphate-based products continue to drive demand, particularly in intensive farming systems where efficient phosphorus management is essential for crop establishment and yield optimization.
Triple superphosphate (TSP) is projected to be the fastest-growing segment, with a projected CAGR of 8.2% during 2026-2031. This growth is driven by its high phosphorus concentration, compatibility with precision nutrient management programs, and increasing adoption in regions with phosphorus-deficient soils. As environmental regulations become stricter, TSP is gaining popularity due to its suitability for enhanced-efficiency fertilizer formulations and applications in specialty crops. Furthermore, emerging products such as ammonium polyphosphate solutions, micronutrient-fortified phosphates, and coated phosphate fertilizers are broadening the range of phosphorus delivery options available to growers. Over the forecast period, manufacturers are projected to focus on high-analysis and value-added phosphate products, promoting market growth through improved nutrient-use efficiency, reduced application intensity, and enhanced crop productivity.
Complete Report Scope:
- Type
- Straight
- Phosphatic
- DAP
- MAP
- SSP
- TSP
- Others
- Phosphatic
- Straight
- Application Mode
- Fertigation
- Foliar
- Soil
- Crop Type
- Field Crops
- Horticultural Crops
- Turf & Ornamental
- Geography
- Asia-Pacific
- Australia
- Bangladesh
- China
- India
- Indonesia
- Japan
- Pakistan
- Philippines
- Thailand
- Vietnam
- Rest of Asia-Pacific
- Europe
- France
- Germany
- Italy
- Netherlands
- Russia
- Spain
- Ukraine
- United Kingdom
- Rest of Europe
- North America
- Canada
- Mexico
- United States
- Rest of North America
- South America
- Argentina
- Brazil
- Rest of South America
- Middle East
- Saudi Arabia
- Turkey
- United Arab Emirates
- Rest of Middle East
- Africa
- Egypt
- Nigeria
- South Africa
- Rest of Africa
- Asia-Pacific
Geography Analysis
Asia-Pacific accounted for the largest phosphatic fertilizer market share, 46.5% in 2025, driven by strong demand from major agricultural economies such as China and India. Government-supported nutrient management programs, increasing adoption of balanced fertilization practices, and rising crop productivity requirements continue to support phosphate fertilizer consumption across the region. Southeast Asian countries also contribute significantly to demand as rice, palm oil, and horticultural producers increasingly adopt high-efficiency phosphorus products to improve yields and nutrient-use efficiency. As a result, Asia-Pacific remains the largest regional market for phosphatic fertilizers.
Africa is anticipated to be the fastest-growing regional market, with a projected CAGR of 7.4% during 2026-2031. This growth is driven by the expansion of commercial agriculture, increased investments in food security initiatives, higher fertilizer application rates, and the rising cultivation of cereals, horticultural crops, and export-oriented cash crops. The Middle East remains a significant contributor to regional demand, supported by ongoing investments in fertilizer production capacity, agricultural modernization programs, and irrigated farming systems, which are projected to bolster phosphatic fertilizer consumption across the region during the forecast period.
North America is projected to witness steady growth, supported by widespread adoption of precision agriculture technologies and continued demand from large-scale corn and soybean production systems. Europe is anticipated to expand at a comparatively moderate pace due to mature agricultural markets, stringent environmental regulations, and nutrient-use optimization initiatives. Meanwhile, South America continues to offer attractive growth opportunities, supported by expanding soybean, corn, and sugarcane cultivation, particularly in Brazil and Argentina, reinforcing long-term phosphatic fertilizer demand across the region.
- PhosAgro PJSC
- EuroChem Group AG
- Nutrien Ltd.
- Coromandel International Limited
- CF Industries Holdings Inc.
- Indian Farmers Fertilizer Cooperative Limited (IFFCO)
- K+S Aktiengesellschaft
- Koch Fertilizer LLC
- SABIC Agri-Nutrients Company
- OCP Group
- The Mosaic Company
- ICL Group Ltd.
- Yara International ASA
- J.R. Simplot Company
- DAP Fertilizers Public Co. (KSA)
Additional Benefits:
- The market estimate (ME) sheet in Excel format
- 3 months of analyst support
TABLE OF CONTENTS
1 INTRODUCTION
- 1.1 Study Assumptions & Market Definition
- 1.2 Scope of the Study
- 1.3 Research Methodology
2 REPORT OFFERS
3 EXECUTIVE SUMMARY & KEY FINDINGS
4 KEY INDUSTRY TRENDS
- 4.1 Acreage Of Major Crop Types
- 4.1.1 Field Crops
- 4.1.2 Horticultural Crops
- 4.2 Average Nutrient Application Rates
- 4.2.1 Primary Nutrients
- 4.2.1.1 Field Crops
- 4.2.1.2 Horticultural Crops
- 4.2.1 Primary Nutrients
- 4.3 Agricultural Land Equipped For Irrigation
- 4.4 Regulatory Framework
- 4.5 Value Chain & Distribution Channel Analysis
- 4.6 Market Drivers
- 4.6.1 Surge in high-analysis fertilizer (DAP/MAP) adoption
- 4.6.2 Government subsidy realignment in Asia-Pacific
- 4.6.3 Rising food-grade phosphate demand for specialty crops
- 4.6.4 Precision farming enabling phosphorus use efficiency
- 4.6.5 Controlled-release phosphate coatings adoption
- 4.6.6 Low-cadmium African phosphate rock supply growth
- 4.7 Market Restraints
- 4.7.1 Phosphate rock price volatility
- 4.7.2 Stringent European Union cadmium limits increasing costs
- 4.7.3 Shift toward biofertilizers and P-solubilizing microbes
- 4.7.4 Eutrophication-driven application caps in North America and European Union
5 MARKET SIZE AND GROWTH FORECASTS (VALUE AND VOLUME)
- 5.1 Type
- 5.1.1 Straight
- 5.1.1.1 Phosphatic
- 5.1.1.1.1 DAP
- 5.1.1.1.2 MAP
- 5.1.1.1.3 SSP
- 5.1.1.1.4 TSP
- 5.1.1.1.5 Others
- 5.1.1.1 Phosphatic
- 5.1.1 Straight
- 5.2 Application Mode
- 5.2.1 Fertigation
- 5.2.2 Foliar
- 5.2.3 Soil
- 5.3 Crop Type
- 5.3.1 Field Crops
- 5.3.2 Horticultural Crops
- 5.3.3 Turf & Ornamental
- 5.4 Geography
- 5.4.1 Asia-Pacific
- 5.4.1.1 Australia
- 5.4.1.2 Bangladesh
- 5.4.1.3 China
- 5.4.1.4 India
- 5.4.1.5 Indonesia
- 5.4.1.6 Japan
- 5.4.1.7 Pakistan
- 5.4.1.8 Philippines
- 5.4.1.9 Thailand
- 5.4.1.10 Vietnam
- 5.4.1.11 Rest of Asia-Pacific
- 5.4.2 Europe
- 5.4.2.1 France
- 5.4.2.2 Germany
- 5.4.2.3 Italy
- 5.4.2.4 Netherlands
- 5.4.2.5 Russia
- 5.4.2.6 Spain
- 5.4.2.7 Ukraine
- 5.4.2.8 United Kingdom
- 5.4.2.9 Rest of Europe
- 5.4.3 North America
- 5.4.3.1 Canada
- 5.4.3.2 Mexico
- 5.4.3.3 United States
- 5.4.3.4 Rest of North America
- 5.4.4 South America
- 5.4.4.1 Argentina
- 5.4.4.2 Brazil
- 5.4.4.3 Rest of South America
- 5.4.5 Middle East
- 5.4.5.1 Saudi Arabia
- 5.4.5.2 Turkey
- 5.4.5.3 United Arab Emirates
- 5.4.5.4 Rest of Middle East
- 5.4.6 Africa
- 5.4.6.1 Egypt
- 5.4.6.2 Nigeria
- 5.4.6.3 South Africa
- 5.4.6.4 Rest of Africa
- 5.4.1 Asia-Pacific
6 COMPETITIVE LANDSCAPE
- 6.1 Key Strategic Moves
- 6.2 Market Share Analysis
- 6.3 Company Landscape
- 6.4 Company Profiles (Includes Global Level Overview, Market Level Overview, Core Business Segments, Financials, Key Information, Market Rank, Market Share, Products and Services, and Analysis of Recent Developments)
- 6.4.1 PhosAgro PJSC
- 6.4.2 EuroChem Group AG
- 6.4.3 Nutrien Ltd.
- 6.4.4 Coromandel International Limited
- 6.4.5 CF Industries Holdings Inc.
- 6.4.6 Indian Farmers Fertilizer Cooperative Limited (IFFCO)
- 6.4.7 K+S Aktiengesellschaft
- 6.4.8 Koch Fertilizer LLC
- 6.4.9 SABIC Agri-Nutrients Company
- 6.4.10 OCP Group
- 6.4.11 The Mosaic Company
- 6.4.12 ICL Group Ltd.
- 6.4.13 Yara International ASA
- 6.4.14 J.R. Simplot Company
- 6.4.15 DAP Fertilizers Public Co. (KSA)


