

|
시장보고서
상품코드
2097133
자동차 그린 타이어 : 시장 점유율 분석, 업계 동향 및 통계, 성장 예측(2026-2031년)Automotive Green Tires - Market Share Analysis, Industry Trends & Statistics, Growth Forecasts (2026 - 2031) |
||||||
 Mordor Intelligence
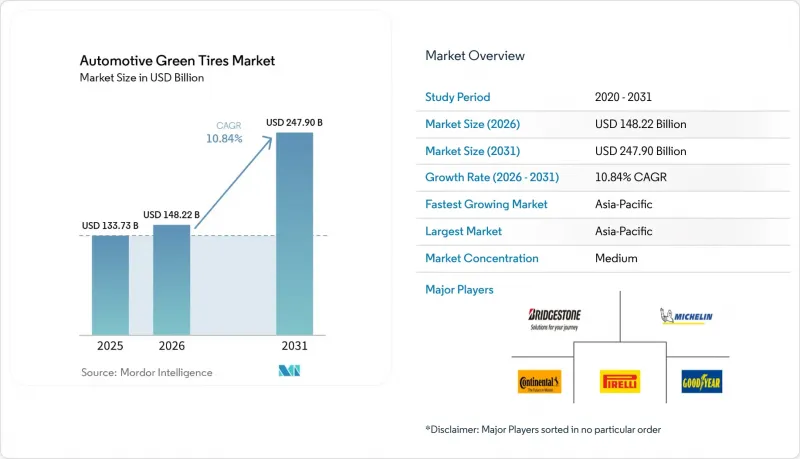
Mordor Intelligence에 의하면, 자동차 그린 타이어 시장 규모는 2025년 1,337억 3,000만 달러로 평가되었습니다. 2026년에는 1,482억 2,000만 달러로 확대되어 2026년부터 2031년에 걸쳐 CAGR 10.84%로 성장을 지속하여, 2031년에는 2,479억 달러에 이를 것으로 예측됩니다.
본 보고서는 차종별(승용차 및 상용차), 최종 사용자별(OEM 및 애프터마켓), 소재별(천연고무 기반 타이어, 합성고무 기반 타이어, 실리카계 복합 타이어, 바이오 폴리머 타이어 등), 판매 채널별(오프라인 및 온라인), 그리고 지역별로 분류되어 있습니다. 시장 전망은 금액(달러) 및 수량(단위)으로 제시되어 있습니다.
세계의 자동차 그린 타이어 시장 동향 및 인사이트
전기차(EV) 생산의 급증
세계 전기차 조립 라인에서는 순간 토크에 대응하고, 소음이 적으며, 구름 저항을 최소화한 타이어가 요구되고 있습니다. 2025년 12월에 시행된 새로운 FMVSS 305a 규정은 배터리식 전기 구동 시스템에 맞추어 타이어의 안전성을 규정하고 있습니다. 제너럴 모터스(GM)는 2025년까지 북미 전기차 연간 생산 능력을 100만 대로 확대했으며, 이에 따라 특수 컴파운드에 대한 수요가 더욱 증가하고 있습니다. 2027년부터 2032년까지 적용되는 환경 기준인 EPA의 다중 오염 물질 기준은 소형 차량의 온실가스(GHG) 배출량을 50% 감축하는 것을 목표로 하고 있어, 이러한 전환을 뒷받침하고 있습니다. 이러한 규제로 인해 모든 신형 승용차 및 상용차 플랫폼에 전기차 중심의 성능이 반영될 것입니다. 자동차 제조업체들이 주행 거리 연장을 경쟁하는 가운데, 배터리 효율에 최적화된 타이어는 조달상의 우선순위가 되고 있습니다.
전 세계 CO2 규제 및 타이어 표시 규제의 강화가 제품 개발을 재편하고 있습니다.
유로 7 규정에 따라 2028년 7월부터 세계 최초로 타이어 마모 입자 배출량 상한 규제가 도입됩니다. ‘지속 가능한 제품을 위한 에코디자인 규정’에 따라 2025년 4월까지 타이어용 디지털 제품 여권이 도입되어 전체 수명 주기를 파악했습니다. 중국의 2024년 탄소 발자국 기준에 따르면, 타이어 제조업체는 제조 단계 전반에 걸친 배출량을 정량화해야 할 의무가 있습니다. 미국 타이어 제조업체 협회는 캘리포니아주의 ‘더 안전한 소비자 제품 규정(Safer Consumer Products rule)’을 충족하기 위해 6PPD의 대체 후보로 5가지 물질을 선정했습니다. 현재 규제 준수는 구체적인 브랜딩상의 우위를 가져다주고 있으며, 단순한 라벨 표시 추가가 아닌 환경 지표를 핵심 설계에 반영한 기업이 높이 평가받고 있습니다.
높은 초기 비용이 시장 침투의 과제로 대두
EPA(미국 환경보호청)의 유해 대기 오염 물질 규제로 인해 미국 타이어 공장에는 연간 1,330만 달러의 규정 준수 비용이 추가로 발생하고 있습니다. 중국의 2024-2025년 에너지 절약 행동 계획은 산업 배출 규제를 강화하고 있어 현지 생산 비용을 상승시키고 있습니다. DOE(미국 에너지부)의 8,800만 달러 규모의 ‘차량 기술’ 보조금은 보다 친환경적인 모빌리티가 비용 격차를 해소하기 위해 여전히 보조금이 필요하다는 점을 인정하고 있습니다. 프리미엄 가격 책정은 타이어 수명보다 짧은 회수 기간을 우선시하는 차량 함대의 예산을 압박하고 있습니다. 신흥국에서의 대출 접근성 문제 또한 보급을 더욱 지연시키고 있습니다.
부문 분석
2025년에는 승용차가 62.76%로 최대 점유율을 유지한 반면, 상용차는 연평균 성장률(CAGR) 12.05%의 성장 궤도에 올랐습니다. 스마트 센서 패키지와 구름 저항 저감을 통해 사업자는 연료비를 절감하여 가격 프리미엄을 상쇄할 수 있습니다. EPA의 CAFE 기준 상향 조정과 차량 함대의 전기화 의무화가 이러한 계산을 더욱 뒷받침하고 있습니다. 대조적으로, 일반 소비자를 통한 보급은 브랜드 메시지와 판매점의 영향력에 좌우됩니다. 상용차를 대상으로 한 실증 시험을 통해 내구성이 입증됨에 따라, 지속 가능한 타이어 시장은 계속해서 다양화되고 있으며, 모든 카테고리에 이익을 가져다주는 판매량 확대가 촉진되고 있습니다. 향후에는 화물 운송 분야에서 확립된 비용 곡선을 바탕으로 승용차 분야에서의 채택도 촉진될 것입니다.
상용차 플랫폼에서는 전기 구동계에 의한 높은 토크가 타이어에 작용하기 때문에 컴파운드 혁신이 가속화되고 있습니다. 차량 관리자는 텔레매틱스를 활용하여 마모 상태를 분석하고 있으며, 데이터 기반이며 저탄소인 모델에 대한 수요가 증가하고 있습니다. 캘리포니아주와 EU의 정책에서는 상용 차량 함대의 배출량과 조달 크레딧이 연동되어 있어, 이를 통해 지속 가능한 기술로의 전환이 더욱 촉진되고 있습니다. 승용차 시장의 성장은 견조하지만, 소득 탄력성이 높은 구매 행태의 영향을 받아 보조금이 지급되는 지역 이외에서는 보급 속도가 둔화되고 있습니다.
애프터마켓 사업은 연평균 성장률(CAGR) 9.55%로 확대되고 있으며, OEM이 차지하는 67.85%의 시장 점유율을 서서히 잠식하고 있습니다. 자동차 제조업체들은 스코프 3 목표를 달성하기 위해 공급업체 평가 기준에 타이어의 탄소 배출량 데이터를 반영하고 있습니다. GM이 내세운 2040년까지의 탄소 중립 공약은 이러한 방향성을 여실히 보여주고 있습니다. 대량 발주 계약을 통해 타이어 제조업체는 수요 예측의 명확성을 확보할 수 있으며, 이는 장기적인 연구개발 투자 회수를 뒷받침하고 있습니다. 반면, 애프터마켓 채널은 소비자의 인식이나 장착 업체의 추천에 의존하고 있어, 급속한 시장 침투에는 신뢰성이 낮은 요인으로 작용하고 있습니다.
OEM 시장의 성장에 따라 공급 기업의 협상력이 변화하고 있으며, 제조업체는 차량의 개발 주기나 디지털 패스포트 요건에 부응해야 합니다. 자동차 제조업체의 기준을 충족하는 공급업체는 모든 신형 모델에서 지속적인 수주량과 브랜드 노출을 확보할 수 있습니다. 애프터마켓 수요는 특히 노후화된 차량의 교체 수요 측면에서 여전히 크지만, OEM 순정 장비가 최초 판매 시점에서 지속 가능한 선택지로 자리 잡음에 따라 그 성장세는 완만해지고 있습니다.
지역별 분석
아시아태평양은 2025년에 지속가능 타이어 시장 점유율의 49.10%를 차지했으며, 2031년까지 연평균 성장률(CAGR) 9.37%로 성장할 것으로 전망됩니다. 중국의 ‘제14차 5개년 계획’에서는 자원 생산성을 20% 향상시키는 것을 목표로 하고 있으며, 타이어 및 고무 재활용을 우선 과제로 삼고 있습니다. 인도에서는 젖은 노면 접지력, 구름 저항, 소음에 관한 규제를 시행하고 있으며, 국내 생산을 수출 기대치에 부합하도록 조정하고 있습니다. 일본에서는 타이어 컴파운드의 수명 주기 배출량을 줄일 수 있는 셀룰로오스 나노섬유 시범 생산 라인에 자금을 지원하고 있습니다. 이러한 협력적인 정책을 통해 지역 밀착형 공급망이 구축되고, 수입 리스크가 완화되면서 아시아태평양은 지속 가능한 타이어 혁신의 중심지로 자리매김하고 있습니다.
유럽에서는 환경 기준을 법률에 직접 반영함으로써 성장의 기반을 마련하고, 제조업체에 환경 부하가 낮은 컴파운드에 대한 예측 가능한 수요를 제공합니다. 유로 7의 미세먼지 배출 상한선과 에코디자인·디지털 패스포트에 따라, 조만간 타이어 마모 및 탄소 발자국에 관한 검증 가능한 데이터가 요구될 것입니다. 회수된 카본블랙 및 열분해 클러스터에 대한 투자는 기업이 소재 순환을 완성하고 규정 준수 크레딧을 확보하는 데 도움이 됩니다. 많은 신흥 시장이 EU 기준을 채택하고 있으므로, 이러한 기준을 충족하는 기업은 수출에서 우위를 점할 수 있습니다.
북미에서는 연방 정부의 연구 보조금과 주 정부의 재활용 장려책을 결합하여 지속 가능한 타이어 시장을 순환형 모델로 이끌고 있습니다. 바이오오타디엔에 대한 미국 에너지부(DOE)의 자금 지원과 캘리포니아주의 타이어 장려 프로그램은 업스트림 부문의 혁신과 하류 부문 수요 견인력이 융합되고 있음을 보여줍니다. 차량 운영 사업자들은 더 엄격해진 대형 차량용 온실가스 기준 준수를 간소화해 주는 데이터 기반 타이어를 중시하고 있으며, 이에 따라 장거리 노선에서의 도입이 확대되고 있습니다. 남미, 중동 및 아프리카에서는 확대 속도가 완만하지만, 수출 접근성을 확보하기 위해 EU의 표시 기준을 채택하고 있습니다. 다국적 OEM의 조달 지침에 따라 가격에 민감한 이들 지역에도 지속 가능한 기술이 보급되면서, 지속 가능한 타이어 시장 규모는 기존의 주요 시장을 넘어 서서히 확대되고 있습니다.
기타 혜택 :
- 엑셀 형식 시장 예측(ME) 시트
- 3개월간의 애널리스트 지원
자주 묻는 질문
목차
제1장 서론
제2장 조사 방법
제3장 주요 요약
제4장 시장 구도
제5장 시장 규모 및 성장 예측
제6장 경쟁 구도
제7장 시장 기회 및 향후 전망
KTH 26.08.05According to Mordor Intelligence, the automotive green tires market size is expected to grow from USD 133.73 billion in 2025 to USD 148.22 billion in 2026 and is forecast to reach USD 247.9 billion by 2031 at 10.84% CAGR over 2026-2031.
This report is Segmented by Vehicle Type (Passenger Vehicles and Commercial Vehicles), End-User Type (OEM and Aftermarket), Material Type (Natural Rubber-Rich Tires, Synthetic Rubber-Rich Tires, Silica-Based Composite Tires, Bio-Based Polymer Tires, and More), and Distribution Channel (Offline and Online) Geography. The Market Forecasts are Provided in Terms of Value (USD) and Volume (Units).
Global Automotive Green Tires Market Trends and Insights
Surging Electric-Vehicle (EV) Production
Global EV assembly lines require tires that handle instant torque, low noise, and minimal rolling resistance. New FMVSS 305a rules, effective December 2025, align tire safety with battery-electric drivetrains . General Motors plans 1 million EV units of annual North American capacity by 2025, magnifying demand for specialized compounds. Environmental standards for 2027-2032, EPA multi-pollutant standards target a 50% GHG cut in light-duty vehicles, reinforcing the shift. These regulations embed EV-centric performance in every new passenger and commercial platform. As automakers race to extend driving range, tires optimized for battery efficiency become a procurement priority
Stricter global CO2 & Tire-Labelling Regulations Reshape Product Development
Euro 7 introduces the world's first mandatory tire-wear particulate caps beginning July 2028 . The Ecodesign for Sustainable Products Regulation will add digital product passports for tires by April 2025, capturing the end-to-end lifecycle. China's 2024 carbon footprint standard obliges tire producers to quantify emissions across manufacturing stages. The U.S. Tire Manufacturers Association has identified five potential 6PPD alternatives to meet California's Safer Consumer Products rule. Compliance now confers a tangible branding advantage, rewarding firms that embed environmental metrics into core design rather than bolt-on labeling.
High Upfront Cost Premium Challenges Market Penetration
EPA hazardous-air-pollutant rules add USD 13.3 million in annual compliance expense to U.S. tire plants . China's 2024-2025 Energy Conservation action plan tightens industrial emissions, raising local production costs. DOE's USD 88 million Vehicle Technologies grants acknowledge that greener mobility still needs subsidies to close cost gaps. Premium pricing strains fleet budgets that prioritize payback horizons shorter than tire life. Credit access in emerging economies further slows uptake.
Other drivers and restraints analyzed in the detailed report include:
- Booming Replacement-Tire Demand Creates Aftermarket Opportunities
- Smart-Tire Sensor integration Transforms Lifecycle Economics
- Load-Bearing Limits in Heavy Commercial Fleets Constrain Adoption
For complete list of drivers and restraints, kindly check the Table Of Contents.
Segment Analysis
Commercial vehicles added a 12.05% CAGR growth lane, even though passenger cars retained the largest share with 62.76% in 2025. Smart-sensor packages and lower rolling resistance allow operators to cut fuel bills, offsetting the price premium. EPA CAFE increments and fleet electrification mandates amplify this calculus. In contrast, consumer uptake depends on brand messaging and dealership influence. As commercial trials validate durability, the sustainable tire market continues diversifying, encouraging volume scaling that benefits all categories. Over time, passenger-vehicle adoption will gain from cost curves established in freight.
Commercial platforms also expose tires to higher torque from electric drivetrains, accelerating compound innovation. Fleet managers use telematics to analyze wear, reinforcing demand for data-ready, low-carbon models. California and the EU policies link commercial-fleet emissions to procurement credits, further tipping decisions toward sustainable technologies. Passenger market growth remains steady but faces income-elastic buying behavior, slowing conversion outside subsidized jurisdictions.
Aftermarket programs are growing at a 9.55% CAGR, slowly eroding the OEM's 67.85% hold. Automakers embed tire carbon data in supplier scorecards to hit Scope-3 targets. GM's carbon-neutral pledge by 2040 exemplifies the direction. Large volume contracts give tire firms forecast clarity, supporting long R&D paybacks. Meanwhile, aftermarket channels rely on consumer awareness and installer recommendations, factors less reliable for rapid penetration.
OEM growth shifts bargaining power, requiring manufacturers to align with vehicle development cycles and digital passport requirements. Suppliers that meet automaker thresholds gain repeat volume and brand exposure on every new model. Aftermarket demand remains sizeable, especially for replacement in aging vehicle parks, but growth moderates as OEM fitments lock in sustainable options at first sale.
Complete Report Scope:
- By Vehicle Type
- Passenger Vehicles
- Commercial Vehicles
- By End-User
- OEM
- Aftermarket
- By Material Type
- Natural-Rubber-Rich Tires
- Synthetic-Rubber-Rich Tires
- Silica-Based Composite Tires
- Bio-Based Polymer Tires
- Recycled-Material Tires
- By Distribution Channel
- Offline (Dealers & Retail Chains)
- Online (E-commerce Platforms)
- By Geography
- North America
- United States
- Canada
- Rest of North America
- South America
- Brazil
- Argentina
- Rest of South America
- Europe
- Germany
- United Kingdom
- France
- Italy
- Spain
- Russia
- Rest of Europe
- Asia-Pacific
- China
- India
- Japan
- South Korea
- Rest of Asia-Pacific
- Middle East and Africa
- Saudi Arabia
- United Arab Emirates
- South Africa
- Egypt
- Rest of Middle East and Africa
- North America
Geography Analysis
Asia-Pacific held 49.10% of the sustainable tire market share in 2025 and is projected to grow at a 9.37% CAGR through 2031. China's 14th Five-Year Plan seeks a 20% rise in resource productivity and identifies tire-rubber recycling as a priority. India enforces wet-grip, rolling-resistance, and noise limits that align domestic production with export expectations. Japan funds cellulose-nanofiber pilot lines that can cut lifecycle emissions in tire compounds. These coordinated policies build localized supply chains, buffer import risks, and keep Asia-Pacific at the center of sustainable tire innovation.
Europe anchors growth by writing environmental criteria directly into law, giving manufacturers predictable demand for low-impact compounds. Euro 7 particulate caps and the Ecodesign digital passport will soon require verifiable data on tire wear and carbon footprints. Investments in recovered carbon black and pyrolysis clusters help companies close material loops and secure compliance credits. Firms that meet these benchmarks gain export leverage because many emerging markets adopt EU norms.
North America blends federal research grants with state recycling incentives, steering the sustainable tire market toward circular models. DOE funding for bio-butadiene and California's Tire Incentive Program illustrate the mix of upstream innovation and downstream demand pulls. Fleet operators value data-rich tires that simplify compliance with tighter heavy-duty greenhouse-gas standards, lifting uptake on long-haul routes. South America, the Middle East, and Africa expand more slowly yet adopt EU labeling to safeguard export access. Multinational OEM procurement guidelines diffuse sustainable technologies into these price-sensitive regions, gradually lifting the sustainable tire market size beyond its traditional strongholds.
- Michelin Group
- Bridgestone Corporation
- Continental AG
- Goodyear Tire & Rubber Company
- Pirelli & C. SpA
- Yokohama Rubber Co. Ltd.
- Apollo Tyres Ltd.
- Hankook Tire & Technology
- Sumitomo Rubber Industries Ltd.
- Nokian Tyres plc
- Toyo Tire Corporation
- Kumho Tire Co. Inc.
- Giti Tire
- Linglong Tire
- CEAT Ltd.
Additional Benefits:
- The market estimate (ME) sheet in Excel format
- 3 months of analyst support
TABLE OF CONTENTS
1 Introduction
- 1.1 Study Assumptions & Market Definition
- 1.2 Scope of the Study
2 Research Methodology
3 Executive Summary
4 Market Landscape
- 4.1 Market Overview
- 4.2 Market Drivers
- 4.2.1 Surging electric-vehicle (EV) production
- 4.2.2 Stricter global CO2 and tire-labelling regulations
- 4.2.3 Booming replacement-tire demand post-2024
- 4.2.4 Smart-tire sensor integration lowers lifecycle cost
- 4.2.5 OEM Scope-3 accounting pushes greener materials
- 4.2.6 ASEAN rice-husk-ash silica commercialisation
- 4.3 Market Restraints
- 4.3.1 High upfront cost premium vs. conventional tires
- 4.3.2 Load-bearing limits in heavy commercial fleets
- 4.3.3 Bio-rubber feedstock competition with medical gloves
- 4.3.4 EU particulate-emission caps delaying new compounds
- 4.4 Value/Supply-Chain Analysis
- 4.5 Regulatory Landscape
- 4.6 Technological Outlook
- 4.7 Porter's Five Forces
- 4.7.1 Threat of New Entrants
- 4.7.2 Bargaining Power of Buyers/Consumers
- 4.7.3 Bargaining Power of Suppliers
- 4.7.4 Threat of Substitute Products
- 4.7.5 Intensity of Competitive Rivalry
5 Market Size & Growth Forecasts (Value (USD) and Volume (Units))
- 5.1 By Vehicle Type
- 5.1.1 Passenger Vehicles
- 5.1.2 Commercial Vehicles
- 5.2 By End-User
- 5.2.1 OEM
- 5.2.2 Aftermarket
- 5.3 By Material Type
- 5.3.1 Natural-Rubber-Rich Tires
- 5.3.2 Synthetic-Rubber-Rich Tires
- 5.3.3 Silica-Based Composite Tires
- 5.3.4 Bio-Based Polymer Tires
- 5.3.5 Recycled-Material Tires
- 5.4 By Distribution Channel
- 5.4.1 Offline (Dealers & Retail Chains)
- 5.4.2 Online (E-commerce Platforms)
- 5.5 By Geography
- 5.5.1 North America
- 5.5.1.1 United States
- 5.5.1.2 Canada
- 5.5.1.3 Rest of North America
- 5.5.2 South America
- 5.5.2.1 Brazil
- 5.5.2.2 Argentina
- 5.5.2.3 Rest of South America
- 5.5.3 Europe
- 5.5.3.1 Germany
- 5.5.3.2 United Kingdom
- 5.5.3.3 France
- 5.5.3.4 Italy
- 5.5.3.5 Spain
- 5.5.3.6 Russia
- 5.5.3.7 Rest of Europe
- 5.5.4 Asia-Pacific
- 5.5.4.1 China
- 5.5.4.2 India
- 5.5.4.3 Japan
- 5.5.4.4 South Korea
- 5.5.4.5 Rest of Asia-Pacific
- 5.5.5 Middle East and Africa
- 5.5.5.1 Saudi Arabia
- 5.5.5.2 United Arab Emirates
- 5.5.5.3 South Africa
- 5.5.5.4 Egypt
- 5.5.5.5 Rest of Middle East and Africa
- 5.5.1 North America
6 Competitive Landscape
- 6.1 Market Concentration
- 6.2 Strategic Moves
- 6.3 Market Share Analysis
- 6.4 Company Profiles (Includes Global Level Overview, Market Level Overview, Core Segments, Financials as Available, Strategic Information, Market Rank/Share, Products & Services, Recent Developments)
- 6.4.1 Michelin Group
- 6.4.2 Bridgestone Corporation
- 6.4.3 Continental AG
- 6.4.4 Goodyear Tire & Rubber Company
- 6.4.5 Pirelli & C. SpA
- 6.4.6 Yokohama Rubber Co. Ltd.
- 6.4.7 Apollo Tyres Ltd.
- 6.4.8 Hankook Tire & Technology
- 6.4.9 Sumitomo Rubber Industries Ltd.
- 6.4.10 Nokian Tyres plc
- 6.4.11 Toyo Tire Corporation
- 6.4.12 Kumho Tire Co. Inc.
- 6.4.13 Giti Tire
- 6.4.14 Linglong Tire
- 6.4.15 CEAT Ltd.


