

|
시장보고서
상품코드
2097143
전기버스 충전 인프라 : 시장 점유율 분석, 업계 동향과 통계, 성장 예측(2026-2031년)Electric Bus Charging Infrastructure - Market Share Analysis, Industry Trends & Statistics, Growth Forecasts (2026 - 2031) |
||||||
 Mordor Intelligence
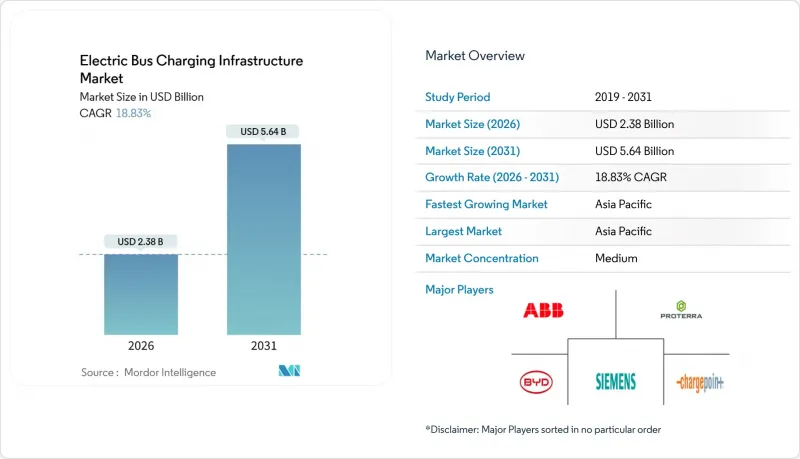
Mordor Intelligence에 의하면, 전기버스 충전 인프라 시장 규모는 2026년에 23억 8,000만 달러에서 2031년까지 56억 4,000만 달러에 이를 것으로 예측되며, 예측 기간 중 연평균 복합 성장률(CAGR)은 18.83%를 나타낼 전망입니다.
본 보고서는 충전기 유형(저속 충전기 및 급속 충전기), 충전 방식(AC 충전 및 DC 충전), 커넥터 유형(CHAdeMO, Combined Charging System, 기타), 충전 레벨(레벨 1 이상), 연결성(비연결 스테이션 및 연결 스테이션), 지역(북미 등)별로 분류되어 있습니다. 시장 전망은 금액(달러) 기준으로 제시되어 있습니다.
전 세계 전기버스 충전 인프라 시장 동향 및 인사이트
정부의 제로 에미션 버스 도입 의무
주요 지역에서 도입된 구속력 있는 구매 요건으로 인해, 대중교통 기관이 전기화를 미룰 여지는 사라졌습니다. 캘리포니아주의 ‘첨단 청정 차량(Advanced Clean Fleets)’ 규정에 따르면, 대중교통 사업자는 2029년 이후부터 무공해 버스만 구매할 수 있게 되며, 2040년까지 모든 차량이 이 규정을 준수해야 합니다. 유럽연합(EU)의 개정된 '청정 차량 지침'에 따르면, 2035년까지 신규 도입되는 도시 버스를 100% 무공해 차량으로 전환해야 합니다. 이러한 동기화된 규제로 인해 예측 가능한 수요 파이프라인이 형성되어, 전력 회사와 차고 운영 업체는 수년에 걸친 인프라 구축 프로그램에 투자할 수 있게 됩니다.
LFP 배터리 가격이 90달러/kWh 미만으로 하락(2025년)
2025년에는 인산철 리튬(LFP) 배터리 팩 가격이 kW시당 90달러 미만으로 떨어지면서, 총 소유 비용(TCO) 측면에서 전기버스가 디젤 버스에 비해 갖는 비용상의 우위가 더욱 두드러지게 되었습니다. 현재는 일반적인 운행 주기에 대응하기 위해 더 소형화된 배터리 팩으로도 충분해졌으며, 그 결과 피크 시간대의 충전 전력 요구량이 감소하고 차고당 대용량 충전기 설치 대수도 줄어들었습니다. 이러한 가격 동향에 따라, 그동안 자금 면에서 제약을 겪어왔던 신흥 시장의 중규모 사업자들에 의한 도입이 더욱 확대될 전망입니다. 사업자는 150kW 급속 충전기와 250kW시 배터리 팩을 조합하더라도 노선의 유연성을 유지할 수 있게 되었으며, 연료비 및 유지보수비 절감을 고려하면 투자 회수 기간을 7년 미만으로 단축할 수 있습니다.
차고지의 계통 연계 리드타임은 24개월 이상
주요 대도시권에서 수 메가와트 규모의 차고 충전 시설에 대한 전력사 연결 대기 기간은 24-36개월에 달하며, 이는 심각한 병목 현상으로 작용하여 차량 전동화 일정을 지연시키고, 교통 기관으로 하여금 버스 조달을 단계적으로 진행할 수밖에 없게 만들고 있습니다. 따라서 교통 기관은 버스 납품 예정일 2-3년 전에 전력망 연결을 확보해야 하며, 이로 인해 조달 절차가 복잡해지고 프로젝트 리스크가 높아지고 있습니다. 일부 지역에서는 대중교통 전기화 프로젝트를 위한 우선 처리 절차가 마련되어 있지만, 대상 지역은 여전히 제한적이며 신청이 쇄도하고 있습니다.
부문 분석
2025년, 전기버스 충전 인프라 시장에서 급속 충전기의 점유율은 64.34%를 차지했습니다. 이는 버스 운행 일정을 유지하기 위해 주간 충전이 필요한 교통 기관 수요에 힘입은 결과입니다. 이 부문은 2031년까지 연평균 성장률(CAGR) 20.55%로 확대될 것으로 예측됩니다. 정격 출력 150-350kW의 급속 충전 장치는 60분 이내에 충전률 80%를 달성할 수 있으므로, 차량은 1교대당 2-3회의 완전 충전 주기를 수행할 수 있게 됩니다. 차고 운영 사업자들은 제한된 수의 급속 충전기와 야간 충전 전용 저속 충전기를 다수 조합함으로써 설비 투자를 최적화하고 있습니다.
상업용 배터리의 사이클 수명이 4,000회 풀 사이클을 초과하여 성능 저하에 대한 우려가 완화됨에 따라, 급속 충전의 경제성이 향상되었습니다. 버스 고속 수송 시스템(BRT)은 10-15분의 터미널 정차 시간이 짧은 운행 간격을 유지하기 위한 자동 팬터그래프 연결을 가능하게 하므로, 급속 충전의 혜택을 가장 많이 받고 있습니다. 저속 충전기는 부차적인 역할을 하지만, 정차 시간이 충분히 길고 하루 주행 거리가 짧은 차량군에게는 여전히 매력적인 선택지입니다.
2025년 전기버스 충전 인프라 시장 규모 중 직류(DC) 설비가 72.51%를 차지하며, 2031년까지 연평균 성장률(CAGR) 22.38%를 나타낼 것으로 예측됩니다. 이는 각 기관이 차량을 운행 상태로 유지하기 위한 2시간 미만의 턴어라운드를 중시하고 있음을 반영합니다. 각 사업자는 에너지 손실을 줄이고 운영 비용을 절감하는 95%에 가까운 변환 효율을 중요하게 여기고 있습니다. 수냉식 케이블과 밀폐형 캐비닛을 통해 주변 온도가 40°C를 초과하는 경우에도 지속적인 고출력 공급이 가능해져, 여름 성수기 열로 인한 출력 저하를 방지할 수 있습니다. 모듈식 아키텍처 덕분에 차고는 150kW 캐비닛부터 도입을 시작하여, 차량 수 증가에 맞추어 파워 블록을 추가해 600kW까지 확장할 수 있으므로 초기 투자가 낭비되지 않습니다.
AC 충전기는 차량 수가 적고, 운행 경로가 짧으며, 전력망 업그레이드에 막대한 비용이 드는 경우 등에서는 여전히 틈새 수요를 유지하고 있습니다. 정격 출력 22-43kW 단위는 동급 DC 시스템에 비해 훨씬 저렴하기 때문에 각 기관은 350kW DC 충전기 1대 분의 비용 정도로 5대의 버스를 수용하는 차고의 전기화를 실현할 수 있습니다. 대부분의 경우, 정비 공장에 설치된 기존 3상 배선은 최소한의 개조만으로 재사용이 가능하여 프로젝트 기간을 수개월 단축할 수 있습니다. 또한, DC 충전기가 유지보수 중일 때 AC 포트가 예비 기능으로 작동하므로 버스가 예정대로 운행될 수 있습니다.
지역별 분석
아시아태평양은 2025년 전기버스 충전 인프라 시장 점유율의 41.87%를 차지하고 있으며, 2031년까지 연평균 성장률(CAGR) 19.81%로 확대될 것으로 예측됩니다. 중국이 2027년까지 각 성의 성도에서 전기버스의 완전 도입을 달성하겠다는 방침을 발표함에 따라, 차고지 건설 및 송전망 강화가 급속히 진행되고 있습니다. 인도의 입찰에서는 다년간의 충전 서비스가 패키지화되어 있어, 이를 통해 자본 리스크가 이전됨에 따라 민간 기업의 진입이 가속화되고 있습니다. 일본과 한국에서는 지역 사업자도 전기화 체계에 포함시키기 위해 대상을 한정하여 보조금을 지급하고 있는 반면, 중국에서는 배터리 교체 시범 사업을 통해 매우 높은 가동률을 실현하는 모델이 시험되고 있습니다.
남미의 경우, 브라질 상파울루가 민관 협력 자금 조달 구조 하에서 2028년까지 2,600대 이상의 버스를 전기화하겠다는 공약을 중심으로 연평균 성장률(CAGR) 18.22%를 나타낼 것으로 예측됩니다. 칠레의 수도에서는 전력망 변동 위험을 헤지하기 위해 태양광 발전 설비와 차고 내 충전기를 통합하고 있으며, 콜롬비아의 보고타에서는 단계적인 차량 도입을 지원하기 위해 터미널 역에 120기의 급속 충전기를 설치하는 계획이 추진되고 있습니다. 사우디아라비아의 1,000대 버스 조달 입찰을 필두로 한 서아시아는 보다 광범위한 다각화 이니셔티브의 일환으로 연평균 성장률(CAGR) 17.98%로 확대될 것으로 예측됩니다.
북미와 유럽에서는 각각 13.88% 및 13.55%의 연평균 성장률(CAGR)이 예상되지만, 송전망 연결에 24-36개월의 리드타임이 소요되기 때문에 성장세는 제한될 전망입니다. 캘리포니아주에서는 2029년 이후 제로 배출 버스를 구매하도록 의무화하는 규정에 따라 200개 이상의 교통 기관이 조달 주기에 참여하게 될 것입니다. 유럽연합(EU)의 2035년 무공해 의무화 목표는 수십억 유로 규모의 보조금 프로그램의 기반이 되고 있습니다. 두 지역 모두 계통 연계의 병목 현상을 완화하기 위해 허가 절차의 효율화와 변전소의 사전 승인된 업그레이드에 투자하고 있습니다.
기타 혜택:
- 엑셀 형식 시장 예측(ME) 시트
- 3개월간의 애널리스트 지원
자주 묻는 질문
목차
제1장 서론
제2장 조사 방법
제3장 주요 요약
제4장 시장 구도
제5장 시장 규모와 성장 예측
제6장 경쟁 구도
제7장 시장 기회와 향후 전망
KTH 26.08.06According to Mordor Intelligence, the electric bus charging infrastructure market size stands at USD 2.38 billion in 2026 and is projected to reach USD 5.64 billion by 2031, reflecting an 18.83% CAGR during the forecast period.
This report is Segmented by Charger Type (Slow Charger and Fast Charger), Charging Type (AC Charging and DC Charging), Connector Type (CHAdeMO, Combined Charging System, and Others), Level of Charging (Level 1 and More), Connectivity (Non-Connected Stations and Connected Stations), and Geography (North America and More). The Market Forecasts are Provided in Terms of Value (USD).
Global Electric Bus Charging Infrastructure Market Trends and Insights
Government Zero-Emission Bus Mandates
Binding purchase requirements introduced in leading regions have eliminated transit agencies' ability to delay electrification. California's Advanced Clean Fleets rule obliges public operators to buy only zero-emission buses from 2029, with complete fleet compliance by 2040. The European Union's revised Clean Vehicles Directive mandates that 100% of new urban buses be zero-emission by 2035. These synchronized mandates create a predictable demand pipeline, enabling utilities and depot contractors to invest in multi-year infrastructure programs.
Falling LFP Battery Prices Below USD 90/kWh (2025)
Lithium-iron-phosphate pack prices dropped below USD 90 per kilowatt-hour in 2025, sharpening the cost advantage of electric buses over diesel on a total cost of ownership basis. More miniature battery packs now suffice for regular duty cycles, which in turn lowers peak charging power requirements and reduces the number of high-capacity chargers per depot. The price trend supports wider adoption by medium-sized agencies in emerging markets that previously faced capital constraints. Operators can now pair 150-kilowatt fast chargers with 250-kilowatt-hour packs and still maintain route flexibility, shortening payback periods to under seven years when fuel and maintenance savings are considered.
Depot Grid-Connection Lead Times >=24 Months
Utility interconnection queues for multi-megawatt depot charging sites have extended to 24 to 36 months in major metropolitan areas, creating a critical bottleneck that delays fleet electrification timelines and forces transit agencies to phase bus procurements. Transit agencies must therefore secure grid connections 2 to 3 years before planned bus deliveries, which complicates procurement processes and increases project risk. Some regions offer expedited pathways for transit electrification projects, but geographical coverage remains limited and heavily oversubscribed.
Other drivers and restraints analyzed in the detailed report include:
- Megawatt Charging System Standard Finalization (2024)
- Depot Smart-Charging Software Cuts Demand Fees 25-40%
- Urban Land Scarcity for >=1 MW Substations
For complete list of drivers and restraints, kindly check the Table Of Contents.
Segment Analysis
Fast chargers held 64.34% of the electric bus charging infrastructure market share in 2025, fueled by agencies that require mid-day top-ups to keep buses on schedule. The segment is projected to advance at a 20.55% CAGR through 2031. Fast-charging hardware, rated at 150-350 kilowatts, enables 80% state of charge in under 60 minutes, allowing vehicles to perform two or three complete cycles per shift. Depot operators optimize capital expenditures by pairing a limited number of fast chargers with a larger pool of slow units dedicated to overnight replenishment.
The economics of fast charging have improved as commercial battery cycle life has extended beyond 4,000 full-equivalent cycles, mitigating concerns about degradation. Bus rapid transit systems benefit most from fast charging, as terminal dwell times of 10-15 minutes accommodate automated pantograph connections that maintain tight headways. Slow chargers, while secondary, still appeal to fleets with generous dwell periods and lower daily mileage.
DC equipment accounted for 72.51% of the electric bus charging infrastructure market size in 2025 and is projected to post a 22.38% CAGR to 2031, reflecting agencies' preference for sub-two-hour turnarounds that keep vehicles on the road. Operators value conversion efficiencies near 95%, which trim energy losses and lower operating expenses. Liquid-cooled cables and sealed cabinets allow continuous high-power delivery even when ambient temperatures exceed 40 °C, preventing thermal derating during summer peaks. Modular architectures let depots start with 150-kilowatt cabinets and add power blocks to reach 600 kilowatts as fleet size grows, so early investments never become stranded.
AC chargers keep a niche where fleets are small, routes are short, and grid upgrades are cost-prohibitive. Units rated 22-43 kilowatts cost significantly less than comparable DC systems, allowing agencies to electrify a five-bus garage for roughly the price of one 350-kilowatt DC dispenser. Existing three-phase wiring, often installed for maintenance workshops, can be reused with minimal modification, shortening project timelines by several months. AC ports also serve as redundancy when DC dispensers undergo maintenance, ensuring buses can still depart on schedule.
Complete Report Scope:
- By Charger Type
- Slow Charger
- Fast Charger
- By Charging Type
- AC Charging
- DC Charging
- By Connector Type
- CHAdeMO
- Combined Charging System (CCS)
- Others
- By Level of Charging
- Level 1
- Level 2
- Level 3
- By Connectivity
- Non-connected Stations
- Connected Stations
- By Geography
- North America
- United States
- Canada
- Rest of North America
- South America
- Brazil
- Argentina
- Rest of South America
- Europe
- United Kingdom
- Germany
- Spain
- Italy
- France
- Russia
- Rest of Europe
- Asia-Pacific
- India
- China
- Japan
- South Korea
- Rest of Asia-Pacific
- Middle East and Africa
- United Arab Emirates
- Saudi Arabia
- Turkey
- Egypt
- South Africa
- Rest of Middle-East and Africa
- North America
Geography Analysis
Asia-Pacific accounted for 41.87% of the electric bus charging infrastructure market share in 2025 and is projected to expand at a 19.81% CAGR through 2031. China's directive to achieve full electric bus penetration in provincial capitals by 2027 is driving rapid depot construction and grid reinforcement. Indian tenders bundle multi-year charging services, transferring capital risk and accelerating private participation. Japan and South Korea offer targeted subsidies to bring regional operators into the electrification fold, while battery-swapping pilots in China test ultra-high utilization models.
South America is forecasted to grow at an 18.22% CAGR, anchored by Brazil's Sao Paulo commitment to electrify over 2,600 buses by 2028 under public-private financing structures. Chile's capital integrates solar arrays with depot chargers to hedge against grid volatility, and Colombia's Bogota system schedules 120 fast chargers across terminal stations to support phased vehicle deployment. Western Asia, led by Saudi Arabia's 1,000-bus tender, is expected to expand at a 17.98% CAGR as part of broader diversification initiatives.
North America and Europe anticipate CAGRs of 13.88% and 13.55% respectively, tempered by 24-36-month grid-connection lead times. California's mandate to purchase zero-emission buses from 2029 brings over 200 transit agencies into the procurement cycle. The European Union's binding 2035 zero-emission target underpins multi-billion-euro subsidy programs. Both regions invest in streamlined permit processes and pre-approved substation upgrades to alleviate interconnection bottlenecks.
- ABB Ltd.
- Siemens AG
- Heliox BV
- ChargePoint Inc.
- Proterra Inc.
- Efacec Power Solutions
- Kempower Oyj
- Alstom SA
- Schneider Electric SE
- Star Charge
- TGOOD Global Ltd.
- Tritium DCFC Ltd.
- EnBW AG
- EVgo Inc.
Additional Benefits:
- The market estimate (ME) sheet in Excel format
- 3 months of analyst support
TABLE OF CONTENTS
1 Introduction
- 1.1 Study Assumptions and Market Definition
- 1.2 Scope of the Study
2 Research Methodology
3 Executive Summary
4 Market Landscape
- 4.1 Market Overview
- 4.2 Market Drivers
- 4.2.1 Government Zero-Emission Bus Mandates
- 4.2.2 Falling LFP Battery Prices Below USD 90/kWh (2025)
- 4.2.3 Megawatt Charging System (MCS) Standard Finalisation (2024)
- 4.2.4 Depot Smart-Charging Software Cuts Demand Fees 25 to 40%
- 4.2.5 Energy-as-a-Service Financing Unlocks Depot CAPEX
- 4.2.6 Battery-Swapping Depots in China Cut Dwell Time to Less than 5 Min
- 4.3 Market Restraints
- 4.3.1 Depot Grid-Connection Lead Times above 24 Months
- 4.3.2 Urban Land Scarcity for 1 MW+ Substations
- 4.3.3 Pantograph Interoperability Gaps (SAE J3105 Variants)
- 4.3.4 Shortage of Certified HV Installers Slows Roll-Outs
- 4.4 Value / Supply-Chain Analysis
- 4.5 Regulatory Landscape
- 4.6 Technological Outlook
- 4.7 Porter's Five Forces
- 4.7.1 Threat of New Entrants
- 4.7.2 Bargaining Power of Suppliers
- 4.7.3 Bargaining Power of Buyers
- 4.7.4 Threat of Substitutes
- 4.7.5 Industry Rivalry
5 Market Size and Growth Forecasts (Value (USD))
- 5.1 By Charger Type
- 5.1.1 Slow Charger
- 5.1.2 Fast Charger
- 5.2 By Charging Type
- 5.2.1 AC Charging
- 5.2.2 DC Charging
- 5.3 By Connector Type
- 5.3.1 CHAdeMO
- 5.3.2 Combined Charging System (CCS)
- 5.3.3 Others
- 5.4 By Level of Charging
- 5.4.1 Level 1
- 5.4.2 Level 2
- 5.4.3 Level 3
- 5.5 By Connectivity
- 5.5.1 Non-connected Stations
- 5.5.2 Connected Stations
- 5.6 By Geography
- 5.6.1 North America
- 5.6.1.1 United States
- 5.6.1.2 Canada
- 5.6.1.3 Rest of North America
- 5.6.2 South America
- 5.6.2.1 Brazil
- 5.6.2.2 Argentina
- 5.6.2.3 Rest of South America
- 5.6.3 Europe
- 5.6.3.1 United Kingdom
- 5.6.3.2 Germany
- 5.6.3.3 Spain
- 5.6.3.4 Italy
- 5.6.3.5 France
- 5.6.3.6 Russia
- 5.6.3.7 Rest of Europe
- 5.6.4 Asia-Pacific
- 5.6.4.1 India
- 5.6.4.2 China
- 5.6.4.3 Japan
- 5.6.4.4 South Korea
- 5.6.4.5 Rest of Asia-Pacific
- 5.6.5 Middle East and Africa
- 5.6.5.1 United Arab Emirates
- 5.6.5.2 Saudi Arabia
- 5.6.5.3 Turkey
- 5.6.5.4 Egypt
- 5.6.5.5 South Africa
- 5.6.5.6 Rest of Middle-East and Africa
- 5.6.1 North America
6 Competitive Landscape
- 6.1 Market Concentration
- 6.2 Strategic Moves
- 6.3 Market Share Analysis
- 6.4 Company Profiles (Includes Global Level Overview, Market Level Overview, Core Segments, Financials as Available, Strategic Information, Market Rank/Share for Key Companies, Products and Services, SWOT Analysis, and Recent Developments)
- 6.4.1 ABB Ltd.
- 6.4.2 Siemens AG
- 6.4.3 Heliox BV
- 6.4.4 ChargePoint Inc.
- 6.4.5 Proterra Inc.
- 6.4.6 Efacec Power Solutions
- 6.4.7 Kempower Oyj
- 6.4.8 Alstom SA
- 6.4.9 Schneider Electric SE
- 6.4.10 Star Charge
- 6.4.11 TGOOD Global Ltd.
- 6.4.12 Tritium DCFC Ltd.
- 6.4.13 EnBW AG
- 6.4.14 EVgo Inc.
7 Market Opportunities and Future Outlook
- 7.1 White-space and Unmet-Need Assessment


