

|
시장보고서
상품코드
2097284
생산성 앱 : 시장 점유율 분석, 업계 동향 및 통계, 성장 예측(2025-2030년)Productivity Apps - Market Share Analysis, Industry Trends & Statistics, Growth Forecasts (2025 - 2030) |
||||||
 Mordor Intelligence
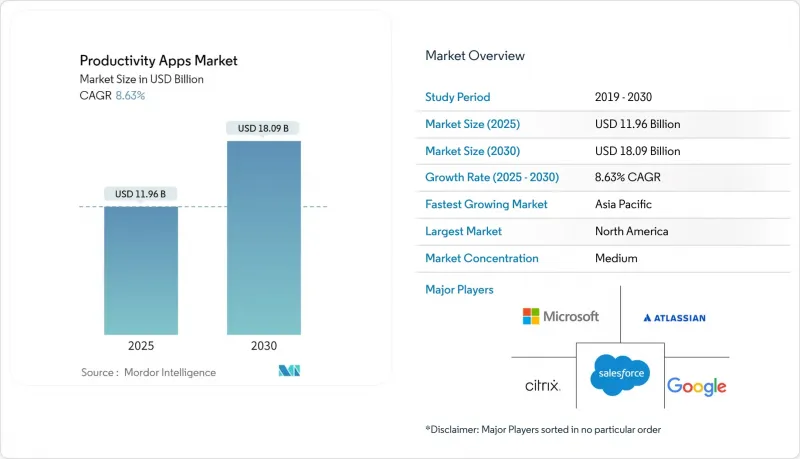
Mordor Intelligence에 의하면, 생산성 앱 시장 규모는 2025년에 119억 6,000만 달러로 평가되었습니다. 2030년까지 180억 9,000만 달러에 이를 것으로 예측되며, 2025년부터 2030년까지 연평균 복합 성장률(CAGR)은 8.63%를 나타낼 전망입니다.
본 보고서는 유형(프로젝트 관리 소프트웨어, 팀 협업 소프트웨어 등), 플랫폼(웹/데스크톱, 모바일 등), 조직 규모(대기업, 중소기업), 최종 사용자 산업(IT 및 통신, 은행, 금융서비스 및 보험(BFSI), 헬스케어 및 생명과학 등) 및 지역별로 분류되어 있습니다. 시장 전망은 금액(달러) 기준으로 제시되어 있습니다.
세계의 생산성 앱 시장 동향 및 인사이트
원격 근무 및 하이브리드 근무 모델의 확대
팬데믹 이후 국경을 초월한 온라인 업무량이 30% 증가했으며, 이는 협업에 대한 요구에 장기적인 변화가 일어나고 있음을 보여줍니다. 경영진은 사무실 출근 의무가 지속되고 있음에도 불구하고 분산 근무가 영구적인 형태가 될 것임을 점점 더 수용하고 있으며, 이에 따라 물리적 업무 공간과 가상 업무 공간을 연결하는 보안 클라우드 제품군의 도입이 지속되고 있습니다. 현재 기술 로드맵에는 비동기 메시징, 공유 캔버스, 그리고 시간대 차이로 인한 마찰을 해소하는 워크플로우 엔진 등이 포함되어 있습니다. 경쟁력을 유지하기 위해 전 세계 프리랜서에 의존하고 있는 인도 및 기타 신흥 인재 허브에서는 이러한 수요가 특히 두드러집니다. 이에 따라 기업들은 대화, 파일, 분석을 통합적으로 관리할 수 있는 ‘통합 우선’ 아키텍처를 중심으로 디지털 업무 공간을 재구축하고 있습니다.
워크플로우 효율화를 위한 AI와 자동화의 통합
2028년까지 업무용 용도의 20% 이상이 AI 기반 개인화 기능을 탑재할 것으로 예상되며, 예측적 작업 자동화가 소프트웨어 선정의 핵심이 될 것입니다. ChatGPT 라이선스에 대한 기업의 지출은 전년 대비 600% 증가하며 급증하고 있으며, 이는 주류 구매자들이 시범 단계를 넘어 생성형 AI를 본격적으로 시험 도입하고 있음을 뒷받침합니다. 제조업에서는 도입 초기의 어려움이 생산성의 J-커브로 전환된 후, 처리량과 가동률이 가속화되는 성과가 나타나고 있습니다. 야후 재팬이 전 직원 1만 1,000명을 대상으로 생성형 AI 사용을 의무화한 결정은 대기업들이 시범 운영을 통해 얻은 인사이트력을 어떻게 본격적인 운영 모델로 전환하고 있는지를 여실히 보여주고 있습니다. 정책 연구자들은 또한 기업이 기술 향상과 안전한 데이터 파이프라인에 대한 투자를 동시에 진행하는 한, 노동 생산성에 긍정적인 효과가 나타날 것이라고 지적하고 있습니다.
클라우드 애플리케이션의 데이터 보안 및 개인정보 보호에 대한 우려
AI 도구와 관련된 보안 사고의 비율은 2023년 27%에서 2025년에는 40%로 급증했으며, 이는 혁신이 거버넌스를 얼마나 빠르게 앞지르고 있는지를 여실히 보여줍니다. 기밀 데이터는 현재 텍스트 생성, 요약, 검색 가능한 트랜스크립트 모듈을 통해 유통되고 있으므로, 기업은 모든 생산성 워크플로우에 제로 트러스트 원칙과 컨텐츠 필터링을 다층적으로 적용해야 합니다. 규제 대상 산업의 경우, AI 기능을本番 환경에서 가동하기 전에 HIPAA 비즈니스 어소시에이트 계약과 같은 계약상의 부대 조항이 필수적입니다. 과도한 권한이 부여된 액세스나 잘못된 정보를 생성하는 컨텐츠는 위험을 높이고, 추가적인 검토 주기를 강요하여 도입 지연을 초래합니다. 그 결과, 구매자들은 투명성이 높은 보안 로드맵이나 제3자 감사를 통한 인증을 공개하고 있는 벤더를 점점 더 선호하는 추세입니다.
부문 분석
프로젝트 관리는 2024년에도 생산성 앱 시장에서 22.5%의 점유율을 유지했으며, 이는 복잡하고 부서 간에 걸친 이니셔티브를 총괄하는 데 있어 그 확고한 역할을 반영합니다. 기업이 애자일 기법을 확대하고, 경영진용 대시보드에 정보를 제공하는 간트 차트, 칸반, 리스크 추적 기능을 요구함에 따라 수요는 계속해서 견조합니다. 그러나 조직이 수동적인 작업 기록에서 이벤트 기반 워크플로우 조정으로 전환함에 따라, 자동화 및 통합 플랫폼이 2030년까지 연평균 성장률(CAGR) 9.2%로 성장 속도를 주도하고 있습니다. 이러한 변화는 API 호출량 증가와 반복적인 작업을 봇에 맡기는 트리거 기반 규칙의 도입에서 확인할 수 있으며, 이를 통해 관리자는 보다 고차원적인 계획 수립에 집중할 수 있게 되었습니다. 채팅, 화이트보드, 프로젝트 타임라인을 융합한 협업 제품군의 보급도 확대되고 있어, 업무 수행과 커뮤니케이션 사이에 기존에 존재하던 격차를 해소해 나가고 있습니다. 메모 도구는 회의 결과를 요약하고 재사용 가능한 개요을 추출하는 AI 기반 지식베이스로 진화하여, 검색의 번거로움을 줄여주고 있습니다. 현재 20만 개사의 고객에게 서비스를 제공하고 있는 Miro와 같은 디지털 화이트보드는 시각적인 캔버스가 가상 회의로 인해 발생한 창의성의 격차를 메우는 좋은 사례입니다. 웰빙에 대한 노력과 디지털 과부하를 줄이기 위한 정책적 압력에 힘입어, 집중력 관리 앱도 계속해서 등장하고 있습니다. 이러한 동향들이 맞물리면서, 구조화된 프로젝트 거버넌스와 워크플로우를 실시간으로 조정하는 경량 자동화 레이어가 공존하는 이중 구조 시장이 강화되고 있습니다.
2024년에도 웹/데스크톱 배포는 생산성 앱 시장 가치의 66.5%를 차지했습니다. 이는 기업들이 기존부터 자사의 ID 스택과 통합된 브라우저 중심의 제품군을 표준화해 왔기 때문입니다. 그러나 직원들이 하루에 약 150회 스마트폰을 확인한다는 사실을 배경으로, 모바일 도입은 2030년까지 연평균 성장률(CAGR) 10.0%로 가속화되고 있습니다. 현장 직원과 관리직 모두 기기 간에 동등한 기능을 기대하게 되면서, 모빌리티는 단순한 편의성을 넘어 필수 불가결한 요소로 변화했습니다. 로우코드를 통한 신속한 모바일 개발은 해당 분야의 전문가가 Objective-C나 Kotlin에 대한 전문 지식이 없어도 마이크로 앱을 구축할 수 있게 함으로써 인력 부족 문제를 해소합니다. 브라우저 확장 기능과 프로그레시브 웹 앱은 경계를 더욱 모호하게 만들어, 지식 근로자가 맥락을 잃지 않고 노트북, 태블릿, 스마트폰 간에 세션을 재개할 수 있게 해줍니다. 성장이 지속되는 한편, 모바일 분야에는 연속적인 화상 통화로 인한 배터리 소모나, 개인 기기에서 기업의 보안 기준을 충족하는 컨테이너화된 데이터 모델의 필요성 같은 과제도 존재합니다. 적응형 레이아웃, 오프라인 편집, 생체 인증을 통한 로그인을 제공하는 벤더야말로 이러한 성장의 물결을 포착하는 데 가장 유리한 위치에 있습니다. 한편, 크로스 플랫폼 SDK를 통해 단일 코드베이스로 다양한 폼 팩터를 지원할 수 있게 되어, 출시 주기 단축과 파편화 완화가 도모됩니다.
지역별 분석
북미는 성숙한 클라우드 인프라, 지속적인 혁신에 대한 자금 투자, 그리고 높은 1인당 라이선스 수 덕분에 2024년 전 세계 지출의 38.1%를 차지했습니다. 미국의 다국적 기업들은 AI 코파일럿 및 로우코드 자동화 도입을 주도하고 있으며, 이를 활용하여 방대하게 확장된 용도 포트폴리오를 합리화하고 있습니다. 캐나다는 중소기업의 디지털 전환을 지원하는 연방 정부 프로그램을 통해 이에 발맞추고 있으며, 멕시코는 국경을 넘는 프로젝트 조정이 필요한 니어쇼어링 동향으로부터 혜택을 받고 있습니다. 대기업이 주축이 되는 통신 모듈 부문이 포화 상태에 가까워지고, 통합의 품질과 보안 체계에 주력하게 됨에 따라 성장은 소폭 둔화되고 있습니다. 또한, AI를 통한 컨텐츠 생성에 대한 규제 당국의 감시도, 특히 의료 및 공공 부문 고객들 사이에서 생성형 기능 도입을 신중하게 만드는 요인이 되고 있습니다.
아시아태평양은 인구 규모, 스마트폰의 급속한 보급, 그리고 정부의 적극적인 디지털화 정책에 힘입어 2025-2030년 연평균 성장률(CAGR) 9.6%라는 가장 빠른 성장세를 기록하고 있습니다. 인도와 인도네시아는 클라우드 협업이 IT 서비스 및 백오피스 업무 아웃소싱을 제공하는 기업을 어떻게 강화하고 있는지를 보여주고 있습니다. 중국의 제조업체들은 생산성 대시보드를 MES 및 ERP와 통합하여 스마트 팩토리 목표 달성을 가속화하고 있습니다. 한편, 일본의 서비스 기업들은 야후 재팬의 전 직원에 대한 의무화 조치와 같이 생성형 AI 활용 지침을 공식적으로 수립하고 있습니다. 그 결과, 국내 SaaS 제공업체와 세계 기업이 공존하는 다층적인 시장이 형성되고 있으며, 각 기업은 현지 언어, 규정 준수, 결제 선호도에 맞추어 서비스를 맞춤화하고 있습니다. 투자자들은 특정 분야에 특화된 스타트업에 자금을 투입하고 있으며, 이로 인해 기업 구매자를 위한 소프트웨어 선택의 폭이 더욱 넓어지고 있습니다.
유럽은 큰 비즈니스 기회를 품고 있지만, 디지털 전환(DX) 프로젝트 중 목표 기능을 완전히 구현한 사례는 고작 15%에 그치고 있어 그 진전은 더딘 임베디드니다. 기업들은 도입이 성숙 단계에 이르면 생산성이 38% 향상될 것으로 기대하고 있지만, 주요 장애 요인으로 기술 인력 부족과 규제 체계의 불균일성을 꼽고 있습니다. 그럼에도 불구하고 유럽연합(EU)에서는 2019년 이후 디지털 소비자가 1억 명 증가하여 하류 수요 증가세를 보여주고 있습니다. 북유럽 국가 및 베네룩스 국가들은 AI 기반 자동화 도입에서 다른 지역을 앞서는 실적을 보이고 있지만, 남유럽 국가들은 기업의 평균 규모가 작고 IT 예산도 제한적이어서 도입이 지연되고 있습니다. 주요 지역 외에도 남미와 중동 및 아프리카는 신흥 시장으로 주목받고 있으며, 광섬유 연결 환경의 개선과 클라우드 데이터센터 개설로 인해 도입 장벽이 점차 낮아지고 있습니다. 이에 따라 현지 상황에 맞춘 가격 책정 및 지원을 제공할 수 있는 벤더에게는 장기적인 호재가 될 것입니다.
기타 혜택 :
- 엑셀 형식 시장 예측(ME) 시트
- 3개월간의 애널리스트 지원
자주 묻는 질문
목차
제1장 서론
제2장 조사 방법
제3장 주요 요약
제4장 시장 구도
제5장 시장 규모 및 성장 예측
제6장 경쟁 구도
제7장 시장 기회 및 향후 전망
KTH 26.08.05According to Mordor Intelligence, the productivity apps market size stands at USD 11.96 billion in 2025 and is forecast to reach USD 18.09 billion by 2030, translating into an 8.63% CAGR during 2025-2030.
This report is Segmented by Type (Project Management Software, Team Collaboration Software, and More), Platform (Web/Desktop, Mobile, and More), Organization Size (Large Enterprises, and SMEs), End-User Industry (IT and Telecom, BFSI, Healthcare and Life Sciences, and More), and Geography. The Market Forecasts are Provided in Terms of Value (USD).
Global Productivity Apps Market Trends and Insights
Rising Remote and Hybrid Work Models
Cross-border online work volumes have climbed 30% since the pandemic, signalling a long-term step-change in collaboration needs. Executives increasingly accept that distributed work is permanent even while office mandates persist, which sustains procurement of secure cloud suites that bridge physical and virtual workspaces. Technology roadmaps now include asynchronous messaging, shared canvases and workflow engines that remove time-zone friction. Demand is particularly pronounced across India and other emerging talent hubs that rely on global freelancing to remain competitive. Enterprises therefore continue to rebuild digital workplaces around integration-first architectures that can orchestrate conversations, files and analytics.
Integration of AI and Automation for Workflow Efficiency
More than 20% of workplace applications are expected to embed AI-driven personalisation by 2028, putting predictive task automation at the heart of software selection. Enterprise spending on ChatGPT licences ballooned 600% year-on-year, confirming that mainstream buyers now test generative AI beyond pilots. Manufacturers illustrate the payoff, where early rollout pain gives way to a productivity J-curve that later accelerates throughput and uptime. Yahoo Japan's decision to mandate generative AI for all 11,000 employees underscores how large organisations convert pilot learnings into full-scale operating models. Policy researchers also observe positive labour-productivity effects provided firms invest simultaneously in upskilling and secure data pipelines.
Data Security and Privacy Concerns in Cloud Apps
The share of security incidents linked to AI tools jumped to 40% in 2025 from 27% in 2023, underscoring how fast innovation outpaces governance. Firms must layer zero-trust principles and content-filtering over every productivity workflow because sensitive data now travels through text generation, summarisation and searchable transcript modules. For regulated industries, contractual addenda such as HIPAA Business Associate Agreements become mandatory before AI features can go live. Over-permissioned access and hallucinated content heighten risk, forcing additional review cycles that slow roll-outs. Consequently, buyers increasingly favour vendors that publish transparent security roadmaps and third-party audit attestations.
Other drivers and restraints analyzed in the detailed report include:
- No-code/Low-code Extensibility Marketplaces
- Proliferation of Cloud Computing and SaaS Delivery
- Digital Burnout Reducing End-User Adoption
For complete list of drivers and restraints, kindly check the Table Of Contents.
Segment Analysis
Project management maintained a 22.5% productivity apps market share in 2024, reflecting its entrenched role in orchestrating complex, cross-functional initiatives. Demand remains buoyant as enterprises scale agile practices and require Gantt, Kanban and risk-tracking features that feed executive dashboards. Nonetheless, automation & integration platforms are setting the growth pace with a 9.2% CAGR to 2030 as organisations pivot from manual task capture to event-driven workflow orchestration. The shift is visible in rising API call volumes and adoption of trigger-based rules that hand off repetitive actions to bots, freeing managers for higher-order planning. Collaboration suites that blend chat, whiteboarding and project timelines also gain traction, eroding the legacy divide between work execution and communication. Note-taking tools evolve toward AI-powered knowledge bases that summarise meeting outcomes and surface reusable snippets, lowering search friction. Digital whiteboards such as Miro - now serving 200,000 customers - exemplify how visual canvases fill the creativity gap left by virtual meetings. Focus-management apps continue to emerge, driven by wellbeing initiatives and policy pressure to mitigate digital overload. Collectively, these dynamics reinforce a dual-track market in which structured project governance coexists with lightweight automation layers that adapt workflows in real time.
Web/desktop deployments still capture 66.5% of productivity apps market value in 2024 because enterprises historically standardised on browser-centric suites that integrate with corporate identity stacks. Yet mobile installations are accelerating at 10.0% CAGR through 2030, buoyed by the fact that employees pick up their phones roughly 150 times per day. Mobility has shifted from mere convenience to necessity as frontline staff and managers alike expect parity of features across devices. Low-code rapid-mobile development fills talent shortages by letting domain specialists assemble micro-apps without Objective-C or Kotlin expertise. Browser extensions and progressive web apps further blur boundaries, letting knowledge workers resume sessions across laptop, tablet and smartphone without losing context. Despite growth, mobile faces challenges such as battery drain from continuous video calls and the need for containerised data models that meet enterprise security standards on personal devices. Vendors that provide adaptive layouts, offline editing and biometric sign-on are best positioned to capture the upswing. Meanwhile, cross-platform SDKs ensure that a single codebase can target multiple form factors, shortening release cycles and reducing fragmentation.
Complete Report Scope:
- By Type
- Project Management Software
- Team Collaboration Software
- Note-Taking and Documentation
- Time Tracking and Scheduling
- Focus and Distraction Management Tools
- Automation and Integration Platforms
- Digital Whiteboarding
- Other Types
- By Platform
- Web / Desktop
- Mobile (iOS and Android)
- Cross-platform / Browser Extensions
- By Organization Size
- Large Enterprises
- Small and Medium Enterprises (SMEs)
- By End-User Industry
- IT and Telecom
- BFSI
- Healthcare and Life Sciences
- Education
- Manufacturing
- Retail and E-commerce
- Media and Entertainment
- Government and Public Sector
- Other End-User Industries
- By Geography
- North America
- United States
- Canada
- Mexico
- Europe
- Germany
- United Kingdom
- France
- Italy
- Spain
- Rest of Europe
- Asia-Pacific
- China
- Japan
- India
- South Korea
- Australia
- Rest of Asia-Pacific
- South America
- Brazil
- Argentina
- Rest of South America
- Middle East and Africa
- Saudi Arabia
- United Arab Emirates
- South Africa
- Egypt
- Rest of Middle East and Africa
- North America
Geography Analysis
North America preserved 38.1% of global spending in 2024 because of mature cloud infrastructure, continuous innovation funding and high per-capita licence counts. United States multinationals lead adoption of AI copilots and low-code automation, using them to rationalise sprawling application portfolios. Canada follows through federal programmes that subsidise SME digitisation, while Mexico benefits from near-shoring trends that require cross-border project orchestration. Growth moderates slightly as large enterprises approach saturation in core communication modules and turn their focus to integration quality and security posture. Regulatory scrutiny of AI content generation also drives cautious rollout of generative features, particularly in healthcare and public-sector accounts.
Asia-Pacific registers the fastest expansion at 9.6% CAGR for 2025-2030, fuelled by demographic scale, rapid smartphone penetration and aggressive government digital agendas. India and Indonesia illustrate how cloud collaboration empowers exporters of IT services and back-office process outsourcing. Chinese manufacturers integrate productivity dashboards with MES and ERP to accelerate smart-factory goals, while Japan's service companies formalise generative-AI playbooks like Yahoo Japan's all-employee mandate. The result is a layered market where home-grown SaaS providers co-exist with global entrants, each tailoring offerings to local language, compliance and payment preferences. Investors inject capital into vertical-specialist start-ups, further broadening software choice for enterprise buyers.
Europe contributes a sizeable opportunity base yet realises a slower trajectory because only 15% of digital-transformation projects have fully implemented target capabilities. Enterprises expect a 38% productivity lift once rollouts mature but cite skills shortages and fragmented regulatory regimes as chief obstacles. The bloc nevertheless reports 100 million additional digital consumers since 2019, signalling downstream demand. Nordic and Benelux countries outperform on uptake of AI-driven automation, whereas Southern Europe lags due to smaller average company size and constrained IT budgets. Beyond the core regions, South America and the Middle East & Africa constitute emerging frontiers where improved fibre connectivity and cloud data-centre launches gradually lower adoption barriers, creating long-run tailwinds for vendors able to localise pricing and support.
- Microsoft Corporation
- Google LLC
- Atlassian Corporation PLC
- Salesforce Inc. (Slack)
- Zoom Video Communications Inc.
- Asana Inc.
- Monday.com Ltd.
- Smartsheet Inc.
- Trello, Inc.
- Notion Labs Inc.
- Evernote Corporation
- Doist Ltd. (Todoist)
- Mango Technologies, Inc. (ClickUp)
- Zoho Corporation
- Basecamp LLC
- Dropbox Inc.
- Formagrid, Inc. (Airtable)
- TeamViewer AG
- Citrix Systems Inc. (GoTo)
- ProofHub LLC
Additional Benefits:
- The market estimate (ME) sheet in Excel format
- 3 months of analyst support
TABLE OF CONTENTS
1 INTRODUCTION
- 1.1 Study Assumptions and Market Definition
- 1.2 Scope of the Study
2 RESEARCH METHODOLOGY
3 EXECUTIVE SUMMARY
4 MARKET LANDSCAPE
- 4.1 Market Overview
- 4.2 Market Drivers
- 4.2.1 Rising remote and hybrid work models
- 4.2.2 Proliferation of cloud computing and SaaS delivery
- 4.2.3 Integration of AI and automation for workflow efficiency
- 4.2.4 Demand for cross-platform collaboration suites
- 4.2.5 No-code/low-code extensibility marketplaces
- 4.2.6 Digital well-being metrics boosting focus-oriented apps
- 4.3 Market Restraints
- 4.3.1 Data security and privacy concerns in cloud apps
- 4.3.2 Subscription fatigue and cost sensitivity among SMEs
- 4.3.3 API rate-limit and interoperability challenges
- 4.3.4 Digital burnout reducing end-user adoption
- 4.4 Industry Value Chain Analysis
- 4.5 Technological Outlook
- 4.6 Porter's Five Forces Analysis
- 4.6.1 Threat of New Entrants
- 4.6.2 Bargaining Power of Suppliers
- 4.6.3 Bargaining Power of Buyers
- 4.6.4 Threat of Substitutes
- 4.6.5 Competitive Rivalry
5 MARKET SIZE AND GROWTH FORECASTS (VALUE)
- 5.1 By Type
- 5.1.1 Project Management Software
- 5.1.2 Team Collaboration Software
- 5.1.3 Note-Taking and Documentation
- 5.1.4 Time Tracking and Scheduling
- 5.1.5 Focus and Distraction Management Tools
- 5.1.6 Automation and Integration Platforms
- 5.1.7 Digital Whiteboarding
- 5.1.8 Other Types
- 5.2 By Platform
- 5.2.1 Web / Desktop
- 5.2.2 Mobile (iOS and Android)
- 5.2.3 Cross-platform / Browser Extensions
- 5.3 By Organization Size
- 5.3.1 Large Enterprises
- 5.3.2 Small and Medium Enterprises (SMEs)
- 5.4 By End-User Industry
- 5.4.1 IT and Telecom
- 5.4.2 BFSI
- 5.4.3 Healthcare and Life Sciences
- 5.4.4 Education
- 5.4.5 Manufacturing
- 5.4.6 Retail and E-commerce
- 5.4.7 Media and Entertainment
- 5.4.8 Government and Public Sector
- 5.4.9 Other End-User Industries
- 5.5 By Geography
- 5.5.1 North America
- 5.5.1.1 United States
- 5.5.1.2 Canada
- 5.5.1.3 Mexico
- 5.5.2 Europe
- 5.5.2.1 Germany
- 5.5.2.2 United Kingdom
- 5.5.2.3 France
- 5.5.2.4 Italy
- 5.5.2.5 Spain
- 5.5.2.6 Rest of Europe
- 5.5.3 Asia-Pacific
- 5.5.3.1 China
- 5.5.3.2 Japan
- 5.5.3.3 India
- 5.5.3.4 South Korea
- 5.5.3.5 Australia
- 5.5.3.6 Rest of Asia-Pacific
- 5.5.4 South America
- 5.5.4.1 Brazil
- 5.5.4.2 Argentina
- 5.5.4.3 Rest of South America
- 5.5.5 Middle East and Africa
- 5.5.5.1 Saudi Arabia
- 5.5.5.2 United Arab Emirates
- 5.5.5.3 South Africa
- 5.5.5.4 Egypt
- 5.5.5.5 Rest of Middle East and Africa
- 5.5.1 North America
6 COMPETITIVE LANDSCAPE
- 6.1 Market Concentration
- 6.2 Strategic Moves
- 6.3 Market Share Analysis
- 6.4 Company Profiles (includes Global level Overview, Market level overview, Core Segments, Financials as available, Strategic Information, Market Rank/Share for key companies, Products and Services, and Recent Developments)
- 6.4.1 Microsoft Corporation
- 6.4.2 Google LLC
- 6.4.3 Atlassian Corporation PLC
- 6.4.4 Salesforce Inc. (Slack)
- 6.4.5 Zoom Video Communications Inc.
- 6.4.6 Asana Inc.
- 6.4.7 Monday.com Ltd.
- 6.4.8 Smartsheet Inc.
- 6.4.9 Trello, Inc.
- 6.4.10 Notion Labs Inc.
- 6.4.11 Evernote Corporation
- 6.4.12 Doist Ltd. (Todoist)
- 6.4.13 Mango Technologies, Inc. (ClickUp)
- 6.4.14 Zoho Corporation
- 6.4.15 Basecamp LLC
- 6.4.16 Dropbox Inc.
- 6.4.17 Formagrid, Inc. (Airtable)
- 6.4.18 TeamViewer AG
- 6.4.19 Citrix Systems Inc. (GoTo)
- 6.4.20 ProofHub LLC
7 MARKET OPPORTUNITIES AND FUTURE OUTLOOK
- 7.1 White Space and Unmet Need Assessment


