|
시장보고서
상품코드
2097337
파워 디바이스 애널라이저 : 시장 점유율 분석, 업계 동향 및 통계, 성장 예측(2026-2031년)Power Device Analyzer - Market Share Analysis, Industry Trends & Statistics, Growth Forecasts (2026 - 2031) |
||||||
 Mordor Intelligence
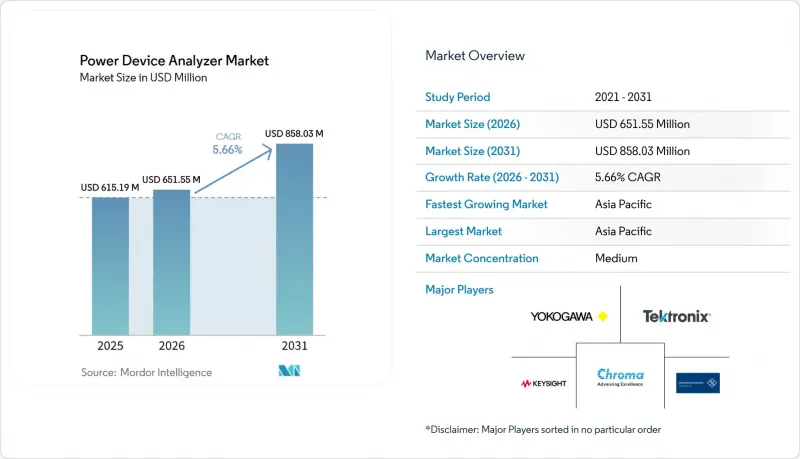
Mordor Intelligence에 의하면, 파워 디바이스 애널라이저 시장 규모는 2025년 6억 1,519만 달러로 평가되었습니다. 2026년 6억 5,155만 달러에서 2031년까지 8억 5,803만 달러로 확대되고 2026년부터 2031년까지 연평균 복합 성장률(CAGR)은 5.66%를 나타낼 전망입니다.
본 보고서는 유형별(AC 파워 애널라이저, DC 파워 애널라이저, AC·DC 겸용), 용도별(자동차, 에너지 및 전력, 소비자용 전자기기, 통신, 의료기기, 산업용 자동화, 기타), 지역별(북미, 유럽, 아시아태평양, 남미, 중동 및 아프리카)로 분류되어 있습니다. 시장 규모 및 전망은 금액(달러)으로 표시되어 있습니다.
세계의 파워 디바이스 애널라이저 시장 동향 및 인사이트
EV용 파워 일렉트로닉스의 급성장
자동차용 트랙션 인버터, 차량용 충전기 및 DC-DC 컨버터는 800V로의 전환이 진행 중이며, 1,200V 스택에 대한 시험도 이루어지고 있어, 1,700V 및 250A를 초과하는 전압·전류를 공급·측정하면서 나노초 단위의 스위칭 에지를 분석할 수 있는 분석기가 요구되고 있습니다. 실리콘 카바이드(SiC) MOSFET는 현재 및 미래 자동차 설계 채택의 대부분을 차지하고 있으며, 최대 200°C의 접합부 온도에서 동작하기 때문에 서브 나노초 수준의 타이밍 분해능과 동기화된 열 과도 현상의 포착이 기본 요건이 되고 있습니다. 웨이퍼의 대량 생산이 200 mm로 전환됨에 따라, 1볼당 다이 수가 두 배로 증가하고 있어, 번인 오븐 및 병렬 테스트 사이트의 규모 확대가 요구되고 있습니다. Cohu사의 ‘Neon’ 캐리어와 같은 생산 시스템은 디바이스 1개당 2,500V의 스트레스를 가하고 3kW의 열을 방출할 수 있으며, 이는 분석기 출하 대수 증가에 직접 기여하는 처리량 수요를 반영하고 있습니다. 전기차 판매 대수가 증가함에 따라, 파워 디바이스 애널라이저 시장은 아시아, 유럽, 미국에서의 고전압·대전류 테스트 셀 수주 잔고의 혜택을 받고 있습니다.
재생에너지 설비 용량 확대
태양광 발전 및 풍력 발전의 급속한 확대에 따라, 전력 사업자는 IEEE 1547-2018의 계통 연계 요건에 따라 양방향 전력 흐름, 플리커 및 인터하모닉스를 모니터링해야 합니다. 배터리 에너지 저장 시스템(BESS)의 도입으로 인해 상황은 더욱 복잡해지고 있습니다. 이는 분석기가 UL 9540 인증을 위한 데이터 기록을 수행하는 동시에, 충방전 사이클 중에도 정확도를 유지해야 하기 때문입니다. 2050년 탄소 중립 목표를 내건 유럽의 계통 운영 사업자들은 분산형 발전 설비, 인버터 및 유연 부하를 실시간으로 모니터링하기 위해 채널 수가 많은 분석기에 투자하고 있으며, 클라우드 지원 및 사이버 보안 대책이 강화된 계측 기기에 대한 수요가 증가하고 있습니다.
분석기의 높은 초기 비용
키사이트나 요코가와 전기의 고성능 8채널 솔루션은 10만 달러를 초과하기 때문에 중소규모 전자기기 제조업체에게는 도입이 어렵습니다. 리스 모델은 초기 투자를 경감시켜 주지만, 맞춤 설정이나 데이터 소유권에 제한이 부과되는 경우가 많아 독자적인 알고리즘 개발을 저해하고 있습니다. 일부 OEM 제조업체는 오실로스코프를 수학적 연산 기반의 전력 모듈로 대체하려고 시도하고 있지만, 저역률 시 정확도의 한계로 인해 규정 준수상의 위험에 노출되어 이러한 대체 수단의 도입이 지연되고 있습니다.
부문 분석
2025년 기준, 듀얼 모드 AC/DC 계측기는 파워 디바이스 애널라이저 시장 점유율의 68.3%를 차지했습니다. 2031년까지 연평균 성장률(CAGR)이 6.0%인 것은 사용자가 그리드 입력, 배터리 저장, 양방향 부하를 모두 아우르는 단일 플랫폼을 선호하는 경향을 반영합니다. 엔지니어들이 개별 AC 및 DC 측정 벤치를 기업의 에너지 회수 목표도 충족하는 회생 시스템으로 대체해 나감에 따라, 이 부문 시장 규모는 꾸준히 확대될 것으로 예측됩니다.
이러한 추세는 랙 공간을 늘리지 않고도 전압을 최대 4 kV, 전류를 250 A 이상으로 확장할 수 있는 모듈식 플러그인을 제공하는 벤더에게 유리하게 작용합니다. 키사이트의 12 kW RP5900 전원 공급 장치와 요코가와 전기의 720301 모듈은 모두 밀리초 단위로 측정 범위를 전환할 수 있는 소프트웨어 정의형 설정으로의 전환을 상징합니다. DC 전용 분석기는 배터리 사이클러나 태양광 발전 연구실에서 여전히 필수적이지만, 이러한 용도에서도 엔지니어들은 안티-아이랜딩 알고리즘을 검증하기 위해 AC 에뮬레이션을 점점 더 필요로 하고 있어, 파워 디바이스 애널라이저 시장에서 듀얼 모드 설계의 점유율이 더욱 확대될 것으로 시사됩니다.
지역별 분석
2024년, 아시아태평양은 35.4%의 점유율로 파워 디바이스 애널라이저 시장을 주도했으며, 2030년까지 연평균 성장률(CAGR) 6.3%라는 견실한 성장세를 기록했습니다. 중국의 3세대 반도체 전략 기금이나 인도의 전자기기 생산 연계 인센티브 제도(PLI)와 같은 정부 지원책이 팹 확장, 전기차(EV) 부품 검증, 가전제품 효율 시험을 위한 분석기 조달을 뒷받침하고 있습니다. 일본과 한국은 자동차용 전자기기 및 메모리 팹에 대한 투자를 확대하고 있으며, 현지 계측 생태계를 활용하여 수출 경쟁력을 유지하고 있습니다.
북미에서는 첨단 전기차 개발, 항공우주 분야의 전기화, 그리고 ‘CHIPS 법’에 따른 자금 지원을 받은 팹 프로젝트 덕분에 높은 평균 판매 가격이 유지되고 있습니다. 각 OEM 업체들은 OSHA 및 NFPA 70E 안전 프로토콜을 충족하는 분석기를 필요로 하고 있으며, 이에 따라 절연형 고대역폭 프로브의 채택이 활발해지고 있습니다. 전력 회사는 재생에너지의 통합을 모니터링하고, FERC가 의무화한 전력 품질 지표를 검증하기 위해 클래스 A 휴대용 분석기에 투자하고 있으며, 이것이 교체 수요의 기반이 되고 있습니다.
유럽에서는 엄격한 환경 규제와 재생에너지의 급속한 도입으로 인해 분산형 발전의 보급률이 높은 상황에서 에너지 흐름의 역전을 포착할 수 있는 분석기로의 업그레이드가 촉진되고 있습니다. 독일의 인버터 제조업체들은 현재 전력 회사의 인증 절차를 효율화하기 위해 실증 실험 시설에 클라우드 지원 분석기를 번들로 제공합니다. 스칸디나비아의 전력 회사들은 광역 고조파 기록 네트워크의 시범 운영을 진행 중이며, GPS 동기화를 통한 이벤트 상관 기능을 갖춘 랙 마운트형 분석기의 수주를 주도하고 있습니다. 중동 및 아프리카에서는 태양광 발전 용량이 증가하고 산업 다각화가 진행되고 있으나, 현지 서비스 지원이 제한적이어서 분석기에 대한 기기 교체 주기는 여전히 긴 임베디드니다. 남미에서는 자동차 및 가전제품의 현지 조립이 진행되고 있으며, 환율 변동이 있는 상황에서도 계측 기기 수요는 견조하면서도 완만한 수준을 유지하고 있습니다.
기타 혜택 :
- 엑셀 형식 시장 예측(ME) 시트
- 3개월간의 애널리스트 지원
자주 묻는 질문
목차
제1장 서론
제2장 조사 방법
제3장 주요 요약
제4장 시장 구도
제5장 시장 규모 및 성장 예측
제6장 경쟁 구도
제7장 시장 기회 및 향후 전망
KTH 26.08.05According to Mordor Intelligence, the power device analyzer market size is projected to expand from USD 615.19 million in 2025 and USD 651.55 million in 2026 to USD 858.03 million by 2031, registering a CAGR of 5.66% between 2026 to 2031.
This report is Segmented by Type (AC Power Analyzers, DC Power Analyzers, and Both AC and DC), Application (Automotive, Energy and Power, Consumer Electronics, Telecommunications, Healthcare Devices, Industrial Automation, and Others), and Geography (North America, Europe, Asia-Pacific, South America, and Middle East and Africa). The Market Sizes and Forecasts are Provided in Terms of Value (USD).
Global Power Device Analyzer Market Trends and Insights
EV Power-Electronics Boom
Automotive traction inverters, onboard chargers, and DC-DC converters are transitioning to 800 V and trialing 1,200 V stacks, requiring analyzers that source and measure beyond 1,700 V and 250 A while resolving nanosecond switching edges. Silicon-carbide MOSFETs now account for a majority of future automotive design wins, operating at junction temperatures up to 200 °C, making sub-nanosecond timing resolution and synchronized thermal-transient capture baseline requirements. High-volume wafer production moving to 200 mm is doubling die counts per boule, driving demand for larger fleets of burn-in ovens and parallel test sites. Production systems such as Cohu's Neon carrier can stress 2,500 V per device and dissipate 3 kW of heat, reflecting throughput demands that directly contribute to higher analyzer shipments. As electric vehicle unit sales grow, the power device analyzer market is benefiting from backlog orders for high-voltage, high-current test cells across Asia, Europe, and the United States.
Renewable-Energy Capacity Expansion
Rapid solar and wind build-outs compel utilities to monitor bidirectional power flow, flicker, and inter-harmonics under IEEE 1547-2018 grid-interconnection mandates. Battery energy storage systems add further complexity because analyzers must maintain accuracy during charge and discharge cycles while logging data for UL 9540 certification. European grid operators, guided by the 2050 carbon-neutral target, invest in high-channel-count analyzers to supervise distributed generators, inverters, and flexible loads in real time, elevating demand for cloud-enabled, cybersecurity-hardened instruments.
High Upfront Analyzer Cost
High-end, eight-channel solutions from Keysight or Yokogawa exceed USD 100,000, limiting access for small and mid-sized electronics firms. Leasing models reduce capital outlay but often restrict customization or data ownership, impeding proprietary algorithm development. Some OEMs attempt to substitute oscilloscopes with math-based power modules; however, accuracy limitations at low power factors expose them to compliance risks, slowing adoption of such substitutes.
Other drivers and restraints analyzed in the detailed report include:
- Efficiency Push in Consumer Electronics
- Wide-Bandgap (SiC / GaN) Adoption
- Scarcity of Skilled Test Engineers
For complete list of drivers and restraints, kindly check the Table Of Contents.
Segment Analysis
Dual-mode AC/DC instruments held 68.3% of the power device analyzer market share in 2025. Their 6.0% CAGR through 2031 reflects user preference for a single platform that covers grid input, battery storage, and bidirectional loads. The market size for this segment is projected to grow steadily as engineers replace separate AC and DC benches with regenerative systems that also meet corporate energy-recovery goals.
This trend benefits vendors offering modular plug-ins that scale voltage up to 4 kV and current above 250 A without increasing rack space. Keysight's 12 kW RP5900 supply and Yokogawa's 720301 module both illustrate the shift toward software-defined setups that switch measurement ranges within milliseconds. DC-only analyzers remain essential in battery cyclers and photovoltaic labs, but even in these applications, engineers increasingly require AC emulation to verify anti-islanding algorithms, suggesting further share gains for dual-mode designs within the power device analyzer market.
Complete Report Scope:
- By Type
- AC Power Analyzers
- DC Power Analyzers
- Both AC and DC
- By Application
- Automotive
- Energy and Power
- Consumer Electronics
- Telecommunications
- Healthcare Devices
- Industrial Automation
- Others
- By Geography
- North America
- United States
- Canada
- Mexico
- Europe
- Germany
- United Kingdom
- France
- Italy
- NORDIC Countries
- Russia
- Rest of Europe
- Asia-Pacific
- China
- India
- Japan
- South Korea
- ASEAN Countries
- Rest of Asia-Pacific
- South America
- Brazil
- Argentina
- Rest of South America
- Middle East and Africa
- Saudi Arabia
- United Arab Emirates
- South Africa
- Egypt
- Rest of Middle East and Africa
- North America
Geography Analysis
Asia-Pacific led the power device analyzer market in 2024 with a 35.4% share and is projected to log a robust 6.3% CAGR to 2030. Government incentives, such as China's strategic fund for third-generation semiconductors and India's Production Linked Incentive scheme for electronics, stimulate analyzer procurement across fab expansion, EV component validation, and appliance efficiency testing. Japan and South Korea extend spending in automotive electronics and memory fabs, leveraging local metrology ecosystems to maintain export competitiveness.
North America commands high average selling prices owing to advanced EV development, aerospace electrification, and CHIPS Act-funded fab projects. OEMs require analyzers that satisfy OSHA and NFPA 70E safety protocols, leading to strong adoption of isolated high-bandwidth probes. Utilities invest in Class A portable analyzers to monitor renewable integration and to validate FERC-mandated power-quality indices, anchoring replacement demand.
Europe's stringent environmental regulations and rapid renewable rollout fuel analyzer upgrades that capture energy-direction reversals under high distributed-generation penetration. Germany's inverter manufacturers now bundle cloud-ready analyzers in demonstration labs to streamline utility certification. Scandinavian utilities pilot wide-area harmonic-logging networks, driving orders for rack-mount analyzers with GPS-synced event correlation. The Middle East and Africa witness rising solar capacity and industrial diversification; however, analyst replacement cycles remain longer due to limited local service support. South America sees localized automotive and appliance assembly, sustaining steady but moderate instrument demand amid currency volatility.
- Aplab Limited
- B&K Precision Corporation
- Chroma ATE Inc.
- Dewesoft d.o.o.
- Fluke Corporation
- GW Instek (Good Will Instrument Co., Ltd.)
- Hioki E.E. Corporation
- Iwatsu Electric Co., Ltd.
- Keysight Technologies, Inc.
- Magna-Power Electronics, Inc.
- National Instruments Corporation
- NH Research, Inc.
- Newtons4th Ltd.
- Omicron Lab (OMICRON Lab GmbH)
- Pintek Electronics Co., Ltd.
- Rigol Technologies Co., Ltd.
- Rohde & Schwarz GmbH & Co. KG
- Tektronix, Inc.
- Yokogawa Electric Corporation
- ZES Zimmer Electronic Systems GmbH
Additional Benefits:
- The market estimate (ME) sheet in Excel format
- 3 months of analyst support
TABLE OF CONTENTS
1 Introduction
- 1.1 Study Assumptions & Market Definition
- 1.2 Scope of the Study
2 Research Methodology
3 Executive Summary
4 Market Landscape
- 4.1 Market Overview
- 4.2 Market Drivers
- 4.2.1 EV power-electronics boom
- 4.2.2 Renewable-energy capacity expansion
- 4.2.3 Efficiency push in consumer electronics
- 4.2.4 Regulatory mandates on power quality
- 4.2.5 Wide-bandgap (SiC / GaN) adoption
- 4.2.6 AI-driven automated test benches
- 4.3 Market Restraints
- 4.3.1 High upfront analyzer cost
- 4.3.2 Scarcity of skilled test engineers
- 4.3.3 Precision-shunt supply bottlenecks
- 4.3.4 On-chip monitoring cannibalization
- 4.4 Supply-Chain Analysis
- 4.5 Regulatory Landscape
- 4.6 Technological Outlook
- 4.7 Porters Five Forces
- 4.7.1 Threat of New Entrants
- 4.7.2 Bargaining Power of Buyers
- 4.7.3 Bargaining Power of Suppliers
- 4.7.4 Threat of Substitutes
- 4.7.5 Competitive Rivalry
5 Market Size & Growth Forecasts
- 5.1 By Type
- 5.1.1 AC Power Analyzers
- 5.1.2 DC Power Analyzers
- 5.1.3 Both AC and DC
- 5.2 By Application
- 5.2.1 Automotive
- 5.2.2 Energy and Power
- 5.2.3 Consumer Electronics
- 5.2.4 Telecommunications
- 5.2.5 Healthcare Devices
- 5.2.6 Industrial Automation
- 5.2.7 Others
- 5.3 By Geography
- 5.3.1 North America
- 5.3.1.1 United States
- 5.3.1.2 Canada
- 5.3.1.3 Mexico
- 5.3.2 Europe
- 5.3.2.1 Germany
- 5.3.2.2 United Kingdom
- 5.3.2.3 France
- 5.3.2.4 Italy
- 5.3.2.5 NORDIC Countries
- 5.3.2.6 Russia
- 5.3.2.7 Rest of Europe
- 5.3.3 Asia-Pacific
- 5.3.3.1 China
- 5.3.3.2 India
- 5.3.3.3 Japan
- 5.3.3.4 South Korea
- 5.3.3.5 ASEAN Countries
- 5.3.3.6 Rest of Asia-Pacific
- 5.3.4 South America
- 5.3.4.1 Brazil
- 5.3.4.2 Argentina
- 5.3.4.3 Rest of South America
- 5.3.5 Middle East and Africa
- 5.3.5.1 Saudi Arabia
- 5.3.5.2 United Arab Emirates
- 5.3.5.3 South Africa
- 5.3.5.4 Egypt
- 5.3.5.5 Rest of Middle East and Africa
- 5.3.1 North America
6 Competitive Landscape
- 6.1 Market Concentration
- 6.2 Strategic Moves (M&A, Partnerships, PPAs)
- 6.3 Market Share Analysis (Market Rank/Share for key companies)
- 6.4 Company Profiles (includes Global level Overview, Market level overview, Core Segments, Financials as available, Strategic Information, Products & Services, and Recent Developments)
- 6.4.1 Aplab Limited
- 6.4.2 B&K Precision Corporation
- 6.4.3 Chroma ATE Inc.
- 6.4.4 Dewesoft d.o.o.
- 6.4.5 Fluke Corporation
- 6.4.6 GW Instek (Good Will Instrument Co., Ltd.)
- 6.4.7 Hioki E.E. Corporation
- 6.4.8 Iwatsu Electric Co., Ltd.
- 6.4.9 Keysight Technologies, Inc.
- 6.4.10 Magna-Power Electronics, Inc.
- 6.4.11 National Instruments Corporation
- 6.4.12 NH Research, Inc.
- 6.4.13 Newtons4th Ltd.
- 6.4.14 Omicron Lab (OMICRON Lab GmbH)
- 6.4.15 Pintek Electronics Co., Ltd.
- 6.4.16 Rigol Technologies Co., Ltd.
- 6.4.17 Rohde & Schwarz GmbH & Co. KG
- 6.4.18 Tektronix, Inc.
- 6.4.19 Yokogawa Electric Corporation
- 6.4.20 ZES Zimmer Electronic Systems GmbH
7 Market Opportunities & Future Outlook
- 7.1 White-space & Unmet-Need Assessment