

|
시장보고서
상품코드
2099121
의료기기용 예지보전 시장 : 점유율 분석, 업계 동향 및 통계, 성장 예측(2026-2031년)Predictive Maintenance For MedTech - Market Share Analysis, Industry Trends & Statistics, Growth Forecasts (2026 - 2031) |
||||||
 Mordor Intelligence
Mordor Intelligence에 의하면, 의료기기용 예지보전 시장은 2025년 118억 6,000만 달러, 2026년 132억 4,000만 달러에서 2031년까지 238억 7,000만 달러로 확대되어 2026년부터 2031년까지 CAGR 12.50%를 나타낼 것으로 예측됩니다.
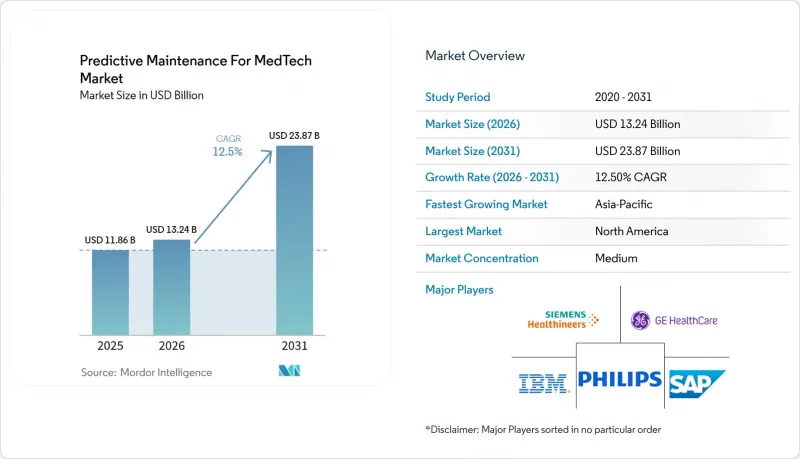
본 보고서는 구성 요소(소프트웨어, 서비스, 하드웨어), 배포 방식(클라우드 기반, On-Premise형, 하이브리드형), 조직 규모(대기업, 중소기업), 용도(영상 진단 시스템, 기타), 최종 사용자(병원, 기타), 지역(북미, 유럽, 아시아태평양, 기타)별로 분류되어 있습니다. 시장 전망은 금액(달러) 기준으로 제시되어 있습니다.
전 세계 의료기기용 예지보전 시장 동향 및 인사이트
연결형 의료기기 도입 대수 증가
의료기기용 예지보전 시장이 탄력을 얻고 있는 배경에는 커넥티드 의료기기가 개별 고장 코드가 아닌 지속적인 가동 데이터를 생성하게 된 점이 있습니다. 이를 통해 고장 감지가 더욱 정확해졌으며, 일상적인 서비스 계획 수립에 더욱 유용하게 활용되고 있습니다. 2026년에는 500병상 규모의 병원에서 15,000-2만 대의 커넥티드 의료기기가 가동될 전망이며, 이러한 규모 확대로 인해 유지보수는 단순한 기기 보수 작업에서 끊임없이 우선순위를 정해야 하는 기기 군의 관리 과제로 변화하고 있습니다. 또한, 같은 정보원에 따르면 미국 내 의료기기 기술자 공급은 예상 수요를 훨씬 밑돌고 있어 인력 부족이 추가적인 압박 요인으로 작용하고 있습니다. 이러한 상황으로 인해 일상 업무에서 예측형 자동화의 중요성이 더욱 커지고 있습니다. 조달 패턴의 변화도 도입을 뒷받침하고 있습니다. 새로운 의료기기에는 옵션 업그레이드가 아닌, 내장형 센서나 클라우드 연결 기능이 기본으로 탑재되는 사례가 늘고 있기 때문입니다. 이러한 변화로 인해 신축 병원은 기존 시설이 어쩔 수 없이 대응해야 했던 복잡한 원격 측정이나 사후 개조 프로젝트가 적고, 보다 명확한 데이터를 바탕으로 의료기기용 예지보전 시장을 더욱 견고한 기반 위에서 시작할 수 있게 됩니다.
병원 내 가동 중단 비용 증가와 서비스 수준에 대한 압박
의료기기용 예지보전 시장은 기기 고장으로 인한 직접적인 재정적 비용에 의해서도 뒷받침되고 있습니다. 병원 경영진에게 있어 이 비용을 측정하고 수익에 미치는 영향과 연결 짓는 것이 이전보다 쉬워졌습니다. 미국에서 월평균 380건의 MRI 검사를 실시하는 병원의 경우, MRI의 예기치 못한 가동 중단이 하루만 발생해도 4만 1,000달러 이상의 비용이 발생할 수 있으며, 이는 15건 이상의 스캔 예약 취소에 해당하는 손실입니다. GE 헬스케어의 보고서에 따르면, 이 회사의 'OnWatch Predict' 플랫폼은 예기치 않은 가동 중지 시간을 최대 60% 줄이고, 고객으로부터의 서비스 요청을 35% 감소시켰습니다. 그 결과, EMEA 지역에 도입된 1,500대의 MRI 시스템에서 대당 연간 2.5일분의 가동 일수가 증가했습니다. 병원 그룹이 가동률 보장을 포함한 보다 광범위한 서비스 계약을 협상함에 따라, 이 점은 더욱 중요해지고 있습니다. 가용성이 더 이상 단순한 서비스 목표로만 취급되지 않고, 계약 이행 상황과 더욱 밀접하게 연결되어 있기 때문입니다. 이러한 기대가 더 대규모의 의료 네트워크 전체로 확산됨에 따라, 의료기기 예지보전 시장은 측정 가능한 가동 시간 향상을 보여주고, 그 성과를 서비스 수준 성과로 연결할 수 있는 벤더에게 이익을 가져다줄 것입니다.
OEM 데이터에 대한 접근이 파편화되어 있으며, 상호 운용성이 제한적입니다.
의료기기용 예지보전 시장은 여전히 큰 장벽에 직면해 있습니다. 그 이유는 여러 벤더의 기기를 도입한 병원이 중립적인 분석 환경이 아닌, OEM 서비스 포털을 위해 구축된 독자적인 형식으로 텔레메트리 데이터를 수신하고 있기 때문입니다. 5개 이상의 제조업체 장비를 관리하는 병원의 경우, 장비군 전반에 걸친 모델을 실질적으로 운영하기 전에 벤더별로 개별적인 통합 작업이 필요할 수 있으며, 이로 인해 도입 기간이 길어지고 프로젝트 비용이 증가합니다. 계약상 접근이 가능하더라도 마모 카운터, 드리프트 인디케이터, 상세한 오류 이력 등 유지보수와 가장 밀접한 관련이 있는 필드가 타사 시스템에 완전한 형태로 공개되는 것은 아닙니다. HL7 FHIR R6에서는 DeviceAlert 리소스가 도입되어 표준화된 프레임워크 내에서 의료기기 경보 데이터의 공식적인 전달 경로가 확립되었지만, 대규모 레거시 의료기기 전체에 이를 적용하는 데는 시간이 걸립니다. 상호 운용성이 더욱 향상될 때까지는 의료기기 예지보전 시장에서 경쟁하는 기기 생태계 간에 데이터를 정규화해야 하는 독립 벤더보다 OEM과 연계된 솔루션이 확장하기 더 쉬운 상황이 지속될 것입니다.
부문 분석
2025년, 의료기기용 예지보전 시장에서 소프트웨어가 57.11%의 점유율을 차지했습니다. 이는 구매자들이 여전히 하드웨어 교체를 강요하지 않으면서, 이미 도입된 기기군 위에 중첩하여 활용할 수 있는 분석 레이어를 가장 중요하게 여기고 있음을 뒷받침합니다. 의료기기용 예지보전 시장에서 소프트웨어가 계속해서 매력적인 이유는 의료 기관이 정기적인 구독 모델을 통해 영상 진단, 환자 모니터링, 검사 시스템, 수액 장치에 걸쳐 단일 분석 환경을 확장할 수 있다는 점에 있습니다. 하드웨어는 게이트웨이, 엣지 노드, 연결형 센서의 표준화가 진행되면서 가격 면에서의 차별화가 약화되고 있어, 수익 구성비에서 가장 작은 비중을 차지하는 분야가 되었습니다. 의료기기용 예지보전 업계에서는 가치가 데이터를 수집하는 물리적 기기 그 자체보다 데이터의 해석 및 운영 방식으로 이동하고 있습니다.
많은 의료 기관이 사내에서 분석 역량을 처음부터 구축하기보다는 분석 관리를 외부에 위탁하는 것을 선호하기 때문에 서비스 분야는 시장 전체보다 빠르게 확대되고 있으며, 2026년부터 2031년까지 연평균 성장률(CAGR) 12.93%가 예상됩니다. 그 결과, 의료기기용 예지보전 시장에서는 서비스가 일회성 도입 작업에서 가동 시간, 개입 계획, 워크플로우 실행과 연계된 지속적인 관리형 지원으로 전환되고 있습니다. 서비스의 가치가 데이터 소유권이나 모델 성능과 연계됨에 따라, 소규모 서비스 기업의 경우 텔레메트리 접근에 관한 제휴를 맺거나 특정 기기 분류에 집중하지 않는 한, 의료기기용 예지보전 시장에 진입하기 어려워질 가능성이 있습니다.
2025년에는 클라우드 기반 도입이 시장 점유율의 58.71%를 차지했습니다. 이는 탄력적인 컴퓨팅 능력, 중앙 집중식 모델 업데이트, 그리고 자본 지출을 운영 비용으로 전환하는 구독형 가격 책정에 대한 구매자의 강한 선호도를 반영한 것입니다. 의료기기용 예지보전 시장에서는 고정밀 모델 학습을 위해 대량의 과거 기기 데이터가 필요하지만, 많은 병원 소유 시스템은 로컬 인프라에서 이를 효율적으로 처리할 수 없기 때문에 클라우드 도입이 선호되고 있습니다. 또한, 클라우드를 통한 제공을 통해 벤더는 현장별 개입을 기다릴 필요 없이 분산된 기기군 전체에 모델 개선, 소프트웨어 수정, 워크플로우 변경을 손쉽게 배포할 수 있게 됩니다.
하이브리드 아키텍처는 의료기기용 예지보전 시장에서 로컬 제어와 중앙 집중형 분석 사이에 존재하는 실질적인 격차를 해소하기 위해 연평균 성장률(CAGR) 12.86%를 나타낼 것으로 예측되며, 가장 빠르게 성장하고 있는 도입 형태입니다. 이 구성에서는 기밀성이 높거나 시간적 제약이 있는 텔레메트리 데이터를 엣지 측에서 처리하는 한편, 모델 훈련 및 기기군 전체에 대한 벤치마킹은 계속해서 클라우드상에서 실행할 수 있습니다. On-Premise형 시스템은 데이터 상주 요건이 엄격한 지역에서는 여전히 일정한 입지를 유지할 것이지만, 의료기기용 예지보전 시장에서는 로컬 처리와 클라우드 기반 학습 및 모니터링을 결합한 아키텍처로의 전환이 점점 더 가속화되고 있습니다.
지역별 분석
2025년, 북미는 의료기기용 예지보전 시장에서 49.35%의 점유율을 차지했습니다. 이는 긴밀하게 연계된 병원 인프라, 성숙한 제3자 서비스 조직, 그리고 강력한 다중 거점 조달 능력을 갖춘 의료 시스템에 힘입은 결과입니다. 미국은 여전히 주요 수익원으로 자리 잡고 있습니다. 이는 대규모 병원 네트워크가 이미 복잡한 장비군을 관리하고 있으며, 다수의 시설에 걸쳐 문서화, 가동 시간 및 유지보수 거버넌스의 표준화가 요구되고 있기 때문입니다.
유럽은 여전히 2위 지역 시장이며, 독일, 영국, 프랑스가 주요 수요 거점입니다. 이는 대규모 병원 시스템, 엄격한 거버넌스 요건, 그리고 OEM의 강력한 입지가 결합되어 있기 때문입니다. 독일이 특히 두드러지는 이유는 대학 병원 네트워크가 광범위한 다중 모달리티 장비군을 운영하고 있으며, 주요 OEM 서비스 조직과 인접해 있어 예지보전 서비스 역량에 대한 엄격한 요구 사항이 필요한 환경이 조성되어 있기 때문입니다. 지멘스 헬스인어즈는 자사의 디지털 헬스 플랫폼을 활용하여 장비 사용 현황 분석, 원격 진단, 프로토콜 최적화를 통합함으로써, 유지보수 인텔리전스가 보다 광범위한 의료 제공 소프트웨어에 얼마나 깊이 통합될 수 있는지를 보여주고 있습니다. 또한 영국, 프랑스, 이탈리아, 북유럽 국가, 폴란드, 네덜란드에서도 조달 프로그램을 통해 대규모 의료 네트워크가 보다 표준화된 장비 관리 모델로 전환됨에 따라 시장이 확대되고 있습니다.
아시아태평양은 2026년부터 2031년까지 연평균 성장률(CAGR) 14.48%를 나타낼 것으로 예측되며, 의료기기용 예지보전 시장에서 가장 빠르게 성장하는 지역 부문이 될 전망입니다. 중국, 인도, 일본, 한국에서는 정부 주도의 병원 디지털화를 통해 장비군 차원의 지능화에 필요한 데이터 기반이 구축되고 있어 새로운 수요가 창출되고 있습니다. 또한 일본에서도 성숙한 의료 시스템 속에서 유지보수 비용 절감이 필요한 반면, 의료기기의 가동률을 유지해야 한다는 압박이 커지고 있어, 이는 예지보전 서비스 도입을 뒷받침하는 강력한 근거가 되고 있습니다. 중국에서는 네트워크화된 의료기기가 더욱 엄격한 사이버 보안 및 유지보수 거버넌스 요건 하에서 운영됨에 따라 그 기세가 커지고 있으며, 이는 병원 측에 보다 공식적인 모니터링 관행의 도입을 촉진하고 있습니다. 남미, 중동 및 아프리카는 현재로서는 아직 규모가 작지만, 브라질, GCC(걸프협력회의), 남아프리카공화국에서 네트워크화된 병원의 구축이 진행되고 있으며, 기기의 수명 주기 초기 단계에서 원격 측정 기능이 사양으로 포함되고 있어, 향후 도입을 위한 더 나은 여건이 조성되고 있습니다.
기타 혜택:
- 엑셀 형식 시장 예측(ME) 시트
- 3개월간의 애널리스트 지원
자주 묻는 질문
목차
제1장 서론
제2장 조사 방법
제3장 주요 요약
제4장 시장 구도
제5장 시장 규모와 성장 예측
제6장 경쟁 구도
제7장 시장 기회와 향후 전망
JHS 26.08.07According to Mordor Intelligence, the predictive maintenance for MedTech market is projected to expand from USD 11.86 billion in 2025 and USD 13.24 billion in 2026 to USD 23.87 billion by 2031, registering a CAGR of 12.50% between 2026 to 2031.
This report is Segmented by Component (Software, Services, Hardware), Deployment (Cloud-Based, On-Premise, Hybrid), Organization Size (Large Enterprises, Small and Medium Enterprises), Application (Imaging Systems, and Others), End-User (Hospitals, and Others), and Geography (North America, Europe, Asia-Pacific, and Others). The Market Forecasts are Provided in Terms of Value (USD).
Global Predictive Maintenance For MedTech Market Trends and Insights
Rising Installed Base of Connected Medical Equipment
The predictive maintenance for MedTech market is gaining momentum because connected clinical assets now produce a steady stream of operating data instead of isolated fault codes, which makes failure detection more precise and more useful in daily service planning. A 500-bed hospital in 2026 operates 15,000 to 20,000 connected medical devices, and that scale has changed maintenance from an equipment task into a fleet management problem that requires constant prioritization.Staffing constraints add more pressure because the same source notes that the U.S. labor pipeline remains far smaller than projected biomedical equipment technician demand, which makes predictive automation more relevant in routine operations. Procurement patterns are also helping adoption because new medical equipment increasingly ships with embedded sensors and cloud connectivity as standard features instead of optional upgrades. That change means newer hospitals can launch the predictive maintenance for MedTech market from a stronger starting point, with cleaner telemetry and fewer retrofit projects than older facilities had to manage.
Escalating Downtime Cost and Service-Level Pressure in Hospitals
The predictive maintenance for MedTech market is also being lifted by the direct financial cost of equipment failure, which has become easier for hospital leadership to measure and link to revenue disruption. One day of unplanned MRI downtime can cost more than USD 41,000 at hospitals averaging 380 MRI procedures per month in the United States, and that loss can represent more than 15 canceled scan sessions. GE HealthCare reported that its OnWatch Predict platform reduced unplanned downtime by up to 60% and lowered customer-initiated service requests by 35%, which translated into 2.5 additional operating days per MRI system each year across 1,500 EMEA installations. This matters more as hospital groups negotiate broader service contracts with uptime commitments, because availability is no longer treated as a service aspiration and is now tied more closely to contract performance. As these expectations spread across larger care networks, the predictive maintenance for MedTech market benefits vendors that can show measurable uptime gains and connect those gains to service-level outcomes.
Fragmented OEM Data Access and Limited Interoperability
The predictive maintenance for MedTech market still faces a major barrier because multi-vendor hospitals receive telemetry in proprietary formats that were built for OEM service portals rather than neutral analytics environments. A hospital that manages equipment from 5 or more manufacturers may need separate integration work for each vendor before a cross-fleet model can operate in a useful way, which extends deployment time and raises project cost. Even when access is contractually available, the most maintenance-relevant fields, including wear counters, drift indicators, and detailed error histories, are not always exposed in a complete form to third-party systems. HL7 FHIR R6 has introduced the DeviceAlert resource, which creates a formal path for device alert data inside a standardized framework, but adoption across large legacy fleets will take time. Until interoperability improves further, the predictive maintenance for MedTech market will remain easier for OEM-linked solutions to scale than for independent vendors that must normalize data across competing device ecosystems.
Other drivers and restraints analyzed in the detailed report include:
- Expansion of Remote Device Monitoring and Cloud-Connected Service Models
- AI Model Maturation for Anomaly Detection on Medical Assets
- High Validation Burden for Clinical-Grade Predictive Models
For complete list of drivers and restraints, kindly check the Table Of Contents.
Segment Analysis
Software held 57.11% of the predictive maintenance for MedTech market share in 2025, which confirms that buyers still place the highest value on analytics layers that can sit over installed device fleets without forcing hardware replacement. In the predictive maintenance for MedTech market, software remains attractive because health systems can extend one analytics environment across imaging, patient monitoring, laboratory systems, and infusion equipment under a recurring subscription model. Hardware is the smallest revenue component because gateways, edge nodes, and connected sensors are becoming more standardized and less differentiated in price. In the predictive maintenance for MedTech industry, value is shifting toward how data is interpreted and operationalized rather than toward the physical devices that collect it.
Services are expanding faster than the overall market, with a projected 12.93% CAGR from 2026 to 2031, because many health systems prefer outsourced analytics management instead of building internal capabilities from the ground up. The predictive maintenance for MedTech market is therefore seeing services move away from one-time implementation work and toward recurring managed support tied to uptime, intervention planning, and workflow execution. As more service value becomes linked to data ownership and model performance, the predictive maintenance for MedTech market may become harder for smaller service firms to penetrate unless they can partner for telemetry access or narrow their focus to selected device classes.
Cloud-based deployment held 58.71% market share in 2025, which reflects strong buyer preference for elastic compute capacity, centralized model updates, and subscription pricing that converts capital spending into operating cost. The predictive maintenance for MedTech market has favored cloud adoption because high-fidelity model training needs large volumes of historical device data that many hospital-owned systems cannot process efficiently on local infrastructure. Cloud delivery also makes it easier for vendors to push model improvements, software fixes, and workflow changes across distributed fleets without waiting for site-by-site intervention.
Hybrid architecture is the fastest-growing deployment mode with an anticipated CAGR at 12.86%, because it addresses a practical gap between local control and centralized analysis in the predictive maintenance for the MedTech market. In this setup, sensitive or time-critical telemetry can be processed at the edge, while model training and fleet-wide benchmarking can still occur in the cloud. On-premise systems will continue to hold a place in locations with strict data residency expectations, but the predictive maintenance for MedTech market is increasingly moving toward architectures that combine local processing with cloud-based learning and oversight.
Complete Report Scope:
- By Component
- Software
- Services
- Hardware
- By Deployment Mode
- Cloud-Based
- On-Premise
- Hybrid
- By Organization Size
- Large Enterprises
- Small and Medium Enterprises
- By Application
- Imaging Systems
- Patient Monitoring Systems
- Laboratory Diagnostics Equipment
- Surgical and Therapy Devices
- Sterilization and Support Equipment
- By End-User
- Hospitals
- Ambulatory Surgery Centers
- Diagnostic Imaging Centers
- Clinics and Specialty Centers
- Home Healthcare Providers
- By Geography
- North America
- United States
- Canada
- Mexico
- Europe
- Germany
- United Kingdom
- France
- Italy
- Spain
- Rest of Europe
- Asia-Pacific
- China
- Japan
- India
- Australia
- South Korea
- Rest of Asia-Pacific
- Middle East and Africa
- GCC
- South Africa
- Rest of Middle East and Africa
- South America
- Brazil
- Argentina
- Rest of South America
- North America
Geography Analysis
North America held 49.35% of the predictive maintenance for MedTech market share in 2025, supported by dense connected hospital infrastructure, mature third-party service organizations, and health systems with strong multi-site procurement capacity. The United States remains the main revenue center because large hospital networks are already managing complex fleets and are under pressure to standardize documentation, uptime, and maintenance governance across many facilities.
Europe remains the second-largest regional market, with Germany, the United Kingdom, and France serving as the main demand centers because they combine large hospital systems, strict governance expectations, and strong OEM presence. Germany stands out because university hospital networks operate broad multi-modality fleets and sit close to major OEM service organizations, which creates a demanding home environment for predictive service capability. Siemens Healthineers has used its digital health platform to combine equipment utilization analytics, remote diagnostics, and protocol optimization, showing how deeply maintenance intelligence can be integrated into broader care delivery software. The United Kingdom, France, Italy, the Nordics, Poland, and the Netherlands are also advancing as procurement programs push larger care networks toward more standardized equipment management models.
Asia-Pacific is forecasted to grow at 14.48% CAGR from 2026 to 2031, which makes it the fastest-growing regional segment in the predictive maintenance for MedTech market. China, India, Japan, and South Korea are creating new demand because government-backed hospital digitization is improving the data foundation needed for fleet-level equipment intelligence. Japan also presents a strong case for predictive service adoption because the pressure to keep devices available is rising alongside the need to control maintenance costs in a mature health system. China is adding momentum as more networked medical devices move under tighter cybersecurity and maintenance governance expectations, which pushes hospitals toward more formal monitoring practices. South America and the Middle East and Africa remain smaller today, but connected hospital buildouts in Brazil, the GCC, and South Africa are setting better conditions for future adoption because telemetry capability is being specified earlier in the equipment lifecycle.
- Agiliti, Inc.
- Althea Group
- Amazon Web Services, Inc.
- Aramark
- Aspen Technology, Inc.
- B. Braun
- Baxter
- Cisco Systems
- FUJIFILM
- GE Healthcare
- IBM
- Koninklijke Philips
- Medtronic
- Microsoft
- Oracle
- PTC Inc.
- SAP
- SAS Institute
- Schneider Electric SE
- Siemens Healthineers
Additional Benefits:
- The market estimate (ME) sheet in Excel format
- 3 months of analyst support
TABLE OF CONTENTS
1 Introduction
- 1.1 Study Assumptions and Market Definition
- 1.2 Scope of the Study
2 Research Methodology
3 Executive Summary
4 Market Landscape
- 4.1 Market Overview
- 4.2 Market Drivers
- 4.2.1 Rising Installed Base of Connected Medical Equipment
- 4.2.2 Escalating Downtime Cost and Service-Level Pressure in Hospitals
- 4.2.3 Expansion of Remote Device Monitoring and Cloud-Connected Service Models
- 4.2.4 AI Model Maturation for Anomaly Detection on Medical Assets
- 4.2.5 Underused Service Telemetry from Multi-Vendor Fleets
- 4.2.6 Cyber-Resilient Edge Analytics for Regulated Device Environments
- 4.3 Market Restraints
- 4.3.1 Fragmented OEM Data Access and Limited Interoperability
- 4.3.2 High Validation Burden for Clinical-Grade Predictive Models
- 4.3.3 Cybersecurity and Patient-Data Governance Complexity
- 4.3.4 Long Hospital Procurement and Integration Cycles
- 4.4 Supply/Value Chain Analysis
- 4.5 Regulatory Landscape
- 4.6 Technological Outlook
- 4.7 Porter's Five Forces Analysis
- 4.7.1 Threat of New Entrants
- 4.7.2 Bargaining Power of Suppliers
- 4.7.3 Bargaining Power of Buyers
- 4.7.4 Threat of Substitutes
- 4.7.5 Competitive Rivalry
5 Market Size & Growth Forecasts (Value, USD)
- 5.1 By Component
- 5.1.1 Software
- 5.1.2 Services
- 5.1.3 Hardware
- 5.2 By Deployment Mode
- 5.2.1 Cloud-Based
- 5.2.2 On-Premise
- 5.2.3 Hybrid
- 5.3 By Organization Size
- 5.3.1 Large Enterprises
- 5.3.2 Small and Medium Enterprises
- 5.4 By Application
- 5.4.1 Imaging Systems
- 5.4.2 Patient Monitoring Systems
- 5.4.3 Laboratory Diagnostics Equipment
- 5.4.4 Surgical and Therapy Devices
- 5.4.5 Sterilization and Support Equipment
- 5.5 By End-User
- 5.5.1 Hospitals
- 5.5.2 Ambulatory Surgery Centers
- 5.5.3 Diagnostic Imaging Centers
- 5.5.4 Clinics and Specialty Centers
- 5.5.5 Home Healthcare Providers
- 5.6 By Geography
- 5.6.1 North America
- 5.6.1.1 United States
- 5.6.1.2 Canada
- 5.6.1.3 Mexico
- 5.6.2 Europe
- 5.6.2.1 Germany
- 5.6.2.2 United Kingdom
- 5.6.2.3 France
- 5.6.2.4 Italy
- 5.6.2.5 Spain
- 5.6.2.6 Rest of Europe
- 5.6.3 Asia-Pacific
- 5.6.3.1 China
- 5.6.3.2 Japan
- 5.6.3.3 India
- 5.6.3.4 Australia
- 5.6.3.5 South Korea
- 5.6.3.6 Rest of Asia-Pacific
- 5.6.4 Middle East and Africa
- 5.6.4.1 GCC
- 5.6.4.2 South Africa
- 5.6.4.3 Rest of Middle East and Africa
- 5.6.5 South America
- 5.6.5.1 Brazil
- 5.6.5.2 Argentina
- 5.6.5.3 Rest of South America
- 5.6.1 North America
6 Competitive Landscape
- 6.1 Market Concentration
- 6.2 Market Share Analysis
- 6.3 Company Profiles (includes Global level Overview, Market level overview, Core Segments, Financials as available, Strategic Information, Market Rank/Share for key companies, Products & Services, Recent Developments)
- 6.3.1 Agiliti, Inc.
- 6.3.2 Althea Group
- 6.3.3 Amazon Web Services, Inc.
- 6.3.4 Aramark
- 6.3.5 Aspen Technology, Inc.
- 6.3.6 B. Braun SE
- 6.3.7 Baxter International Inc.
- 6.3.8 Cisco Systems, Inc.
- 6.3.9 FUJIFILM Holdings Corporation
- 6.3.10 GE HealthCare
- 6.3.11 IBM
- 6.3.12 Koninklijke Philips N.V.
- 6.3.13 Medtronic
- 6.3.14 Microsoft Corporation
- 6.3.15 Oracle Corporation
- 6.3.16 PTC Inc.
- 6.3.17 SAP SE
- 6.3.18 SAS Institute Inc.
- 6.3.19 Schneider Electric SE
- 6.3.20 Siemens Healthineers AG
7 Market Opportunities & Future Outlook
- 7.1 White-space & Unmet-need Assessment


