|
시장보고서
상품코드
2099308
소버린 광섬유 백본 인프라 : 시장 점유율 분석, 업계 동향 및 통계, 성장 예측(2026-2031년)Sovereign Fiber Backbone Infrastructure - Market Share Analysis, Industry Trends & Statistics, Growth Forecasts (2026 - 2031) |
||||||
 Mordor Intelligence
Mordor Intelligence에 의하면, 소버린 광섬유 백본 인프라 시장 규모는 2025년에 309억 1,000만 달러로 평가되었습니다. 2028년까지 342억 달러, 2031년까지 641억 달러에 이를 것으로 예상되고 2026년부터 2031년에 걸쳐 CAGR 13.39%로 성장할 전망입니다.
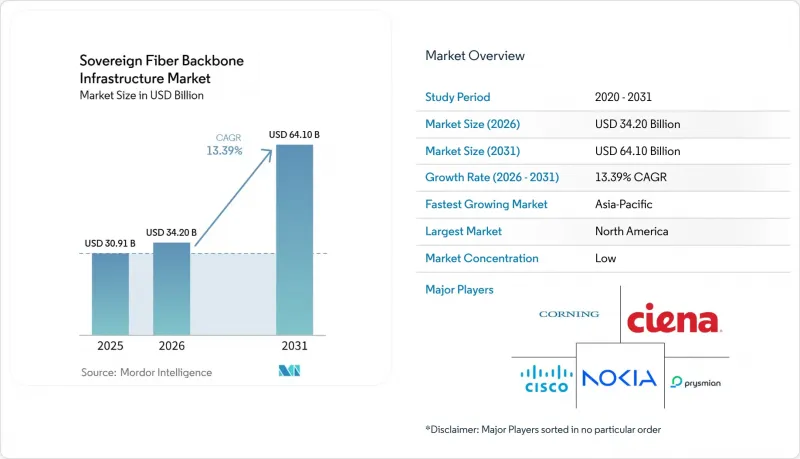
본 보고서는 인프라 유형(육상, 도시 간, 메트로, 해저, 국경을 넘는 회선 등), 도입 아키텍처(다크 파이버, 라이트 파이버 등), 최종 사용자(정부, 통신 사업자, 클라우드 및 하이퍼스케일 등), 지역(북미, 남미, 유럽, 아시아태평양, 중동 등)별로 분류되어 있습니다. 시장 전망은 금액(달러) 기준으로 제시되어 있습니다.
세계의 소버린 광섬유 백본 인프라 시장 동향 및 인사이트
국가 데이터 주권법이 국내 백본 구축을 가속화
소버린 광섬유 백본 인프라 시장에서는 광범위한 현지화 규제에서 조달 주도형 네트워크 구축으로의 직접적인 전환이 나타나고 있습니다. 특히, 기밀성이 높은 트래픽의 착륙 지점이나 라우팅 방법에 대해 정부가 더 강력한 관리 권한을 요구하는 지역에서 이러한 경향이 두드러집니다. 이에 따라 제3자의 관할 구역을 경유하는 트랜짓 계약에 대한 의존 대신, 국가가 관리하는 백본 자산에 대한 수요가 증가하고 있습니다. 소버린 광섬유 백본 인프라 시장에서 이러한 변화는 경로 계획에 영향을 미치고 있습니다. 공공 부문 구매자들이 기밀성이 높은 워크로드에 대해 국내로 상륙하는 광섬유나 관리 하에 있는 백본 구간을 점점 더 선호하고 있기 때문입니다. 또한 이로 인해 보안 수준이 높은 다크 파이버 및 전용 경로 용량공급 부족이 발생하고 있으며, 이는 임대 가격 상승을 부추기는 동시에 이미 현지 허가나 통행권을 보유하고 정부 조달 기관으로부터 신뢰를 얻고 있는 사업자에게 유리하게 작용하고 있습니다. 동시에, 해저 케이블의 내결함성 및 허가 절차에 관한 국제적 협력이 정책 과제로서 중요성이 커지고 있으며, 이는 주권 네트워크 계획을 위한 보다 공식적인 규제 환경 조성을 뒷받침하고 있습니다.
AI와 데이터센터 회랑의 성장이 저지연 광섬유 백본에 대한 수요를 높이고 있습니다.
분산형 컴퓨팅 클러스터에서는 기존의 기업 트래픽 패턴이 요구하던 것보다 메트로 및 도시 간 회랑에 걸친 저지연 링크가 필요하기 때문에 AI 워크로드의 확대로 인해 소버린 광섬유 백본 인프라 시장이 재편되고 있습니다. 코닝(Corning)은 2026년 1분기 광통신 부문 매출이 전년 동기 대비 36% 증가했다고 보고했으며, 이는 AI 인프라 구축에 따라 광섬유 수요가 얼마나 급속히 증가하고 있는지를 여실히 보여줍니다. 또한 코닝은 2026년 1월, 메타(Meta)와 AI 등급 광섬유에 관한 60억 달러 규모공급 계약을 체결했는데, 이는 현재 대규모 AI 프로그램에 수반되는 백본 및 상호 연결 요구 사항의 규모를 반영한 것입니다. 소버린 광섬유 백본 인프라 시장에서도 전력 제약으로 인해 AI 처리 능력이 더 많은 지역 캠퍼스로 분산되고 있으며, 이로 인해 구축당 상호 연결 경로 수는 감소하기는커녕 오히려 증가하고 있습니다. 이러한 추세는 고밀도 컴퓨팅 클러스터를 연결하는 전체 경로에 걸쳐 저지연 장거리 경로, 메트로 링 및 광섬유 업그레이드에 대한 지속적인 수요를 뒷받침하고 있습니다.
초기 단계의 토목 공사 및 인허가 절차의 복잡성이 수익화까지의 시간을 지연시킵니다.
소버린 광섬유 백본 인프라 시장은 토목 공사의 막중한 부담으로 인한 압박에 계속해서 직면하고 있습니다. 이는 도랑 파기, 교차로 공사, 설치 및 경로 승인이 여전히 프로젝트 비용과 일정 위험의 상당 부분을 차지하기 때문입니다. 여러 국가 및 지역의 프로그램이 동시에 진행될 경우, 실제 건설 공사가 정점에 달하기도 전에 시공사 확보 및 행정 기관의 심사 능력이 병목 현상이 됩니다. FCC는 2026년 6월, 통행권 승인 신청 처리 기한을 120일로 설정할 것을 제안했으며, 이는 규제 당국이 승인 지연을 구조적인 문제로 인식하고 있음을 보여줍니다. 국영 광섬유 백본 인프라 시장에서 승인 지연은 자본 투입부터 수익 창출까지의 대기 시간을 길게 만들며, 여러 관할 구역에 걸쳐 백본을 구축할 때 자금 조달에 대한 압박을 가중시킵니다. 이 문제는 장거리 노선에서 특히 두드러지며, 단 한 건의 허가가 미해결 상태일 뿐이라도 구간 전체의 지연을 초래하여 네트워크 구축 순서, 도급업체 배치 및 고객 서비스 개시 일정을 변경해야 할 수도 있습니다.
부문 분석
2025년에는 국내 육상 백본이 매출의 35.61%를 차지하며, 소버린 광섬유 백본 인프라 시장에서 가장 큰 인프라 유형이 되었습니다. 이러한 주도적 지위는 국가가 자금을 지원하는 광대역 프로그램, 국내 통신 사업자의 네트워크 업그레이드, 그리고 비용 효율적인 백본 구축을 위한 통행권으로서 철도 및 유틸리티용 회랑이 지속적으로 활용되고 있음을 반영합니다. 소버린 광섬유 백본 인프라 시장은 여전히 지상 자산에 크게 의존하고 있습니다. 이는 공공 서비스, 국방 통신 및 우선순위가 높은 디지털 트래픽 분야에서 정부가 요구하는 국내 관리를 지상 자산이 제공하기 때문입니다. 2026년 2월, NEC 주식회사와 노키아는 브라질 전역에 걸쳐 엘레트로넷(Eletronnet)사의 광 백본을 8,000킬로미터 확장하는 사업에 선정되었습니다. 이를 통해 해당 시스템은 23개 주에 걸쳐 총 길이 2만 5,000킬로미터, 광채널당 최대 1.2 Tb/s의 용량을 실현하게 됩니다.
해저 및 국경을 넘는 백본 분야는 2031년까지 연평균 성장률(CAGR) 14.76%를 나타낼 것으로 예측되며, 소버린 광섬유 백본 인프라 시장에서 가장 빠르게 성장하는 인프라 유형이 될 전망입니다. 이러한 성장은 정부와 통신 사업자들이 혼잡하거나 지정학적으로 민감한 중계 경로에 대한 의존도를 낮추려는 가운데, 경로 다각화에 대한 수요를 반영한 것입니다. 소버린 광섬유 백본 인프라 업계에서 이러한 변화는 중요한 의미를 지닙니다. 경로 설계가 더 이상 단순한 장애 내성 문제에 그치지 않고, 트래픽 흐름 및 상륙 관할권에 대한 전략적 통제 문제로 다루어지고 있기 때문입니다. 따라서 주권형 구매자들은 새로운 케이블 경로를 통해 특정 병목 현상이나 정치적으로 위험이 높은 회랑에 대한 의존을 피할 수 있다면, 더 높은 복잡성과 비용을 감수하는 경향을 보이고 있습니다. 그 결과, 기존의 상업적 수익 모델만으로는 예측할 수 없을 정도로 해저 및 국경을 넘는 경로에 대한 투자의 타당성이 더욱 공고해지고 있습니다.
지역별 분석
2025년, 북미는 매출의 22.31%를 차지하며 소버린 광섬유 백본 인프라 시장에서 가장 규모가 큰 지역 부문이 되었습니다. 이러한 위상은 해당 지역 내 하이퍼스케일러의 설비 투자 집중, AI 회랑 개발, 그리고 전략적 디지털 인프라를 위한 안전한 국내 라우팅에 대한 정책적 중점을 반영한 것입니다. Zayo사는 2025년 7월, 북미 코어 네트워크의 400G 대응을 100% 완료했을 뿐만 아니라, 시카고-콜럼버스 간 385마일에 달하는 회선 건설을 포함한 새로운 장거리 AI 경로 구축도 추진했습니다. 북미의 소버린 광섬유 백본 인프라 시장은 캐나다의 디지털 주권 확보를 위한 노력과 니어쇼어링, 데이터센터의 성장, 국경을 넘는 트래픽 수요에서 멕시코가 국경을 넘는 회랑으로서 수행하는 역할로부터도 혜택을 받고 있습니다.
남미에서는 소버린 광섬유 백본 인프라 시장이 새로운 투자 단계에 접어들었습니다. 그 초점은 단순한 연결성 확대에서 AI, 데이터센터 간 상호 연결, 그리고 대용량 광통신으로의 업그레이드로 이동하고 있습니다. 이러한 전환 과정에서 브라질이 두드러지고 있으며, 엘레트로넷(Eletronet)이 NEC 및 노키아와 공동으로 추진하는 네트워크 확장을 통해 하이퍼스케일러 및 데이터센터 수요에 대응하는 백본 플랫폼에 규모, 도달 범위, 그리고 더 높은 채널 성능이 확보되고 있습니다. 유럽 역시 지역 차원에서 지원되는 백본 및 해저 연결 프로그램의 연계를 통해 소버린 광섬유 백본 인프라 시장에서 탄력을 받고 있습니다. 이는 범유럽 차원의 자금 조달과 정책 조정이 고립된 국내 전개보다 대규모 플랫폼을 우선시하고 있기 때문에 중요한 의미를 지닙니다. 그 결과, 주권형 연결을 위한 기반이 강화되어 지역 간 상호 운용성과 경로의 내결함성을 동시에 향상시킬 수 있게 됩니다.
아시아태평양은 2031년까지 연평균 성장률(CAGR) 15.11%로 확대될 것으로 예측되며, 소버린 광섬유 백본 인프라 시장에서 가장 빠르게 성장하는 지역 부문이 될 것입니다. 이 지역의 성장은 인도의 디지털 인프라 구축 추진, 중국의 케이블 시스템 규모, 그리고 동남아시아 전역에 걸친 하이퍼스케일 수요 증가가 복합적으로 작용한 결과입니다. 타타 커뮤니케이션즈는 2026년 6월, MIST 시스템과 프로젝트 CS를 포함한 인도-싱가포르 간 해저 케이블 프로젝트 2건에 대해 1억 5,200만 달러의 투자를 발표하며, 뭄바이, 첸나이, 싱가포르 간 통신 용량을 대폭 증강했습니다. 또한 2026년 5월에는 차이나 텔레콤이 주도하는 컨소시엄을 통해 ‘아시아 링크 케이블’이 홍콩에 상륙함으로써, 홍콩과 싱가포르를 연결하는 국제 회랑이 강화되었습니다. 중동 및 아프리카 역시, 걸프 국가들이 홍해를 경유하는 노선을 대체할 육상 노선에 대한 투자를 추진하고, 아프리카 국가들이 국내 백본 시스템 및 국경을 넘는 회선 확충을 지속하고 있어, 국가 광섬유 백본 인프라 시장에서 그 중요성이 커지고 있습니다.
기타 혜택 :
- 엑셀 형식 시장 예측(ME) 시트
- 3개월간의 애널리스트 지원
자주 묻는 질문
목차
제1장 서론
제2장 조사 방법
제3장 주요 요약
제4장 시장 구도
제5장 시장 규모 및 성장 예측
제6장 경쟁 구도
제7장 시장 기회 및 향후 전망
KTH 26.08.10According to Mordor Intelligence, the sovereign fiber backbone infrastructure market size was valued at USD 30.91 billion in 2025 and is expected to reach USD 34.20 billion by 2028, and USD 64.10 billion by 2031, registering a CAGR of 13.39% over 2026-2031.
This report is Segmented by Infrastructure Type (Terrestrial, Intercity, Metro, Subsea and Cross-Border, and More), Deployment Architecture (Dark Fiber, Lit Fiber, and More), End User (Government, Telecom, Cloud and Hyperscale, and More), and Geography (North America, South America, Europe, Asia-Pacific, Middle East, and More). The Market Forecasts are Provided in Terms of Value (USD).
Global Sovereign Fiber Backbone Infrastructure Market Trends and Insights
National Data Sovereignty Laws Accelerate Domestic Backbone Buildouts
The sovereign fiber backbone infrastructure market is seeing a direct shift from broad localization rules to procurement-led network buildouts, especially where governments want more control over where sensitive traffic lands and how it is routed. This is increasing demand for nationally controlled backbone assets rather than reliance on transit arrangements that pass through third-party jurisdictions. In the sovereign fiber backbone infrastructure market, this changes route planning because public buyers increasingly favor domestically landed fiber and controlled backbone segments for sensitive workloads. It also creates scarcity in high-security dark fiber and exclusive route capacity, which supports stronger lease pricing and favors operators that already hold local permits, rights-of-way, and trust with state buyers. At the same time, international coordination on cable resilience and permit processing has risen on the policy agenda, which supports a more formal regulatory backdrop for sovereign network planning.
AI And Data Center Corridor Growth Raise Demand For Low-Latency Fiber Backbones
The sovereign fiber backbone infrastructure market is being reshaped by AI workload growth, as distributed compute clusters require lower-latency links across metro and intercity corridors than older enterprise traffic patterns demanded. Corning reported 36% year-over-year growth in the Optical Communications segment revenue in Q1 2026, underscoring how quickly fiber demand has risen with AI infrastructure deployment.Corning also signed a USD 6 billion supply agreement with Meta in January 2026 for AI-grade optical fiber, which reflects the scale of backbone and interconnect requirements now attached to large AI programs. In the sovereign fiber backbone infrastructure market, power constraints are also spreading AI capacity across more regional campuses, which increases the number of interconnect paths needed per deployment rather than reducing them. That pattern supports sustained demand for low-latency long-haul routes, metro rings, and optical upgrades across the routes that link high-density compute clusters.
High Upfront Civil Works and Permitting Complexity Slow Time To Revenue
The sovereign fiber backbone infrastructure market continues to face pressure from the intensity of civil works, as trenching, crossings, attachments, and route approvals still account for a large share of project costs and schedule risk. When multiple national and regional programs move simultaneously, contractor availability and agency review capacity become bottlenecks even before physical construction reaches peak activity. The FCC proposed a 120-day deadline for processing right-of-way authorization requests in June 2026, indicating that regulatory bodies are treating approval delays as a structural issue. In the sovereign fiber backbone infrastructure market, the effect of slow approvals is a longer wait between capital commitment and revenue generation, which raises financing pressure on multi-jurisdiction backbone builds. That challenge is strongest on long-haul routes, where a single unresolved permit can delay entire segments and force changes to network sequencing, contractor deployment, and customer activation.
Other drivers and restraints analyzed in the detailed report include:
- Hyperscaler And Cloud Interconnect Needs Push Long-Haul Capacity Expansion
- Defense, Critical Infrastructure, And Public Sector Segmentation Increase Demand For Controlled Fiber Routes
- Cross-Border Coordination and Landing Rights Delays Increase Project Risk
For complete list of drivers and restraints, kindly check the Table Of Contents.
Segment Analysis
Terrestrial national backbone accounted for 35.61% of revenue in 2025, making it the largest infrastructure type in the sovereign fiber backbone market. This leading position reflects state-funded broadband programs, national carrier upgrades, and the continued use of railway and public utility corridors as cost-efficient backbone deployment rights-of-way. The sovereign fiber backbone infrastructure market still depends heavily on terrestrial assets because they provide the domestic control that governments want for public services, defense communications, and high-priority digital traffic. NEC Corporation and Nokia were selected in February 2026 to expand Eletronet's optical backbone across Brazil by 8,000 kilometers, taking the system to 25,000 kilometers across 23 states with up to 1.2 Tb/s per optical channel.
The subsea and cross-border backbone segment is projected to grow at a 14.76% CAGR through 2031, making it the fastest-growing infrastructure type in the sovereign fiber backbone market. This growth reflects the need for route diversity as governments and operators try to reduce exposure to congested or geopolitically sensitive transit paths. In the sovereign fiber backbone infrastructure industry, this shift is important because route design is no longer only a resilience question and is increasingly treated as a matter of strategic control over traffic movement and landing jurisdiction. That is why sovereign buyers are accepting higher complexity and cost when new cable paths help them avoid specific bottlenecks or reliance on politically exposed corridors. The result is a more durable investment case for subsea and cross-border routes than traditional commercial return models alone would suggest.
Complete Report Scope:
- By Infrastructure Type
- Terrestrial National Backbone
- Intercity Long-Haul Backbone
- Metro Backbone Rings
- Subsea and Cross-Border Backbone
- Utility and Rail Corridor Fiber Backbone
- By Deployment Architecture
- Dark Fiber
- Lit Fiber Services
- Hybrid Fiber and Wave Services
- By End User
- Government and Defense
- Telecom Operators
- Cloud and Hyperscale Data Centers
- Enterprises and Financial Institutions
- Utilities and Critical Infrastructure Operators
- By Geography
- North America
- United States
- Canada
- Mexico
- South America
- Brazil
- Argentina
- Rest of South America
- Europe
- Germany
- United Kingdom
- France
- Italy
- Spain
- Russia
- Rest of Europe
- Asia-Pacific
- China
- India
- Japan
- South Korea
- Australia
- Rest of Asia-Pacific
- Middle East and Africa
- Middle East
- Turkey
- Saudi Arabia
- United Arab Emirates
- Qatar
- Rest of Middle East
- Africa
- South Africa
- Kenya
- Nigeria
- Rest of Africa
- Middle East
- North America
Geography Analysis
North America accounted for 22.31% of revenue in 2025, making it the largest regional segment in the sovereign fiber backbone infrastructure market. This position reflects the region's concentration of hyperscaler capital spending, AI corridor development, and a stronger policy focus on secure domestic routing for strategic digital infrastructure. Zayo completed 100% 400G enablement of its North American core network in July 2025 and also advanced new long-haul AI routes, including a 385-mile Chicago-to-Columbus build. The sovereign fiber backbone infrastructure market in North America also benefits from Canada's digital sovereignty efforts and Mexico's role as a transboundary corridor for nearshoring, data center growth, and cross-border traffic demand.
South America is entering a new investment phase in the sovereign fiber backbone infrastructure market, as the focus shifts from simple connectivity expansion toward AI, data center interconnect, and high-capacity optical upgrades. Brazil stands out in this transition as Eletronet's network expansion with NEC Corporation and Nokia adds scale, reach, and higher channel performance to a backbone platform aimed at hyperscaler and data center demand. Europe is also building momentum in the sovereign fiber backbone infrastructure market through coordinated backbone and submarine connectivity programs backed at the regional level. This matters because pan-European funding and policy coordination favor larger platforms over isolated national deployments. The result is a stronger foundation for sovereign connectivity, enabling regional interoperability and route resilience to be improved simultaneously.
Asia-Pacific is projected to expand at a 15.11% CAGR through 2031, which makes it the fastest-growing regional segment in the sovereign fiber backbone infrastructure market. Growth in this region reflects the overlap of India's digital infrastructure push, China's cable system scale, and rising hyperscale demand across Southeast Asia. Tata Communications announced a USD 152 million commitment in June 2026 to 2 India-Singapore subsea cable projects, including the MIST system and Project CS, adding major capacity between Mumbai, Chennai, and Singapore. The Asia Link Cable also landed in Hong Kong in May 2026 through a China Telecom-led consortium, strengthening the Hong Kong-to-Singapore international corridor. The Middle East and Africa are also becoming more important in the sovereign fiber backbone infrastructure market as Gulf states invest in overland alternatives to Red Sea exposure and African markets continue to scale national backbone systems and cross-border links.
- Nokia Corporation
- Huawei Technologies Co., Ltd.
- Ciena Corporation
- Cisco Systems, Inc.
- Corning Incorporated
- Prysmian S.p.A.
- Nexans S.A.
- Sterlite Technologies Limited
- Fujitsu Limited
- Infinera Corporation
- CommScope Holding Company, Inc.(Amphenol)
- ADVA Optical Networking SE
- Ribbon Communications Inc.
- ZTE Corporation
- Furukawa Electric Co., Ltd.
- SubCom, LLC
- NEC Corporation
- Alcatel Submarine Networks
- Telecom Egypt
- Telstra Group Limited
- Saudi Telecom Company
- Etisalat & (Emirates Telecommunications Company PJSC)
- Kenya Electricity Transmission Company Limited
- RailTel Corporation of India Limited
- Liquid Intelligent Technologies
Additional Benefits:
- The market estimate (ME) sheet in Excel format
- 3 months of analyst support
TABLE OF CONTENTS
1 INTRODUCTION
- 1.1 Study Assumptions and Market Definition
- 1.2 Scope of the Study
2 RESEARCH METHODOLOGY
3 EXECUTIVE SUMMARY
4 MARKET LANDSCAPE
- 4.1 Market Overview
- 4.2 Market Drivers
- 4.2.1 National Data Sovereignty Laws Accelerate Domestic Backbone Buildouts
- 4.2.2 Defense, Critical Infrastructure, and Public Sector Segmentation Increase Demand for Controlled Fiber Routes
- 4.2.3 Hyperscaler and Cloud Interconnect Needs Push Long-Haul Capacity Expansion
- 4.2.4 Geopolitical Route Diversification Away From Chokepoints Reduces Reliance on Foreign Transit
- 4.2.5 Open-Access Backbone Policies Improve Asset Utilization and Anchor Tenant Economics
- 4.2.6 AI and Data Center Corridor Growth Raises Demand for Low-Latency Fiber Backbones
- 4.3 Market Restraints
- 4.3.1 High Upfront Civil Works and Permitting Complexity Slow Time to Revenue
- 4.3.2 Cross-Border Coordination and Landing Rights Delays Increase Project Risk
- 4.3.3 Fiber Cut Exposure, Right-of-Way Theft, and Physical Security Risks Raise Operating Cost
- 4.3.4 Sovereign Procurement Rules Can Limit Vendor Flexibility and Raise Lifecycle Cost
- 4.4 Supply Chain Analysis
- 4.5 Regulatory Landscape
- 4.6 Technological Outlook
- 4.7 Porter's Five Forces Analysis
- 4.7.1 Bargaining Power of Suppliers
- 4.7.2 Bargaining Power of Buyers
- 4.7.3 Threat of New Entrants
- 4.7.4 Threat of Substitutes
- 4.7.5 Industry Rivalry
5 MARKET SIZE AND GROWTH FORECASTS (VALUE)
- 5.1 By Infrastructure Type
- 5.1.1 Terrestrial National Backbone
- 5.1.2 Intercity Long-Haul Backbone
- 5.1.3 Metro Backbone Rings
- 5.1.4 Subsea and Cross-Border Backbone
- 5.1.5 Utility and Rail Corridor Fiber Backbone
- 5.2 By Deployment Architecture
- 5.2.1 Dark Fiber
- 5.2.2 Lit Fiber Services
- 5.2.3 Hybrid Fiber and Wave Services
- 5.3 By End User
- 5.3.1 Government and Defense
- 5.3.2 Telecom Operators
- 5.3.3 Cloud and Hyperscale Data Centers
- 5.3.4 Enterprises and Financial Institutions
- 5.3.5 Utilities and Critical Infrastructure Operators
- 5.4 By Geography
- 5.4.1 North America
- 5.4.1.1 United States
- 5.4.1.2 Canada
- 5.4.1.3 Mexico
- 5.4.2 South America
- 5.4.2.1 Brazil
- 5.4.2.2 Argentina
- 5.4.2.3 Rest of South America
- 5.4.3 Europe
- 5.4.3.1 Germany
- 5.4.3.2 United Kingdom
- 5.4.3.3 France
- 5.4.3.4 Italy
- 5.4.3.5 Spain
- 5.4.3.6 Russia
- 5.4.3.7 Rest of Europe
- 5.4.4 Asia-Pacific
- 5.4.4.1 China
- 5.4.4.2 India
- 5.4.4.3 Japan
- 5.4.4.4 South Korea
- 5.4.4.5 Australia
- 5.4.4.6 Rest of Asia-Pacific
- 5.4.5 Middle East and Africa
- 5.4.5.1 Middle East
- 5.4.5.1.1 Turkey
- 5.4.5.1.2 Saudi Arabia
- 5.4.5.1.3 United Arab Emirates
- 5.4.5.1.4 Qatar
- 5.4.5.1.5 Rest of Middle East
- 5.4.5.2 Africa
- 5.4.5.2.1 South Africa
- 5.4.5.2.2 Kenya
- 5.4.5.2.3 Nigeria
- 5.4.5.2.4 Rest of Africa
- 5.4.5.1 Middle East
- 5.4.1 North America
6 COMPETITIVE LANDSCAPE
- 6.1 Market Concentration
- 6.2 Strategic Moves
- 6.3 Market Share Analysis
- 6.4 Company Profiles (includes Global Level Overview, Market Level Overview, Core Segments, Financials as available, Strategic Information, Market Rank/Share, Products and Services, Recent Developments)
- 6.4.1 Nokia Corporation
- 6.4.2 Huawei Technologies Co., Ltd.
- 6.4.3 Ciena Corporation
- 6.4.4 Cisco Systems, Inc.
- 6.4.5 Corning Incorporated
- 6.4.6 Prysmian S.p.A.
- 6.4.7 Nexans S.A.
- 6.4.8 Sterlite Technologies Limited
- 6.4.9 Fujitsu Limited
- 6.4.10 Infinera Corporation
- 6.4.11 CommScope Holding Company, Inc.(Amphenol)
- 6.4.12 ADVA Optical Networking SE
- 6.4.13 Ribbon Communications Inc.
- 6.4.14 ZTE Corporation
- 6.4.15 Furukawa Electric Co., Ltd.
- 6.4.16 SubCom, LLC
- 6.4.17 NEC Corporation
- 6.4.18 Alcatel Submarine Networks
- 6.4.19 Telecom Egypt
- 6.4.20 Telstra Group Limited
- 6.4.21 Saudi Telecom Company
- 6.4.22 Etisalat & (Emirates Telecommunications Company PJSC)
- 6.4.23 Kenya Electricity Transmission Company Limited
- 6.4.24 RailTel Corporation of India Limited
- 6.4.25 Liquid Intelligent Technologies
7 MARKET OPPORTUNITIES AND FUTURE OUTLOOK
- 7.1 White-Space and Unmet-Need Assessment