

|
시장보고서
상품코드
2099746
외상 치료 센터 : 시장 점유율 분석, 업계 동향 및 통계, 성장 예측(2026-2031년)Trauma Care Centers - Market Share Analysis, Industry Trends & Statistics, Growth Forecasts (2026 - 2031) |
||||||
 Mordor Intelligence
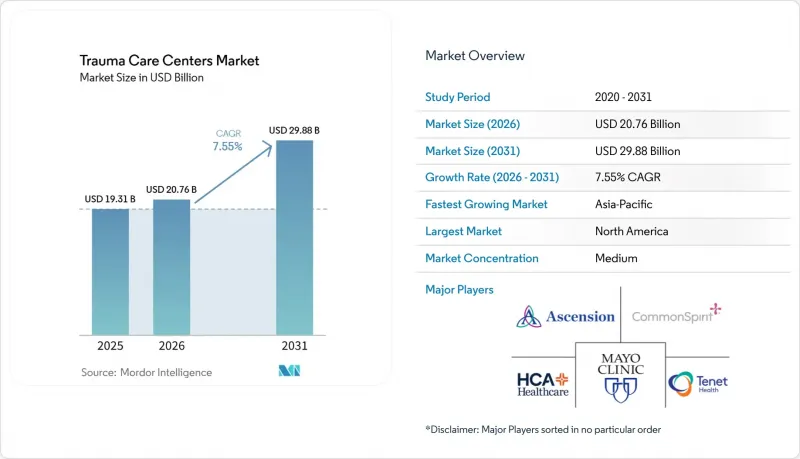
Mordor Intelligence에 의하면, 외상 치료 센터 시장 규모는 2025년 193억 1,000만 달러로 평가되었습니다. 2026년 207억 6,000만 달러에서 2031년까지 298억 8,000만 달러로 확대되어 2026년부터 2031년에 걸쳐 CAGR 7.55%를 나타낼 것으로 예측됩니다.
본 보고서는 시설 유형(병원 내 설치형, 독립형), 외상 유형(낙상, 교통사고, 자상·외상, 화상, 뇌손상), 서비스 유형(외래, 입원, 재활), 외상 센터 등급(레벨 I-V), 환자 연령대(성인, 소아, 고령자), 입원·내원 경로(구급차, 자력 내원, 항공 이송, 병원 간 이송), 지역(북미, 유럽, 기타)별로 분류되어 있습니다. 예측치는 금액(달러)으로 표시되어 있습니다.
세계의 외상 치료 센터 시장 동향 및 인사이트
증가하는 도로 교통사고로 인한 부상자 수 및 다발성 외상 사례 수
외상 치료 센터 시장은 전 세계 도로 교통사고의 막대한 건수로 인해 계속해서 혜택을 받고 있습니다. 세계보건기구(WHO)의 추정에 따르면, 매년 119만 명이 도로 교통사고로 사망하고 있으며, 2,000만 명에서 5,000만 명의 비치명적 부상자가 발생하고 있어, 이로 인해 외상 의료 시스템은 지속적인 압박을 받고 있습니다. 경제적 영향은 사망자보다 소생술, 수술, 영상 진단, 장기간의 집중 치료가 필요한 복잡한 다발성 외상을 입은 생존자들로 인해 더 크게 나타납니다. 동력 구동 이륜차 및 삼륜차가 사망자의 큰 비중을 차지하고 있으며, 남아시아 및 동남아시아의 오토바이가 주류를 이루는 교통 회랑에서는 체계적인 외상 치료 경로에 대한 심각한 수요가 충족되지 않은 상황입니다. 2025년에 발표된 연구 결과에 따르면, 지역 연계형 운영 모델은 일상적인 외상 치료 수요에 대응함과 동시에 대량 사상자에 대비할 수 있는 것으로 나타났으며, 이를 통해 외상 치료 센터 시장 전체에 대한 네트워크 투자의 정당성이 더욱 높아지고 있습니다.
낙상 및 취약성으로 인한 부상 부담이 증가하는 고령화 사회
외상 치료 센터 시장은 고령 인구 증가와 이에 따른 부상 중증도 상승에 의해서도 성장하고 있습니다. 미국 질병통제예방센터(CDC) 보고서에 따르면, 1,400만 명 이상의 미국 고령자(4명 중 1명)가 매년 낙상을 경험하고 있으며, 이로 인해 성숙한 의료 시스템에서 골절, 골반 손상, 외상성 뇌손상 사례 수가 높은 수준을 유지하고 있습니다. 미국 내 고령자의 비치명적 낙상과 관련된 의료비는 500억 달러에 달하며, 이는 고령자 외상이 의료 제공업체에게 사례 수와 비용 양면에서 큰 부담이 되고 있음을 보여줍니다. 미국의 고령자 인구는 2030년까지 7,400만 명에 달할 것으로 예측되며, 이는 향후 입원을 통한 회복 및 재활 수요가 더욱 확대될 것임을 시사합니다. 또한, 미국외과학회(American College of Surgeons)는 외상성 뇌손상에 관한 지침을 개정하여 조기 재활 지침을 포함시켰습니다. 이에 따라 외상 치료 센터가 임상 경로(치료 경로)를 구축하는 데 있어 노인 외상이 더욱 중심적인 위치를 차지하게 될 것입니다.
인증 외상 외과 의사 및 전문 중환자 치료 인력 부족
외상 치료 센터 시장에서 가장 뿌리 깊은 운영상의 제약은 여전히 외과 의사 및 전문 인력의 부족입니다. 미국 의과대학 협회(AAMC)는 2036년까지 1만-1만 9,900명의 외과 의사가 부족할 것으로 예측하고 있으며, 이는 지속적인 담당 의사 배치가 필요한 센터의 인력 체계를 직접적으로 제한하는 요인이 되고 있습니다. 2025년 EAST의 다기관 공동 연구에서 업무 부하 벤치마크를 적용한 결과, 미국 의료 기관에서 급성기 외과 의사의 현저한 부족이 확인되었습니다. 이는 이러한 부족 현상이 이미 임상 현장에서 표면화되고 있음을 뒷받침합니다. 또한, 많은 외과 의사가 이미 정년퇴직 연령에 가까워지고 있어 노동력의 인구 구성 또한 추가적인 압박 요인으로 작용하고 있습니다. 레벨 I 및 레벨 II 인증은 24시간 365일 상주 의사 체제에 의존하고 있기 때문에 외상 치료 센터 시장에서는 설비 투자만으로는 이 문제를 해결할 수 없습니다.
부문 분석
2025년 시점에서 병원 내 외상 시설은 72.31%의 점유율을 차지했으며, 외상 치료 센터 시장 전체에서 지배적인 운영 모델로 자리 잡았습니다. 이러한 우위는 광범위한 병원 캠퍼스 내에서 수술실, 혈액은행, 영상진단 부서 및 급성기 후 병상을 공유함으로써 얻는 실질적인 가치를 반영합니다. 이러한 공유 플랫폼을 통해 외상 대응 체계의 추가 비용이 절감되고, 응급 처치, 수술, 회복의 각 단계에서 연속성이 향상됩니다. 또한, 외상 치료 수요와 다른 급성기 의료 서비스 간의 균형을 맞추어야 할 경우, 병원 그룹은 보다 유연하게 대응할 수 있게 됩니다.
외상 대응 비용을 더 광범위한 환자 기반에 분산시킬 수 있기 때문에 부서 간 상호 보완은 이러한 시설이 우위를 유지하는 주요 이유로 계속되고 있습니다. 독립형 센터의 경우 2031년까지 연평균 성장률(CAGR) 8.38%를 나타낼 것으로 예측되며, 특정 도시 및 도시 주변 지역에서 전용으로 건설된 모델이 탄력을 받고 있음을 보여줍니다. 이러한 시설들은 특히 공립 병원 캠퍼스가 과밀 상태에 있고, 민간 사업자가 보험 적용 대상 외상 환자를 보다 직접적으로 수용할 여지가 있다고 판단되는 지역에서 중요한 역할을 수행하고 있습니다. 2025년에 실시된 외상 네트워크 확대에 관한 조사에 따르면, 농촌 지역에 가까운 유리한 입지에 독립형 시설을 설치함으로써 병원 캠퍼스 전체를 건설하는 데 드는 전체 비용을 들이지 않고도 의료 접근성을 개선할 수 있는 것으로 밝혀졌습니다.
2025년에는 낙상으로 인한 외상이 35.24%의 점유율을 차지하며, 수익 측면에서 외상 치료 센터 시장의 중심적인 위치를 계속 차지했습니다. 이러한 경향은 65세 이상 인구에서 대퇴골 경부 골절, 골반 손상, 외상성 뇌손상의 발생률이 높다는 점과 관련이 있습니다. 성숙한 의료 시스템에서 이러한 환자들은 많은 젊은 환자층에 비해 더 장기적인 입원 치료나 더 철저한 재활 지원이 필요한 경우가 많습니다. 따라서 낙상은 외상 의료 제공업체에게 사례 수가 많고 막대한 자원을 필요로 하는 분야가 되고 있습니다.
교통사고로 인한 부상은 2031년까지 연평균 성장률(CAGR) 8.52%로 확대될 것으로 예측되며, 외상 유형 중 가장 빠르게 성장하는 분야입니다. 저소득국 및 중소득국, 특히 동력 이륜차 이용이 일반적인 지역의 자동차화 진전으로 인해 중대한 교통사고 발생 위험은 여전히 높은 수준을 유지하고 있습니다. 뇌 손상은 사례 수 측면에서는 여전히 소규모 부문이지만, 중환자실(ICU), 신경외과 및 신경 재활의 수용 능력을 불균형할 정도로 소모하고 있습니다. 화상 역시 사례 수는 적지만, 많은 일반 외상 병동에서는 제공할 수 없는 고도로 전문화된 상처 관리와 임상 인프라를 필요로 합니다. 이러한 추세를 종합해 보면, 외상 치료 센터 시장은 사례 수가 많은 낙상 사례가 수익을 뒷받침하는 한편, 중증도가 높은 교통사고, 뇌손상, 화상 사례가 역량 투자를 주도하는 균형 잡힌 사례 구성에 의존하고 있음을 알 수 있습니다.
지역별 분석
2025년, 북미는 36.61%의 점유율을 차지하며 외상 치료 센터 시장에서 여전히 최대 지역으로서의 지위를 유지했습니다. 이 지역은 지정 외상 시설의 네트워크 밀도가 가장 높은 지역 중 하나일 뿐만 아니라, 메디케어 및 메디케이드와 연계된 확립된 보상 제도의 혜택을 받고 있습니다. 미국에서는 여전히 지정 시설 확충이 진행 중이며, 2026년 6월에는 레이크랜드 리저널 헬스가 플로리다주에서 12번째 레벨 I 외상 센터로 승격되었고, 클리블랜드 클리닉도 2026년 3월에 5,000만 달러의 보조금을 확보한 후, 메인 캠퍼스에서 레벨 I 인증 획득을 목표로 하고 있습니다. 인력 부족과 대응 준비 자금의 부족은 여전히 해당 지역의 주요 구조적 제약 요인으로 남아 있으며, 이는 대규모 통합 의료 시스템으로의 통합을 지속적으로 촉진하고 있습니다.
유럽에서는 성숙한 서부 의료 시스템과 여전히 인프라 확충이 진행 중인 중동부 유럽 시장 사이에서 양극화가 지속되고 있습니다. 오스트리아의 AUVA 외상 센터 브리기텐나우(AUVA Trauma Center Brigittenau)는 2026년 중반에 모듈식 확장을 완료할 예정이며, 보다 광범위한 ‘비엔나 외상 캠퍼스(Trauma Campus Vienna)’ 모델에서는 2027년부터 급성기 의료와 재활 서비스를 단일 조직 체계 하에 통합하게 됩니다. 독일에서는 뷔르츠부르크 대학병원(Universitatsklinikum Wurzburg)의 북부 캠퍼스 확장에 17억 유로(19억 달러)를 투자한 데 이어, 2026년 6월 빌레펠트 대학병원(Klinikum Bielefeld)에 새로운 응급· 중환자 치료 센터가 개설되어 수용 능력이 더욱 확대되었습니다. 노르웨이의 BEST 프로그램은 2025년에 설립 당시 목표를 달성하여, 국가 외상 계획에 따라 병원 간 팀 교육을 의무화하고, 지역적 벤치마크로서 품질 표준화를 강화했습니다.
아시아태평양은 2031년까지 연평균 성장률(CAGR) 8.15%를 나타낼 것으로 예측되며, 외상 치료 센터 시장에서 가장 빠르게 성장하는 지역 블록이 될 전망입니다. 이러한 성장은 방대한 인구 규모, 뿌리 깊은 교통사고로 인한 부상 부담, 그리고 외상 인프라 및 이송 경로에 대한 공공 투자의 확대에 힘입은 것입니다. 이 지역의 각국 정부와 병원 운영자들은 3차 의료 기관의 부담을 줄이기 위해 초기 처치 능력, 이송 조정 및 재활 지원 확충을 추진하고 있습니다. 중동 및 아프리카는 여전히 규모는 작지만, GCC 국가들이 외상 대응 능력을 국가 의료 개혁 프로그램에 포함시키고 있어 성장을 이어가고 있습니다. 남미 역시 규모는 여전히 작지만, 브라질이 도시 지역의 외상 의료 시스템에 대한 투자를 주도하고 있으며, 남아프리카공화국은 향후 지역 지정 능력 확대로 이어질 단계적인 현대화를 추진하고 있습니다.
기타 혜택 :
- 엑셀 형식 시장 예측(ME) 시트
- 3개월간의 애널리스트 지원
자주 묻는 질문
목차
제1장 서론
제2장 조사 방법
제3장 주요 요약
제4장 시장 구도
제5장 시장 규모 및 성장 예측
제6장 경쟁 구도
제7장 시장 기회 및 향후 전망
KTH 26.08.10According to Mordor Intelligence, the trauma care centers market size is projected to expand from USD 19.31 billion in 2025 and USD 20.76 billion in 2026 to USD 29.88 billion by 2031, registering a CAGR of 7.55% between 2026 to 2031.
This report is Segmented by Facility Type (In-House, Standalone), Trauma Type (Falls, Traffic, Stab/Wound, Burn, Brain Injury), Service Type (Outpatient, Inpatient, Rehabilitation), Center Level (Level I-V), Patient Age (Adult, Pediatric, Geriatric), Admission Mode (Ambulance, Walk-In, Air Transport, Inter-Hospital), and Geography (North America, Europe, and More). Forecasts are Provided in Value (USD).
Global Trauma Care Centers Market Trends and Insights
Rising Road Traffic Injuries and Polytrauma Caseloads
The trauma care centers market continues to benefit from the sheer scale of road injury volumes worldwide. The World Health Organization estimated 1.19 million road traffic deaths each year, with 20 million to 50 million additional non-fatal injuries, which keeps trauma systems under sustained pressure. The financial effect comes less from fatalities and more from survivors with complex polytrauma who need resuscitation, surgery, imaging, and extended critical care. Powered 2-wheel and 3-wheel vehicles account for a large share of fatalities, which leaves motorcycle-heavy transport corridors in South and Southeast Asia with a deep unmet need for organized trauma pathways. Evidence published in 2025 also showed that coordinated regional operations models can support daily trauma demand and mass-casualty readiness at the same time, which improves the case for network investment across the trauma care centers market.
Aging Population With Higher Fall and Fragility Injury Burden
The trauma care centers market is also being pushed upward by the growing older adult population and its higher injury intensity. The CDC reported that more than 14 million older Americans, or 1 in 4, experienced falls each year, which keeps fracture, pelvic injury, and traumatic brain injury volumes high in mature care systems. Spending on non-fatal falls among older adults reached USD 50 billion in the United States, which shows why geriatric trauma now carries both volume and cost weight for providers. The older population in the United States is projected to reach 74 million by 2030, which points to a larger future base for inpatient recovery and rehabilitation demand. The American College of Surgeons also updated traumatic brain injury guidance to include early rehabilitation expectations, which makes geriatric trauma more central to how the trauma care centers market organizes clinical pathways.
Shortage Of Board-Certified Trauma Surgeons And Specialized Critical Care Staff
The most persistent operating constraint in the trauma care centers market remains the shortage of surgeons and specialized staff. The Association of American Medical Colleges projected a shortfall of 10,000 to 19,900 surgeons by 2036, which directly limits staffing depth for centers that need continuous attending coverage. A 2025 EAST multicenter study found measurable acute care surgeon shortfalls across U.S. facilities when workload benchmarks were applied, which confirms that the gap is already visible in operating practice. The age mix of the workforce adds more pressure because a large share of surgeons are already near retirement age. Since Level I and Level II verification depends on 24/7 attending coverage, the trauma care centers market cannot solve this problem with capital spending alone.
Other drivers and restraints analyzed in the detailed report include:
- Adoption of AI-Enabled Triage and Imaging Workflows
- Expansion of Regionalized Trauma Networks and Referral Pathways
- High Capital Intensity For Level I And Level II Trauma Readiness
For complete list of drivers and restraints, kindly check the Table Of Contents.
Segment Analysis
In-house trauma facilities held 72.31% share in 2025, which made them the dominant operating model across the trauma care centers market. Their lead reflects the practical value of shared operating rooms, blood banks, imaging departments, and post-acute beds inside a broader hospital campus. That shared platform lowers the incremental cost of trauma readiness and supports better continuity between emergency treatment, surgery, and recovery. It also gives hospital groups more flexibility when they need to balance trauma demand against other acute care service lines.
Cross-departmental subsidization remains a major reason these facilities stay ahead because trauma readiness costs can be spread across a wider patient base. Standalone centers are still forecast to grow at an 8.38% CAGR through 2031, showing that purpose-built models are gaining traction in specific urban and peri-urban corridors. They are especially relevant where public hospital campuses are overcrowded and private operators see room to serve insured trauma volumes more directly. A 2025 study on trauma network expansion found that well-placed standalone units near rural communities can improve access without the full cost of building a complete hospital campus.
Falls accounted for 35.24% share in 2025, which kept them at the center of the trauma care centers market by revenue. This pattern is tied to the high incidence of hip fractures, pelvic injuries, and traumatic brain injuries among people aged 65 years and above. In mature health systems, these patients often need longer inpatient care and higher rehabilitation support than many younger cohorts. That makes falls both a large-volume and high-resource category for trauma operators.
Traffic-related injuries are projected to grow at an 8.52% CAGR through 2031, which makes them the fastest-growing trauma type. Continued motorization in low-income and middle-income regions, especially where powered 2-wheel transport is common, is keeping severe crash exposure elevated. Brain injury remains a smaller segment by volume but it consumes disproportionate ICU, neurosurgical, and neurorehabilitation capacity. Burn injury is also smaller by volume, yet it requires highly specialized wound care and clinical infrastructure that many general trauma wards cannot provide. Taken together, these patterns show that the trauma care centers market depends on a balanced case mix where large-volume falls support revenue while high-acuity traffic, brain, and burn cases drive capability investment.
Complete Report Scope:
- By Facility Type
- In-House
- Standalone
- By Trauma Type
- Falls
- Traffic-Related Injuries
- Stab, Wound, and Cut Injuries
- Burn Injury
- Brain Injury
- By Service Type
- Outpatient
- Inpatient
- Rehabilitation
- By Trauma Center Level
- Level I
- Level II
- Level III
- Level IV
- Level V
- By Patient Age Group
- Adult
- Pediatric
- Geriatric
- By Mode of Admission
- Ambulance-Based
- Walk-In and Direct Admission
- Air Medical Transport
- Inter-Hospital Transfers
- By Geography
- North America
- United States
- Canada
- Mexico
- Europe
- Germany
- United Kingdom
- France
- Italy
- Spain
- Rest of Europe
- Asia-Pacific
- China
- Japan
- India
- Australia
- South Korea
- Rest of Asia-Pacific
- Middle East and Africa
- GCC
- South Africa
- Rest of Middle East and Africa
- South America
- Brazil
- Argentina
- Rest of South America
- North America
Geography Analysis
North America held 36.61% share in 2025, which kept it as the largest regional position in the trauma care centers market. The region benefits from one of the densest networks of designated trauma facilities and from established reimbursement structures tied to Medicare and Medicaid. The United States is still adding designation depth, with Lakeland Regional Health elevated to Florida's 12th Level I trauma center in June 2026 and Cleveland Clinic pursuing Level I status at its main campus after securing a USD 50 million grant in March 2026. Workforce shortages and readiness funding gaps remain the region's main structural limits, which continues to support consolidation toward large integrated systems.
Europe remains divided between mature western systems and central and eastern markets that are still expanding infrastructure. Austria's AUVA Traumazentrum Brigittenau completed its modular expansion in mid-2026, while the broader Trauma-Campus Wien model will integrate acute and rehabilitation services under one structure from 2027. Germany added more capacity through a EUR 1.7 billion (USD 1.9 billion) investment in the northern campus expansion of Universitatsklinikum Wurzburg and through the opening of Klinikum Bielefeld's new emergency and intensive care center in June 2026. Norway's BEST program met its founding goal in 2025, making team training compulsory across hospitals in the national trauma plan and reinforcing quality standardization as a regional benchmark.
Asia-Pacific is projected to grow at an 8.15% CAGR through 2031, making it the fastest-growing regional block in the trauma care centers market. That growth is supported by large population exposure, persistent road injury burdens, and wider public investment in trauma infrastructure and referral pathways. Governments and hospital operators across the region are expanding stabilization capacity, transfer coordination, and rehabilitation support to relieve pressure on tertiary facilities. Middle East and Africa remain smaller but are growing as GCC states incorporate trauma capacity into national healthcare transformation programs. South America also remains smaller, with Brazil leading urban trauma system investment and South Africa supporting gradual modernization that can widen future regional designation capacity.
- Ascension Health Alliance
- Banner Health
- Cedars-Sinai Health System
- CommonSpirit Health
- Community Health Systems, Inc.
- HCA Healthcare, Inc.
- Intermountain Health
- Mayo Foundation for Medical Education and Research
- MedStar Health, Inc.
- Memorial Hermann Health System
- Northwell Health, Inc.
- Providence Health & Services
- Stanford Health Care
- Sutter Health
- Tenet Healthcare
- The Cleveland Clinic Foundation
- The Johns Hopkins Health System Corporation
- University Health System
- University of California Health
- UPMC
Additional Benefits:
- The market estimate (ME) sheet in Excel format
- 3 months of analyst support
TABLE OF CONTENTS
1 Introduction
- 1.1 Study Assumptions & Market Definition
- 1.2 Scope of the Study
2 Research Methodology
3 Executive Summary
4 Market Landscape
- 4.1 Market Overview
- 4.2 Market Drivers
- 4.2.1 Rising Road Traffic Injuries and Polytrauma Caseloads
- 4.2.2 Aging Population With Higher Fall and Fragility Injury Burden
- 4.2.3 Expansion of Regionalized Trauma Networks and Referral Pathways
- 4.2.4 Adoption of AI-Enabled Triage and Imaging Workflows
- 4.2.5 Post-Acute Rehabilitation Integration Improving Survival and Throughput
- 4.2.6 Trauma Resilience Planning in Urban Mobility, Mass-Casualty, and Disaster Preparedness
- 4.3 Market Restraints
- 4.3.1 Shortage of Board-Certified Trauma Surgeons and Specialized Critical Care Staff
- 4.3.2 High Capital Intensity for Level I and Level II Trauma Readiness
- 4.3.3 Uneven Reimbursement for Readiness Costs and Uncompensated Trauma Volume
- 4.3.4 Interoperability Gaps Across EMS, ED, Imaging, and Transfer Networks
- 4.4 Value Chain Analysis
- 4.5 Regulatory Landscape
- 4.6 Technological Outlook
- 4.7 Porter's Five Forces Analysis
- 4.7.1 Threat of New Entrants
- 4.7.2 Bargaining Power of Suppliers
- 4.7.3 Bargaining Power of Buyers
- 4.7.4 Threat of Substitutes
- 4.7.5 Competitive Rivalry
5 Market Size & Growth Forecasts (Value, USD)
- 5.1 By Facility Type
- 5.1.1 In-House
- 5.1.2 Standalone
- 5.2 By Trauma Type
- 5.2.1 Falls
- 5.2.2 Traffic-Related Injuries
- 5.2.3 Stab, Wound, and Cut Injuries
- 5.2.4 Burn Injury
- 5.2.5 Brain Injury
- 5.3 By Service Type
- 5.3.1 Outpatient
- 5.3.2 Inpatient
- 5.3.3 Rehabilitation
- 5.4 By Trauma Center Level
- 5.4.1 Level I
- 5.4.2 Level II
- 5.4.3 Level III
- 5.4.4 Level IV
- 5.4.5 Level V
- 5.5 By Patient Age Group
- 5.5.1 Adult
- 5.5.2 Pediatric
- 5.5.3 Geriatric
- 5.6 By Mode of Admission
- 5.6.1 Ambulance-Based
- 5.6.2 Walk-In and Direct Admission
- 5.6.3 Air Medical Transport
- 5.6.4 Inter-Hospital Transfers
- 5.7 By Geography
- 5.7.1 North America
- 5.7.1.1 United States
- 5.7.1.2 Canada
- 5.7.1.3 Mexico
- 5.7.2 Europe
- 5.7.2.1 Germany
- 5.7.2.2 United Kingdom
- 5.7.2.3 France
- 5.7.2.4 Italy
- 5.7.2.5 Spain
- 5.7.2.6 Rest of Europe
- 5.7.3 Asia-Pacific
- 5.7.3.1 China
- 5.7.3.2 Japan
- 5.7.3.3 India
- 5.7.3.4 Australia
- 5.7.3.5 South Korea
- 5.7.3.6 Rest of Asia-Pacific
- 5.7.4 Middle East and Africa
- 5.7.4.1 GCC
- 5.7.4.2 South Africa
- 5.7.4.3 Rest of Middle East and Africa
- 5.7.5 South America
- 5.7.5.1 Brazil
- 5.7.5.2 Argentina
- 5.7.5.3 Rest of South America
- 5.7.1 North America
6 Competitive Landscape
- 6.1 Market Concentration
- 6.2 Market Share Analysis
- 6.3 Company Profiles (includes Global Level Overview, Market Level Overview, Core Segments, Financials as available, Strategic Information, Market Rank/Share, Products and Services, Recent Developments)
- 6.3.1 Ascension Health Alliance
- 6.3.2 Banner Health
- 6.3.3 Cedars-Sinai Health System
- 6.3.4 CommonSpirit Health
- 6.3.5 Community Health Systems, Inc.
- 6.3.6 HCA Healthcare, Inc.
- 6.3.7 Intermountain Health
- 6.3.8 Mayo Foundation for Medical Education and Research
- 6.3.9 MedStar Health, Inc.
- 6.3.10 Memorial Hermann Health System
- 6.3.11 Northwell Health, Inc.
- 6.3.12 Providence Health & Services
- 6.3.13 Stanford Health Care
- 6.3.14 Sutter Health
- 6.3.15 Tenet Healthcare Corporation
- 6.3.16 The Cleveland Clinic Foundation
- 6.3.17 The Johns Hopkins Health System Corporation
- 6.3.18 University Health System
- 6.3.19 University of California Health
- 6.3.20 UPMC
7 Market Opportunities & Future Outlook
- 7.1 White-Space and Unmet-Need Assessment


