|
시장보고서
상품코드
2100039
OLED 시장 : 점유율 분석, 업계 동향 및 통계, 성장 예측(2026-2031년)OLED - Market Share Analysis, Industry Trends & Statistics, Growth Forecasts (2026 - 2031) |
||||||
 Mordor Intelligence
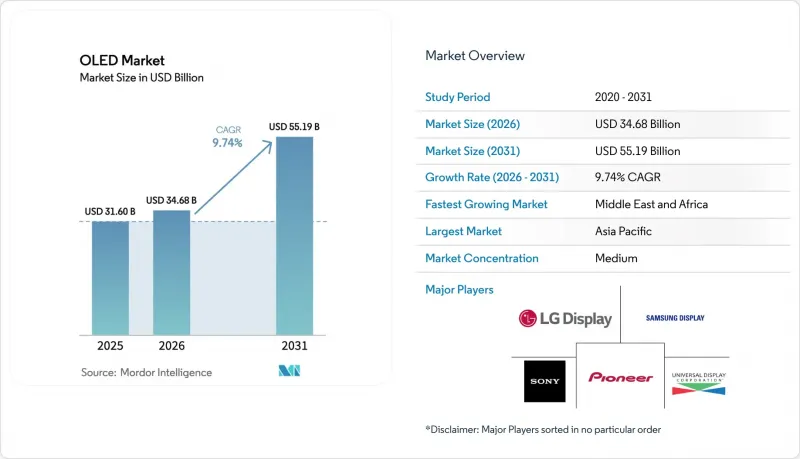
Mordor Intelligence에 의하면, 2026년 OLED 시장 규모는 346억 8,000만 달러로 추정되고 있어 2025년 316억 달러에서 확대해, 2031년에는 551억 9,000만 달러에 이를 것으로 예측됩니다.
2026년부터 2031년까지 연평균 성장률(CAGR) 9.74%로 성장할 것으로 전망됩니다.
본 보고서는 제품 유형(디스플레이, 조명), 기술(패시브 매트릭스 OLED(PMOLED), 액티브 매트릭스 OLED(AMOLED)), 폼 팩터 유형(플렉서블, 리지드, 투명), 소재(기판 소재, 봉지 소재 등), 용도(모바일·태블릿, TV, 자동차용 디스플레이 등), 지역별로 분류되어 있습니다. 시장 전망은 금액(달러) 기준으로 제시되어 있습니다.
세계 OLED 시장 동향 및 인사이트
폴더블 스마트폰의 보급 확대가 플렉서블 AMOLED 수요를 견인
폴더블 스마트폰의 등장으로 OLED 기판에 요구되는 기계적 요건이 높아지면서, 업계의 관심은 리지드 유리에서 180도 굽힘에도 박리되지 않고 견딜 수 있는 탄력성 있는 폴리이미드 필름으로 이동하고 있습니다. 중국 제조업체들은 한국의 기존 제조업체들과의 기술 격차를 급속히 좁히며 OLED 시장에 대량 생산 능력을 지속적으로 투입하고 있어, 가격 경쟁과 새로운 디자인의 가능성을 촉진하고 있습니다. 접이식 단말기의 세대가 거듭될수록 얻은 인사이트력은 향후 2년 이내에 등장할 것으로 예상되는 상용 롤업형 스마트폰 및 태블릿의 기반을 마련하고 있습니다. 이러한 전환을 성공시키기 위해서는 수율 저하를 상쇄하면서도 대중 시장을 겨냥한 가격 책정에서 신뢰성에 대한 기대에 부응하는 스케일링 전략이 핵심이 될 것입니다. 소비자의 인지도가 높아짐에 따라, 유연한 아키텍처는 비평면적인 표면이 주류를 이루는 자동차 인포테인먼트 및 건축 분야로의 통합에서 수요를 불러일으킬 것으로 예측됩니다.
대면적 패널의 비용 감소에 따른 OLED TV의 급속한 보급
2024년 4분기, OLED TV 출하 대수는 200만 대를 돌파했으며, 북미 및 서유럽 수요 급증에 힘입어 전년 대비 12.6%의 성장률을 기록했습니다. 기존 LCD 생산 라인이 폐지되면서 생산 능력 제약은 여전히 두드러졌으나, 적극적인 비용 절감을 통해 77인치 OLED와 동일한 크기의 미니 LED LCD 세트와의 가격 차이는 축소되었습니다. LG디스플레이가 Samsung Electronics에 백색 OLED를 공급하는 등의 전략적 조달 계약은 미니 LED의 부상에 맞서 OLED의 프리미엄 시장을 지키기 위해서는 규모 확대가 필수적이라는 인식을 뒷받침하고 있습니다. 청색 형광 소재와 탠덤 스택 구조의 발전으로, 현재는 1,500니트를 넘는 피크 휘도를 현저히 낮은 전력 소비로 구현할 수 있는 패널이 가능해졌습니다. 다음 성장의 물결은 소매 가격이 1,000달러 미만인 42-55인치 메인스트림 모델의 확대에 달려 있습니다.
8.5세대 기판의 수율 문제가 대형 패널 공급을 제한하고 있습니다.
6세대에서 8.5세대로 넘어가며 마더 글라스 크기가 확대됨에 따라, 결함 전파가 기하급수적으로 증가하여 수율을 저하시키고 제곱미터당 비용을 상승시키고 있습니다. 애플라이드 머티리얼즈의 MAX-OLED와 같은 마스크리스 증착 플랫폼은 픽셀 단위의 패터닝을 가능하게 하여, 대형 기판에서 개구율을 2배, 휘도를 3배 높이는 동시에 수명을 5배 연장할 가능성이 있습니다. 파일럿 라인은 2025년 초 상용 샘플 제공을 목표로 하고 있지만, 높은 자본 집약도와 공정에 대한 미숙함이 도입 리스크로 작용하고 있습니다. 재팬 디스플레이의 포토리소그래피 기술 ‘eLeap’은 시험 가동에서 60% 이상의 수율을 달성한 것으로 보고되어, 대면적 생산의 효율화를 위한 또 다른 길을 제시하고 있습니다. 현재 각 패널 제조업체들은 처리량, 재료 이용률, 결함 관리 간의 상충 관계로 어려움을 겪고 있으며, TV 및 사이니지 시장에서 미니 LED의 부상에 대응할 수 있는 생산 능력 확대가 지연되고 있습니다.
부문 분석
2025년 OLED 시장 매출액 중 디스플레이 모듈이 90.85%를 차지했습니다. 이는 스마트폰에서의 두 자릿수 보급률과 TV에서의 채택 확대에 힘입어 그 입지가 강화된 결과입니다. 조명 분야의 OLED 시장 규모는 여전히 작지만, 초슬림 폼 팩터와 눈부심 없는 표면이 고급 업무 공간 및 자동차 앰비언트 조명 시스템에서 받아들여짐에 따라 연평균 성장률(CAGR) 12.28%로 확대될 것으로 예측됩니다. OLED 시장은 공통 TFT 백플레인의 재사용, 컬러 필터에 대한 잉크젯 인쇄, 드라이버 IC 플랫폼 공유와 같은 반복적인 비용 절감 노력의 혜택을 받고 있으며, 이러한 노력들은 소형 및 대형 디스플레이 모두에서 학습 곡선을 단축시키고 있습니다. 독일의 OLEDWorks와 일본의 코니카미놀타를 필두로 한 각 조명 제조업체들은 점광원에 의한 눈부심이 없어 높은 가격 수용성이 요구되는 고급 호텔용 조명 기구 분야에서 틈새 시장을 공략하고 있습니다. EU의 에코디자인 규정을 준수함으로써 에너지 효율과 재활용성 두 가지 기준을 모두 충족하는 OLED 패널에 대한 호재가 더욱 강화되어, 시장을 독점하고 있는 LED 스트립과의 격차를 좁혀가고 있습니다.
OLED 시장은 현재 전환점을 맞이하고 있으며, 조명 공급업체들은 건축용 다운라이트 이외의 분야에서 양산을 모색하고, 자동차 테일램프, 민간 항공기 객실, 나아가 발광형 포인트 카드 등을 타겟으로 삼고 있습니다. 기존 LED 제조업체들이 1킬로루멘당 2달러 미만의 가격을 적극적으로 제시하는 한편, 탠덤 스택형 OLED 라이트 엔진은 소비 전력을 40% 절감하고 100 lm/W의 광속 효율이라는 이정표를 달성하여, 금세기 말에는 비용 평준화가 실현될 가능성이 높다는 점이 시사되고 있습니다. 각 디스플레이 업체들은 비수기에 6세대 모바일 생산 라인을 조명 제품의 시제품 생산에 활용하는 등 시너지 효과를 모색하고 있습니다. 이를 통해 감가상각비를 분산시키는 동시에 차세대 롤-투-롤(roll-to-roll) 밀봉 포일의 검증을 진행하고 있습니다. 디스플레이와 조명 분야의 융합이 성공하면, 2030년까지 조명 분야에서 OLED 시장 점유율을 현재의 한 자릿수대에서 끌어올릴 수 있으며, 이는 패널 제조업체의 장기적인 사업 다각화의 기반이 될 것입니다.
2025년에는 120Hz 및 가변 주사율을 지원하는 게이밍 용도를 뒷받침하는 박막 트랜지스터(TFT)를 기반으로, 액티브 매트릭스 OLED 패널이 출하량의 95.55%를 차지하며 시장을 휩쓸었습니다. OLED 시장은 탠덤 스택, LTPO 백플레인, 하이브리드 양자점 색상 변환과 같은 AMOLED 로드맵을 높이 평가하고 있으며, 삼성, 애플, 샤오미의 각 플래그십 모델에서 지속적인 채택률을 보이고 있습니다. 패시브 매트릭스 OLED(PMOLED)는 단순한 웨어러블 기기, 산업용 계측기, 스마트 카드 분야에서 여전히 중요한 위치를 차지하고 있습니다. PMOLED의 예상 연평균 성장률(CAGR) 10.08%는 포토리소그래피 공정을 생략한 비용 효율적인 잉크젯 방식의 프론트플레인에 의해 주도되고 있습니다. PMOLED의 OLED 시장 규모는 여전히 작지만, 디스플레이 내장 안테나 및 결제용 토큰의 보급에 따라 전략적으로 중요한 위치를 차지하고 있습니다.
그러나 AMOLED의 주도적 지위는 더 높은 개구율과 색 용적을 약속하는 마스크리스 포토리소그래피, eLeap 픽셀 분할, 그리고 레이저 유도 양자점 패터닝에 의해 도전받고 있습니다. 패널 제조업체들은 새로운 공정의 이점과 드라이버 IC, 리지드 메탈 마스크 공급업체, 현행 적층 구조에 최적화된 포토레지스트 등 생태계에 깊이 뿌리내린 LTPO 공급망 간의 균형을 맞추어야 합니다. 2025년 하반기에 양산이 시작될 예정인 청색 인광 기술의 도입으로, AMOLED는 배터리 용량이 제한된 폴더블 단말기나 VR 헤드셋에 매우 중요한 15%의 에너지 절약 효과를 얻을 수 있게 될 것입니다. 하지만 미니 LED LCD는 플리커가 적고 두 개의 피크를 가진 밝기를 구현하고 있어, AMOLED 역시 2,000니트를 넘는 밝기를 실현하면서도 번인 위험을 줄여야 할 필요가 있습니다. OLED 시장이 이러한 과제를 어느 정도 효과적으로 극복할 수 있느냐에 따라, AMOLED가 향후 10년 동안에도 거의 독점적인 지위를 유지할 수 있을지가 결정될 것입니다.
지역별 분석
아시아태평양은 2025년 매출의 44.05%를 차지하고 있으며, 이는 유기 소재 제조업체부터 중국과 한국에 집중된 6세대 및 8.5세대 제조 공장에 이르기까지 공급망의 깊은 통합을 반영합니다. 지방 정부의 우대 조치와 장기 설비 융자 덕분에 중국 업체들은 설비 용량 면에서 앞서고 있는 반면, 한국 업체들은 고휘도 프리미엄 분야에서 품질 면에서의 우위를 유지하고 있습니다. 2025년까지 중국은 전 세계 AMOLED 제조 설비의 4분의 3 가까이를 보유할 것으로 예상되며, 이에 따라 OLED 시장 전체의 비용 곡선을 낮추는 학습 곡선이 가속화될 전망입니다. 일본 기업들은 성막 마스크, 미세 금속 섀도잉, 고순도 이미터와 같은 업스트림 공정을 전문으로 하고 있으며, 패널 생산량은 감소하고 있음에도 불구하고 건전한 수출 마진을 유지하고 있습니다.
북미는 대규모 제조 거점이 없음에도 불구하고, 높은 평균 판매 가격(ASP)의 TV와 스마트폰을 통해 부가가치를 창출하고 있으며, 미국의 OLEDWorks와 JDI간의 제휴 등 새로운 제조 이니셔티브도 전개되고 있습니다. 2024년 4분기에는 스트리밍 플랫폼 출시와 맞물린 적극적인 판촉 캠페인의 영향으로, 77-83인치 OLED TV에 대한 지역 수요가 전년 동기 대비 19% 급증했습니다. 유럽은 여전히 2위 소비 시장으로, 에코디자인 규정에 따른 에너지 절약형 가전제품에 대한 강력한 교체 수요와 성숙 시장에서 고품질 오디오비주얼 경험에 대한 선호에 힘입고 있습니다. 특히 독일의 자동차 제조업체들은 차세대 콕핏에 곡면 계기판과 앰비언트 조명을 통합하는 통합 업체와의 제휴를 통해 자동차용 OLED 개발을 주도하고 있습니다.
중동 및 아프리카는 규모는 작지만, 가처분 소득 증가와 소매점 외관 및 정보 키오스크에 투명 패널을 통합하는 스마트 시티 투자에 힘입어 연평균 성장률(CAGR) 11.62%라는 가장 높은 성장 전망을 기록했습니다. 인도에서는 국내 디스플레이 생태계 육성이 진행되고 있습니다. 타타 일렉트로닉스, 히맥스, 파워칩 간의 합의에 따라 6세대 AMOLED 파일럿 라인 가동을 목표로 하고 있으며, 이는 수입 의존도를 낮추려는 정책적 의도를 보여줍니다. 이러한 다각화는 지정학적 공급 리스크를 완화하고, 향후 아프리카 및 동남아시아로의 수출 경로 개척으로 이어질 가능성이 있습니다. 전반적으로, 지역별 산업 정책, 노동 구조, 에너지 비용이 OLED 시장의 설비 투자 배분을 계속해서 좌우할 것입니다.
기타 혜택:
- 엑셀 형식 시장 예측(ME) 시트
- 3개월간의 애널리스트 지원
자주 묻는 질문
목차
제1장 서론
제2장 조사 방법
제3장 주요 요약
제4장 시장 구도
제5장 시장 규모와 성장 예측
제6장 경쟁 구도
제7장 시장 기회와 향후 전망
JHS 26.08.11According to Mordor Intelligence, OLED market size in 2026 is estimated at USD 34.68 billion, growing from 2025 value of USD 31.60 billion with 2031 projections showing USD 55.19 billion, growing at 9.74% CAGR over 2026-2031.
This report is Segmented by Product Type (Display, and Lighting), Technology (Passive Matrix OLED (PMOLED), and Active Matrix OLED (AMOLED)), Form Factor Type (Flexible, Rigid, and Transparent), Material (Substrate Materials, Encapsulation Materials, and More), Application (Mobile and Tablet, Television, Automotive Displays, and More), and Geography. The Market Forecasts are Provided in Terms of Value (USD).
Global OLED Market Trends and Insights
Surge in Foldable Smartphone Adoption Driving Flexible AMOLED Demand
Foldable smartphones have elevated the mechanical requirements placed on OLED substrates, shifting industry focus from rigid glass to resilient polyimide films that tolerate 180-degree bends without delamination. Chinese producers have shortened the time-to-catch-up with Korean incumbents and continue to inject high-volume capacity into the OLED market, fostering price competition and new design possibilities. Continuous learning from foldable iterations is laying the groundwork for commercial rollable phones and tablets expected within two years. Success in this transition will hinge on scaling strategies that absorb yield losses while reinforcing reliability expectations for mass-market pricing. As consumer familiarity increases, flexible architectures are expected to seed demand in automotive infotainment and architectural integration where non-planar surfaces dominate.
Rapid Proliferation of OLED TVs Owing to Cost Declines in Large-Area Panels
Shipments of OLED televisions crossed 2 million units in Q4-2024, reflecting 12.6% annual growth led by demand spikes in North America and Western Europe. Capacity constraints remained evident as legacy LCD lines were retired, yet aggressive cost learning curves have narrowed price gaps between 77-inch OLEDs and similarly sized mini-LED LCD sets. Strategic sourcing agreements, such as LG Display's white-OLED supply to Samsung Electronics, underline a recognition that scale is imperative to defend OLED's premium tier against mini-LED encroachment. Gains in blue phosphorescent materials and tandem-stack architectures now allow panels above 1,500 nits peak brightness at noticeably lower power. The next wave of growth will rely on expanding 42- to 55-inch mainstream models positioned below USD 1,000 at retail.
Yield Challenges in Gen-8.5 Substrates Limiting Large-Format Panel Supply
Scaling from Gen-6 to Gen-8.5 mother-glass size introduces exponential defect propagation, dampening yields and elevating cost per square metre. Mask-free deposition platforms such as Applied Materials' MAX-OLED enable pixel-by-pixel patterning, potentially doubling aperture ratio and tripling brightness while extending lifetime five-fold on large substrates. Pilot lines are targeting commercial sampling in early 2025, yet capital intensity and process unfamiliarity pose adoption risks. Japan Display's eLeap photolithographic approach reported yields above 60% on trial runs, signalling alternate paths to large-area efficiency. For now, panel makers juggle trade-offs among throughput, material utilisation and defect management, delaying capacity that could counter mini-LED encroachment in televisions and signage.
Other drivers and restraints analyzed in the detailed report include:
- Automotive Cockpit Digitisation Accelerating Demand for Curved OLED Displays
- Government Incentives for Energy-Efficient Solid-State Lighting in Europe and Asia
- Patent Thicket Around Phosphorescent Emitters Increasing Royalty Burden
For complete list of drivers and restraints, kindly check the Table Of Contents.
Segment Analysis
Display modules represented 90.85% of OLED market revenue in 2025, a position fortified by double-digit smartphone penetration and mounting television uptake. The OLED market size for lighting remained modest yet accelerated with a 12.28% CAGR forecast, as ultrathin form factors and glare-free surfaces found acceptance in premium workspace and automotive ambient systems. The OLED market has benefited from iterative cost down initiatives-re-use of common TFT backplanes, ink-jet printing for colour filters and shared driver IC platforms-that compress learning curves across both small and large displays. Lighting manufacturers, led by OLEDWorks in Germany and Konica Minolta in Japan, continue niche deployment in premium hospitality luminaires where the absence of point glare commands a high willingness to pay. Compliance with EU ecodesign rules places added momentum behind OLED panels that satisfy both energy and recyclability metrics, narrowing the gap with dominant LED strips.
The OLED market now approaches an inflection where lighting suppliers seek volume outside architectural downlights, targeting vehicular taillamps, commercial aircraft cabins and even illuminated loyalty cards. While LED incumbents price aggressively below USD 2 per kilolumen, tandem-stack OLED light engines have posted 40% power drops and 100 lm/W efficacy milestones, suggesting cost parity is plausible late-decade. Display vendors are exploring synergies-using Gen-6 mobile lines for pilot lighting runs during off-peak cycles-to spread depreciation and validate next-gen roll-to-roll encapsulation foils. Successful convergence across display and lighting could elevate the overall OLED market share of lighting above current single-digit levels by 2030, underpinning long-term diversification for panel makers.
Active-matrix OLED panels dominated with 95.55% of shipments in 2025, anchored by thin-film transistors that support 120 Hz and variable refresh gaming workloads. The OLED market has rewarded the AMOLED roadmap-tandem stacks, LTPO backplanes and hybrid quantum-dot colour conversion-with sustained attach rates across flagships from Samsung, Apple and Xiaomi. Passive-matrix OLED retains relevance in simple wearables, industrial gauges and smart-cards; its projected 10.08% CAGR is propelled by cost-effective ink-jet frontplanes that skip photolithography steps. The OLED market size for PMOLED remains small yet strategically important as antenna-in-display concepts and payment tokens proliferate.
AMOLED's leadership, however, is being tested by mask-free photolithography, eLeap pixel-division, and laser-induced quantum-dot patterning that promise higher aperture and colour volume. Panel makers must balance the benefit of new processes against the ecosystem's entrenched LTPO supply chain: driver ICs, rigid metal-mask suppliers and photoresists optimised for current stacks. Blue phosphorescent adoption, tabled for mass launch in late 2025, will grant AMOLED a 15% energy advantage crucial for battery-constrained foldables and VR headsets. Nevertheless, mini-LED LCDs have shown double-peak brightness with lower flicker, pressuring AMOLED to deliver above 2,000 nits while mitigating image-retention risks. How effectively the OLED market internalises these challenges will dictate whether AMOLED preserves its near-monopoly into the next decade.
Complete Report Scope:
- By Product Type
- Display
- Lighting
- By Technology
- Passive Matrix OLED (PMOLED)
- Active Matrix OLED (AMOLED)
- By Form Factor Type
- Flexible
- Rigid
- Transparent
- By Material
- Substrate Materials
- Encapsulation Materials
- Emitter and Conductive Materials
- Backplane and Other Materials
- By Application
- Mobile and Tablet
- Television
- Automotive Displays
- Smartwatches and Wearables
- Digital Signage and Large-Format Display
- PC Monitors and Laptops
- Other Applications
- By Geography
- North America
- United States
- Canada
- Mexico
- Europe
- Germany
- United Kingdom
- France
- Nordics
- Rest of Europe
- South America
- Brazil
- Rest of South America
- Asia-Pacific
- China
- Japan
- India
- South-East Asia
- Rest of Asia-Pacific
- Middle East and Africa
- Middle East
- Gulf Cooperation Council Countries
- Turkey
- Rest of Middle East
- Africa
- South Africa
- Rest of Africa
- Middle East
- North America
Geography Analysis
Asia-Pacific contributed 44.05% of 2025 revenue, reflecting deep supply-chain integration from organic material producers to Gen-6 and Gen-8.5 fabs concentrated in China and South Korea. Municipal incentives and long-term equipment financing enable Chinese vendors to pull ahead on installed capacity, even as Korean peers preserve a quality lead at the high-brightness premium end. By 2025, China is projected to host nearly three-quarters of global AMOLED tooling footprints, accelerating the learning rate that compresses cost curves for the entire OLED market. Japanese firms specialise upstream in deposition masks, fine metal shadowing and high-purity emitters, maintaining healthy export margins despite diminished panel output.
North America, while lacking large-scale fab presence, drives value via high ASP televisions and smartphones, and hosts emerging manufacturing initiatives such as the OLEDWorks-JDI alliance in the United States. Regional demand for 77- to 83-inch OLED TVs surged 19% year-on-year in Q4-2024, influenced by aggressive promotional cycles tied to streaming platform launches. Europe remains the second-largest consumption hub, buoyed by strong replacement demand for energy-efficient appliances under ecodesign mandates and a preference for premium audio-visual experiences in mature markets. German automakers in particular catalyse automotive OLED development through integrator partnerships that embed curved clusters and ambient lighting into next-gen cockpits.
The Middle East and Africa recorded the fastest 11.62% CAGR outlook on a small base, supported by rising disposable income and smart-city investments that integrate transparent panels in retail facades and information kiosks. India is nurturing a domestic display ecosystem; agreements between Tata Electronics, Himax and Powerchip aim to launch a 6-Gen AMOLED pilot line, signalling policy intent to reduce reliance on imports. Such diversification mitigates geopolitical supply risks and may unlock future export corridors into Africa and Southeast Asia. Overall, geography-specific industrial policies, labour structures and energy costs will continue to influence the distribution of capital expenditure across the OLED market.
- Samsung Display Co., Ltd.
- LG Display Co., Ltd.
- BOE Technology Group Co., Ltd.
- Tianma Microelectronics Co., Ltd.
- Visionox Technology Inc.
- TCL China Star Optoelectronics Technology Co., Ltd.
- Sharp Corporation
- Sony Corporation
- Universal Display Corporation
- Pioneer Corporation
- OLEDWorks LLC
- OSRAM Opto Semiconductors GmbH
- Winstar Display Co., Ltd.
- Raystar Optronics Inc.
- Ritek Corporation
- WiseChip Semiconductor Inc.
- AUO Corporation
- Acuity Brands, Inc.
- Yeolight Technology Co., Ltd.
- Hella GmbH and Co. KGaA
- Kopin Corporation
- Pixelligent Technologies, Inc.
Additional Benefits:
- The market estimate (ME) sheet in Excel format
- 3 months of analyst support
TABLE OF CONTENTS
1 INTRODUCTION
- 1.1 Study Assumptions and Market Definition
- 1.2 Scope of the Study
2 RESEARCH METHODOLOGY
3 EXECUTIVE SUMMARY
4 MARKET LANDSCAPE
- 4.1 Market Overview
- 4.2 Market Drivers
- 4.2.1 Surge in foldable smartphone adoption driving flexible AMOLED demand
- 4.2.2 Rapid proliferation of OLED TVs owing to cost declines in large-area panels
- 4.2.3 Automotive cockpit digitization accelerating demand for curved OLED displays
- 4.2.4 Government incentives for energy-efficient solid-state lighting in Europe and Asia
- 4.2.5 Hybrid QD-OLED technology enabling premium color gamut in high-end monitors
- 4.3 Market Restraints
- 4.3.1 Yield challenges in Gen-8.5 substrates limiting large-format panel supply
- 4.3.2 Patent thicket around phosphorescent emitters increasing royalty burden
- 4.3.3 Micro-LED maturation threatening OLED competitiveness in outdoor signage
- 4.4 Industry Ecosystem Analysis
- 4.5 Technological Outlook
- 4.6 Porter's Five Forces Analysis
- 4.6.1 Bargaining Power of Suppliers
- 4.6.2 Bargaining Power of Buyers
- 4.6.3 Threat of New Entrants
- 4.6.4 Threat of Substitutes
- 4.6.5 Intensity of Competitive Rivalry
5 MARKET SIZE AND GROWTH FORECASTS (VALUES)
- 5.1 By Product Type
- 5.1.1 Display
- 5.1.2 Lighting
- 5.2 By Technology
- 5.2.1 Passive Matrix OLED (PMOLED)
- 5.2.2 Active Matrix OLED (AMOLED)
- 5.3 By Form Factor Type
- 5.3.1 Flexible
- 5.3.2 Rigid
- 5.3.3 Transparent
- 5.4 By Material
- 5.4.1 Substrate Materials
- 5.4.2 Encapsulation Materials
- 5.4.3 Emitter and Conductive Materials
- 5.4.4 Backplane and Other Materials
- 5.5 By Application
- 5.5.1 Mobile and Tablet
- 5.5.2 Television
- 5.5.3 Automotive Displays
- 5.5.4 Smartwatches and Wearables
- 5.5.5 Digital Signage and Large-Format Display
- 5.5.6 PC Monitors and Laptops
- 5.5.7 Other Applications
- 5.6 By Geography
- 5.6.1 North America
- 5.6.1.1 United States
- 5.6.1.2 Canada
- 5.6.1.3 Mexico
- 5.6.2 Europe
- 5.6.2.1 Germany
- 5.6.2.2 United Kingdom
- 5.6.2.3 France
- 5.6.2.4 Nordics
- 5.6.2.5 Rest of Europe
- 5.6.3 South America
- 5.6.3.1 Brazil
- 5.6.3.2 Rest of South America
- 5.6.4 Asia-Pacific
- 5.6.4.1 China
- 5.6.4.2 Japan
- 5.6.4.3 India
- 5.6.4.4 South-East Asia
- 5.6.4.5 Rest of Asia-Pacific
- 5.6.5 Middle East and Africa
- 5.6.5.1 Middle East
- 5.6.5.1.1 Gulf Cooperation Council Countries
- 5.6.5.1.2 Turkey
- 5.6.5.1.3 Rest of Middle East
- 5.6.5.2 Africa
- 5.6.5.2.1 South Africa
- 5.6.5.2.2 Rest of Africa
- 5.6.5.1 Middle East
- 5.6.1 North America
6 COMPETITIVE LANDSCAPE
- 6.1 Market Concentration
- 6.2 Strategic Moves
- 6.3 Market Share Analysis
- 6.4 Company Profiles (includes Global level Overview, Market level overview, Core Segments, Financials as available, Strategic Information, Market Rank/Share, Products and Services, Recent Developments)
- 6.4.1 Samsung Display Co., Ltd.
- 6.4.2 LG Display Co., Ltd.
- 6.4.3 BOE Technology Group Co., Ltd.
- 6.4.4 Tianma Microelectronics Co., Ltd.
- 6.4.5 Visionox Technology Inc.
- 6.4.6 TCL China Star Optoelectronics Technology Co., Ltd.
- 6.4.7 Sharp Corporation
- 6.4.8 Sony Corporation
- 6.4.9 Universal Display Corporation
- 6.4.10 Pioneer Corporation
- 6.4.11 OLEDWorks LLC
- 6.4.12 OSRAM Opto Semiconductors GmbH
- 6.4.13 Winstar Display Co., Ltd.
- 6.4.14 Raystar Optronics Inc.
- 6.4.15 Ritek Corporation
- 6.4.16 WiseChip Semiconductor Inc.
- 6.4.17 AUO Corporation
- 6.4.18 Acuity Brands, Inc.
- 6.4.19 Yeolight Technology Co., Ltd.
- 6.4.20 Hella GmbH and Co. KGaA
- 6.4.21 Kopin Corporation
- 6.4.22 Pixelligent Technologies, Inc.
7 MARKET OPPORTUNITIES AND FUTURE OUTLOOK
- 7.1 White-space and Unmet-need Assessment