

|
시장보고서
상품코드
2100263
공급망 분석 시장 : 시장 점유율 분석, 업계 동향 및 통계, 성장 예측(2026-2031년)Supply Chain Analytics - Market Share Analysis, Industry Trends & Statistics, Growth Forecasts (2026 - 2031) |
||||||
 Mordor Intelligence
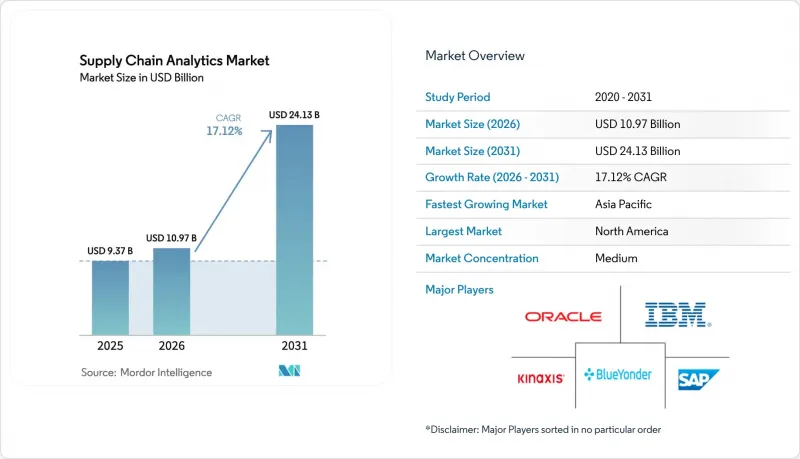
Mordor Intelligence에 의하면, 2026년 공급망 분석 시장 규모는 109억 7,000만 달러로 추정되고, 2025년 93억 7,000만 달러에서 확대해, 2031년에는 241억 3,000만 달러에 이를 것으로 예측됩니다.
2026-2031년 연평균 성장률(CAGR) 17.12%로 성장할 것으로 전망됩니다.
본 보고서는 컴포넌트별(소프트웨어 (수요 계획 및 예측 등)), 도입 형태별(온프레미스, 클라우드 등), 분석 유형별(기술적 분석 등), 용도별(재고 관리 등), 최종 이용 산업별(소매 및 전자상거래 등), 기업 규모별(대기업 등), 지역별로 분류되어 있습니다.
세계의 공급망 분석 시장 동향 및 인사이트
소매 및 전자상거래 분야의 주문 처리 효율화
주요 하이라이트
- 온라인 수요의 폭발적인 증가로 인해 배송 시간대가 단축되면서, 소매업체들은 주문, 재고, 운송의 각 단계에 실시간 분석을 도입할 수밖에 없게 되었습니다. 처방형 엔진이 운송업체 선정 및 재고 배치를 자동화함에 따라, 이를 도입한 기업 중 다수는 주문 이행률을 30% 향상시키고 물류 비용을 25% 절감하는 데 성공했습니다. 예를 들어, Canadian Tire는 변동이 심한 수요 피크 시기에 채널 배분을 최적화하고 네트워크 전반에 걸쳐 최적화를 적용함으로써 매출을 20% 향상시켰습니다. 당일 배송에 대한 기대가 새로운 상품 카테고리로 확대됨에 따라, 공급망 분석 시장은 이익률 유지와 고객 유지에 있어 계속해서 매우 중요한 역할을 할 것입니다.
인더스트리 4.0에 따른 현장 데이터의 급증
네트워크에 연결된 기계에서는 품질, 처리량, 에너지에 관한 실시간 데이터가 스트리밍되어 보다 광범위한 공급망 모델에 활용됨으로써, 종합 설비 효율(OEE)을 최대 15% 향상시키고 품질 비용을 20% 절감할 수 있습니다. OT(운영 기술)와 IT 간의 격차를 해소함으로써, 기획 담당자는 정적인 일정에서 공장의 실시간 상황에 맞춘 동적인 보충 계획으로 전환할 수 있게 됩니다. 예지 보전의 트리거를 통해 자산 수명을 연장하는 한편, 공장의 신호를 공급업체의 스코어카드와 연동함으로써 결함의 근본 원인 분석을 보다 신속하게 수행할 수 있게 됩니다.
데이터 파이프라인에 대한 사이버 공격
기업 간 데이터 흐름은 공격 표면을 확대시키고 있으며, 벌금, 가동 중단 시간, 시정 조치를 합산하면 1건의 침해 사고로 인한 평균 비용은 현재 435만 달러에 달할 전망입니다. 기업들은 제로 트러스트 아키텍처를 통해 위험을 완화하고 있지만, 추가적인 통제 조치는 프로젝트 기간을 연장하고 예산을 증가시킬 가능성이 있어, 공급망 분석 시장의 단기 전망을 둔화시키고 있습니다.
부문 분석
기업들이 수요, 재고, 생산, 물류를 단일 환경에서 모델링하는 통합 제품군에 투자한 결과, 2025년 매출의 66.12%를 소프트웨어가 차지했습니다. 이러한 엔진은 매일 수십억 개의 데이터 포인트를 수집하여 이상 징후를 감지하고 시정 조치를 제안합니다. 그러나 시장의 성장 동력은 서비스 부문이며, 지속적인 가치는 지속적인 조정에 달려 있다는 인식이 기업들 사이에 확산됨에 따라 2031년까지 연평균 성장률(CAGR) 24.6%로 확대되고 있습니다. 각 벤더사는 보상을 재고 회전율 및 서비스 수준 향상과 연계하는 성과 기반 계약을 패키지화하고 있으며, 인센티브를 조율함으로써 공급망 분석 시장의 확장을 뒷받침하고 있습니다.
소프트웨어 분야에서 재고 및 창고 관리 모듈은 여전히 수익의 핵심을 이루고 있습니다. AI를 통한 업그레이드로 인해, 이러한 모듈은 수동적인 대시보드에서 벗어나 인간의 개입 없이 재고 재조정, 인력 스케줄 관리, 창고 슬롯 재배치를 수행하는 자율형 에이전트로 변모하고 있습니다. 오래된 벤더들은 딥러닝 애드온 기능을 사후에 도입하고 있는 반면, 신흥 소규모 벤더들은 강화 학습을 핵심으로 한 클라우드 네이티브 플랫폼을 출시하고 있습니다. 따라서 경쟁의 핵심은 기능 목록의 폭이 아니라 인사이트력을 도출해내는 속도에 있습니다.
2025년에는 신규 도입의 62.31%를 클라우드 호스팅이 차지한 것으로 평가되었으며, 조직이 온프레미스 맞춤형 스택보다 확장 가능한 컴퓨팅 능력과 즉각적인 기능 업데이트를 선호한다는 사실이 입증되었습니다. 데이터 주권에 관한 규제로 인해 기밀성이 높은 워크로드를 사내에 유지해야 하는 경우에도, 비용 효율성 측면에서 배치 분석이나 AI 훈련을 클라우드로 오프로드하는 하이브리드 모델이 지지를 얻고 있습니다. 엣지 노드는 연결 지연이 발생할 경우 트럭 운전석이나 야드 게이트에 경고를 전송하여, 로컬 수준의 자율성과 중앙 차원의 거버넌스를 융합합니다. 이러한 분산형 인프라는 해상 화물의 실시간 추적부터 공동 용량 경매에 이르기까지 여러 기업이 참여하는 이용 사례를 가능하게 하여, 클라우드 벤더에게 있어 공급망 분석 시장 규모를 확대되고 있습니다.
지역별 분석
2025년에는 북미가 40.85%의 점유율로 1위를 차지했습니다. 이는 조기 클라우드 도입, 풍부한 벤처 자금, 그리고 공급망 투명성을 요구하는 규제 당국의 추진력에 기인합니다. 미국의 소매업체들은 예측 배분을 활용하여 매장과 온라인 상점의 재고 균형을 조정하고 있으며, GM과 같은 제조업체들은 생산 능력 제약을 고려한 반도체 조달 전략을 수립하기 위해 분석을 활용하고 있습니다. 반도체의 국내 복귀와 청정 에너지·공급망에 대한 연방 정부의 인센티브로 인해 분석 예산은 더욱 확대되고 있습니다. 이는 기업들이 현지화와 비용·위험을 비교 검토하기 위해 실시간 시나리오 모델링이 필요하기 때문입니다.
아시아태평양은 전자상거래의 급성장, 스마트 팩토리 프로그램, 그리고 클라우드 전환에 대한 정부 보조금의 지원에 힘입어 2031년까지 연평균 성장률(CAGR)이 24.8%에 달하며 가장 빠르게 성장하는 지역입니다. 중국 기업들은 클라우드 플랫폼을 활용하여 광대한 산업 클러스터 내에서 유연한 생산을 조정하고, 공급업체 간의 협력을 도모하고 있습니다(mdpi.com). 인도의 PLI(생산 연계형 인센티브) 제도는 세계 브랜드들이 지역 거점을 구축하도록 촉진하고 있으며, 3차 공급업체까지의 가시성이 이사회에서 필수 요건으로 자리 잡고 있습니다. 일본의 제조업체들은 분석을 활용해 공급업체 생태계를 재설계하고, 자연재해 및 지정학적 위험에 대한 회복탄력성을 높이고 있습니다.
유럽은 엄격한 CSRD 공시를 지원하는 지속가능성 분석을 주도하며 여전히 강력한 존재감을 유지하고 있습니다. 자동차, 항공우주, 화학 기업들은 Confinity-X와 같은 협업 플랫폼을 활용해 수요 예측을 통합하고, 인바운드 물류를 효율화함으로써 배출량과 비용을 모두 절감하고 있습니다. 남미, 중동 및 아프리카는 주로 소비재, 광업, 에너지 무역 루트와 같은 분야에서 소규모 기반에서 확장을 추진하고 있습니다. 이러한 분야에서는 기존에 가시성 부족으로 인해 운전 자본이 부풀어 오르는 문제가 있었습니다. 클라우드 하이퍼스케일러가 뒷받침하는 국경을 초월한 데이터 회랑을 통해, 이러한 신흥 시장에서도 실시간 컨트롤 타워를 통한 전체적인 파악이 가능해졌으며, 공급망 분석 시장의 세계 확장이 더욱 강화되고 있습니다.
기타 혜택 :
- 엑셀 형식 시장 예측(ME) 시트
- 3개월간의 애널리스트 지원
자주 묻는 질문
목차
제1장 서론
제2장 조사 방법
제3장 주요 요약
제4장 시장 구도
제5장 시장 규모 및 성장 예측
제6장 경쟁 구도
제7장 시장 기회 및 향후 동향
AJY 26.08.07According to Mordor Intelligence, supply chain analytics market size in 2026 is estimated at USD 10.97 billion, growing from 2025 value of USD 9.37 billion with 2031 projections showing USD 24.13 billion, growing at 17.12% CAGR over 2026-2031.
This report is Segmented by Component (Software [Demand Planning and Forecasting, and More]), by Deployment (On-Premise, Cloud, and More), by Analytics Type (Descriptive, and More), by Application (Inventory Management, and More), by End-Use Industry (Retail and E-Commerce, and More), by Enterprise Size (Large Enterprises, and More), and Geography.
Global Supply Chain Analytics Market Trends and Insights
Retail e-commerce fulfilment compression
Key Highlights
- Explosive online demand is shrinking delivery windows and forcing retailers to embed real-time analytics across order, stock, and transport nodes. Most adopters achieve 30% higher fulfilment rates and 25% lower logistics costs once prescriptive engines automate carrier selection and inventory placement. Canadian Tire, for instance, improved channel allocation during volatile peaks and lifted sales 20% by applying network-wide optimisation. As same-day delivery expectations spread to new categories, the supply chain analytics market will remain pivotal to margin defence and customer retention.
Industry 4.0 shop-floor data surge
Connected machinery streams live quality, throughput, and energy data that feeds wider supply-chain models, lifting overall equipment effectiveness by up to 15% and cutting quality costs 20% . Closing the OT-IT gap lets planners move from static schedules to dynamic replenishment aligned with real-time plant conditions. Predictive maintenance triggers extend asset life, while linking factory signals to supplier scorecards allows faster root-cause analysis of defects.
Cyber-attacks on data pipelines
Inter-company data flows widen the attack surface, and an average breach now costs USD 4.35 million when fines, downtime, and remediation are tallied . Firms offset risk with zero-trust architectures, but extra controls can lengthen project timelines and inflate budgets, tempering the near-term outlook for the supply chain analytics market.
Other drivers and restraints analyzed in the detailed report include:
- Cloud affordability for analytics stacks
- Post-pandemic multi-tier visibility mandate
- High total cost of legacy upgrades
For complete list of drivers and restraints, kindly check the Table Of Contents.
Segment Analysis
Software claimed 66.12% of 2025 revenue as firms invested in integrated suites that model demand, inventory, production, and logistics in one environment. These engines ingest billions of data points daily, surfacing anomalies and prescribing corrective actions. Yet services are the market's growth engine, advancing at 24.6% CAGR to 2031 as companies grasp that sustained value depends on continuous tuning. Vendors package outcome-based engagements that link fees to inventory turns or service-level gains, aligning incentives and expanding the supply chain analytics market.
Inside software, inventory and warehouse modules remain the profit core. AI upgrades convert them from passive dashboards to autonomous agents that rebalance stock, schedule labour, and replot warehouse slots without human intervention. Established vendors retrofit deep-learning add-ons, whereas smaller entrants release cloud-native platforms built around reinforcement learning. Competition therefore hinges on speed of insight delivery rather than breadth of feature checklists.
Cloud hosts delivered 62.31% of new installs in 2025, confirming that organisations prefer scalable compute and instant feature updates to custom on-premise stacks. Hybrid models gain favour where data sovereignty rules require sensitive workloads to remain in-house, yet batch analytics and AI training burst to the cloud for cost efficiency. Edge nodes push alerts to truck cabins and yard gates when connectivity lags, blending local autonomy with central governance. This distributed fabric unlocks multi-company use cases-from real-time ocean-freight tracking to collaborative capacity auctions-broadening the supply chain analytics market size for cloud vendors.
Complete Report Scope:
- By Component
- Software
- Demand Planning and Forecasting
- Procurement and Sourcing Analytics
- Inventory and Warehouse Analytics
- Logistics and Transportation Analytics
- Visualization and Reporting
- Services
- Professional Services
- Managed Services
- Software
- By Deployment
- On-premise
- Cloud
- Hybrid
- By Analytics Type
- Descriptive
- Diagnostic
- Predictive
- Prescriptive
- Cognitive
- By Application
- Inventory Management
- Demand Forecasting
- Procurement Analytics
- Supplier Performance Management
- Logistics and Transportation Optimisation
- Risk Management and Compliance
- Sustainability Analytics
- By End-use Industry
- Retail and E-commerce
- Manufacturing
- Automotive
- Healthcare and Life Sciences
- Food and Beverage
- Consumer Packaged Goods
- Aerospace and Defence
- High-Tech and Electronics
- Others
- By Enterprise Size
- Large Enterprises
- Small and Medium Enterprises (SMEs)
- By Geography
- North America
- United States
- Canada
- Mexico
- South America
- Brazil
- Argentina
- Rest of South America
- Europe
- Germany
- United Kingdom
- France
- Italy
- Spain
- Russia
- Rest of Europe
- Asia-Pacific
- China
- Japan
- India
- South Korea
- Australia and New Zealand
- Rest of Asia-Pacific
- Middle East and Africa
- Middle East
- Saudi Arabia
- UAE
- Turkey
- Rest of Middle East
- Africa
- South Africa
- Nigeria
- Kenya
- Rest of Africa
- Middle East
- North America
Geography Analysis
North America led with 40.85% share in 2025, driven by early cloud uptake, rich venture funding, and regulatory push for supply-chain transparency. US retailers apply predictive allocations to balance store and e-commerce stock, while manufacturers such as GM use analytics to steer chip sourcing strategies around capacity constraints. Federal incentives for semiconductor reshoring and clean-energy supply chains further elevate analytics budgets, as firms need live scenario modelling to weigh localisation against cost and risk.
Asia-Pacific is the fastest-growing region at 24.8% CAGR to 2031, buoyed by e-commerce booms, smart-factory programs, and government subsidies for cloud migration. Chinese enterprises apply cloud platforms to orchestrate flexible production and synchronise suppliers in sprawling industrial clusters mdpi.com . India's PLI (production-linked incentives) schemes entice global brands to build regional nodes, making visibility into tier-three suppliers a board mandate. Japanese manufacturers leverage analytics to redesign supplier ecosystems for resilience against natural disasters and geopolitical risk.
Europe retains a strong presence, led by sustainability analytics that supports strict CSRD disclosures. Automotive, aerospace, and chemicals companies use collaborative platforms like Confinity-X to pool demand forecasts and streamline inbound logistics, cutting both emissions and cost. South America and the Middle East and Africa expand from smaller bases, primarily in consumer goods, mining, and energy trade lanes where visibility gaps historically inflated working capital. Cross-border data corridors powered by cloud hyperscalers now enable real-time control-tower views in these emerging markets, reinforcing the global scope of the supply chain analytics market.
- IBM Corporation
- SAP SE
- Oracle Corporation
- Blue Yonder Group Inc.
- Accenture PLC
- Manhattan Associates
- Kinaxis Inc.
- Infor (Koch Industries)
- Coupa Software (Llamasoft)
- SAS Institute Inc.
- TIBCO Software Inc.
- Software AG
- Genpact Ltd.
- Aera Technology
- Capgemini SE
- Datup.ai
- GEP Worldwide
- Logility Inc.
- Resilinc
- QlikTech International AB
Additional Benefits:
- The market estimate (ME) sheet in Excel format
- 3 months of analyst support
TABLE OF CONTENTS
1 INTRODUCTION
- 1.1 Market Definition and Study Assumptions
- 1.2 Scope of the Study
2 RESEARCH METHODOLOGY
3 EXECUTIVE SUMMARY
4 MARKET LANDSCAPE
- 4.1 Market Overview
- 4.2 Market Drivers
- 4.2.1 Retail e-commerce boom compressing fulfil-ment cycles
- 4.2.2 Industry 4.0 adoption amplifies shop-floor data exhaust
- 4.2.3 Cloud affordability for advanced analytics stacks
- 4.2.4 Post-pandemic resiliency mandates multi-tier visibility
- 4.2.5 Scope-3 carbon-traceability regulations (EU CSRD, SEC)
- 4.2.6 Gen-AI copilots slashing modelling skill barriers
- 4.3 Market Restraints
- 4.3.1 Cyber-attacks on integrated data pipelines
- 4.3.2 High total cost of ownership for legacy upgrades
- 4.3.3 Data quality and interoperability issues across tiers
- 4.3.4 Export-control rules throttling cloud data residency
- 4.4 Value / Supply-Chain Analysis
- 4.5 Regulatory Landscape
- 4.6 Technological Outlook
- 4.7 Porter's Five Forces Analysis
- 4.7.1 Bargaining Power of Suppliers
- 4.7.2 Bargaining Power of Consumers
- 4.7.3 Threat of New Entrants
- 4.7.4 Threat of Substitutes
- 4.7.5 Intensity of Competitive Rivalry
- 4.8 Impact of Macroeconomic Factors
5 MARKET SIZE AND GROWTH FORECASTS (VALUE)
- 5.1 By Component
- 5.1.1 Software
- 5.1.1.1 Demand Planning and Forecasting
- 5.1.1.2 Procurement and Sourcing Analytics
- 5.1.1.3 Inventory and Warehouse Analytics
- 5.1.1.4 Logistics and Transportation Analytics
- 5.1.1.5 Visualization and Reporting
- 5.1.2 Services
- 5.1.2.1 Professional Services
- 5.1.2.2 Managed Services
- 5.1.1 Software
- 5.2 By Deployment
- 5.2.1 On-premise
- 5.2.2 Cloud
- 5.2.3 Hybrid
- 5.3 By Analytics Type
- 5.3.1 Descriptive
- 5.3.2 Diagnostic
- 5.3.3 Predictive
- 5.3.4 Prescriptive
- 5.3.5 Cognitive
- 5.4 By Application
- 5.4.1 Inventory Management
- 5.4.2 Demand Forecasting
- 5.4.3 Procurement Analytics
- 5.4.4 Supplier Performance Management
- 5.4.5 Logistics and Transportation Optimisation
- 5.4.6 Risk Management and Compliance
- 5.4.7 Sustainability Analytics
- 5.5 By End-use Industry
- 5.5.1 Retail and E-commerce
- 5.5.2 Manufacturing
- 5.5.3 Automotive
- 5.5.4 Healthcare and Life Sciences
- 5.5.5 Food and Beverage
- 5.5.6 Consumer Packaged Goods
- 5.5.7 Aerospace and Defence
- 5.5.8 High-Tech and Electronics
- 5.5.9 Others
- 5.6 By Enterprise Size
- 5.6.1 Large Enterprises
- 5.6.2 Small and Medium Enterprises (SMEs)
- 5.7 By Geography
- 5.7.1 North America
- 5.7.1.1 United States
- 5.7.1.2 Canada
- 5.7.1.3 Mexico
- 5.7.2 South America
- 5.7.2.1 Brazil
- 5.7.2.2 Argentina
- 5.7.2.3 Rest of South America
- 5.7.3 Europe
- 5.7.3.1 Germany
- 5.7.3.2 United Kingdom
- 5.7.3.3 France
- 5.7.3.4 Italy
- 5.7.3.5 Spain
- 5.7.3.6 Russia
- 5.7.3.7 Rest of Europe
- 5.7.4 Asia-Pacific
- 5.7.4.1 China
- 5.7.4.2 Japan
- 5.7.4.3 India
- 5.7.4.4 South Korea
- 5.7.4.5 Australia and New Zealand
- 5.7.4.6 Rest of Asia-Pacific
- 5.7.5 Middle East and Africa
- 5.7.5.1 Middle East
- 5.7.5.1.1 Saudi Arabia
- 5.7.5.1.2 UAE
- 5.7.5.1.3 Turkey
- 5.7.5.1.4 Rest of Middle East
- 5.7.5.2 Africa
- 5.7.5.2.1 South Africa
- 5.7.5.2.2 Nigeria
- 5.7.5.2.3 Kenya
- 5.7.5.2.4 Rest of Africa
- 5.7.5.1 Middle East
- 5.7.1 North America
6 COMPETITIVE LANDSCAPE
- 6.1 Market Concentration
- 6.2 Strategic Moves
- 6.3 Market Share Analysis
- 6.4 Company Profiles (includes Global level Overview, Market level overview, Core Segments, Financials as available, Strategic Information, Market Rank/Share for key companies, Products and Services, and Recent Developments)
- 6.4.1 IBM Corporation
- 6.4.2 SAP SE
- 6.4.3 Oracle Corporation
- 6.4.4 Blue Yonder Group Inc.
- 6.4.5 Accenture PLC
- 6.4.6 Manhattan Associates
- 6.4.7 Kinaxis Inc.
- 6.4.8 Infor (Koch Industries)
- 6.4.9 Coupa Software (Llamasoft)
- 6.4.10 SAS Institute Inc.
- 6.4.11 TIBCO Software Inc.
- 6.4.12 Software AG
- 6.4.13 Genpact Ltd.
- 6.4.14 Aera Technology
- 6.4.15 Capgemini SE
- 6.4.16 Datup.ai
- 6.4.17 GEP Worldwide
- 6.4.18 Logility Inc.
- 6.4.19 Resilinc
- 6.4.20 QlikTech International AB
7 MARKET OPPORTUNITIES AND FUTURE TRENDS
- 7.1 White-space and Unmet-need Assessment


